Estimated zip code population in 2022: 3,572 Zip code population in 2010: 2,759 Zip code population in 2000: 2,239
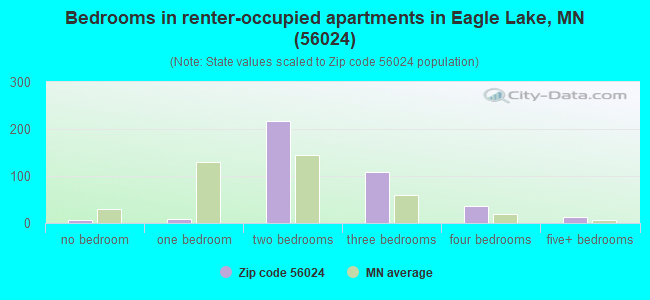
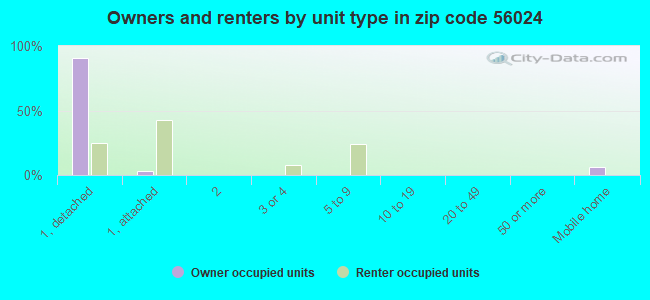
Houses and condos: 1,364 Renter-occupied apartments: 396
% of renters here:
30%
State:
28%
March 2022 cost of living index in zip code 56024: 80.2 (low, U.S. average is 100)
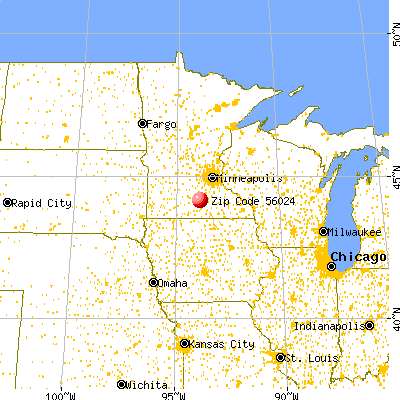
Land area: 19.9 sq. mi. Water area: 0.5 sq. mi.
Population density: 180 people per square mile
(very low).
OSM Map
General Map
Google Map
MSN Map
OSM Map
General Map
Google Map
MSN Map
OSM Map
General Map
Google Map
MSN Map
OSM Map
General Map
Google Map
MSN Map
Please wait while loading the map...
Real estate property taxes paid for housing units in 2022:
This zip code:
0.9% ($2,506)
Minnesota:
1.0% ($3,087)
Median real estate property taxes paid for housing units with mortgages in 2022: $2,471 (0.9%) Median real estate property taxes paid for housing units with no mortgage in 2022: $2,572 (1.1%)
Business Search- 14 Million verified businesses
Males: 1,831
(51.3%)
Females: 1,741
(48.7%)
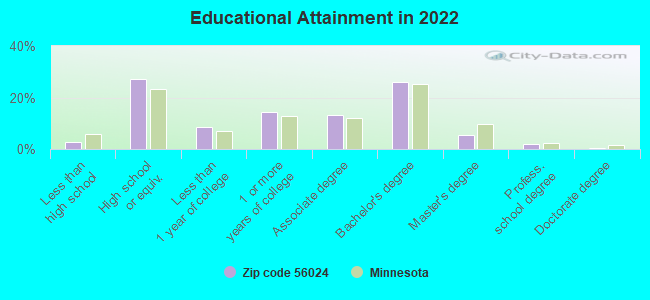
For population 25 years and over in 56024:
High school or higher: 96.9%
Bachelor's degree or higher: 33.8%
Graduate or professional degree: 7.8%
Unemployed: 2.8%
Mean travel time to work (commute): 18.6 minutes
For population 15 years and over in 56024:
Never married: 29.7%
Now married: 53.8%
Separated: 0.0%
Widowed: 3.9%
Divorced: 12.6%
Zip code 56024 compared to state average:
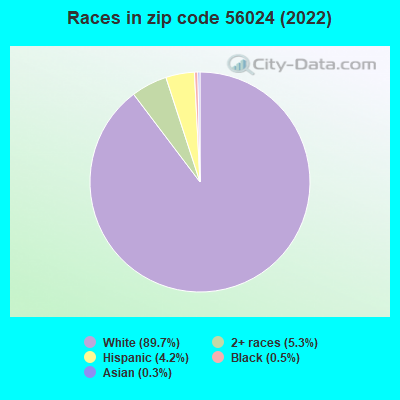
Black race population percentage significantly below state average.
Median age below state average.
Foreign-born population percentage significantly below state average.
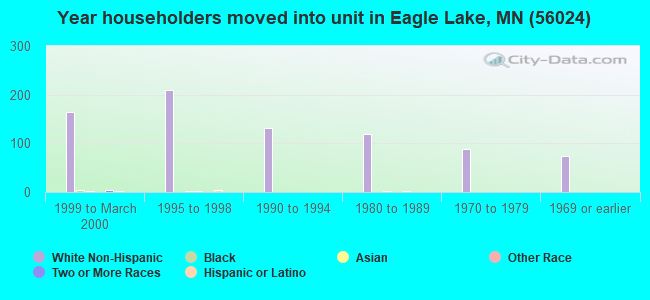
Length of stay since moving in significantly above state average.
Estimated median house/condo value in 2022: $272,258
56024:
$272,258
Minnesota:
$314,600
Median resident age:
This zip code:
33.6 years
Minnesota median age:
39.0 years
Average household size:
This zip code:
2.7 people
Minnesota:
2.4 people
Averages for the 2020 tax year for zip code 56024, filed in 2021:
Average Adjusted Gross Income (AGI) in 2020: $62,438 (Individual Income Tax Returns)
Here:
$62,438
State:
$82,178
Salary/wage: $56,195 (reported on 89.0% of returns)
Here:
$56,195
State:
$67,438
(% of AGI for various income ranges: 1280.9% for AGIs below $25k, 3756.7% for AGIs $25k-50k, 6622.6% for AGIs $50k-75k, 10344.6% for AGIs $75k-100k, 18209.0% for AGIs $100k-200k)
Taxable interest for individuals: $650 (reported on 35.8% of returns)
This zip code:
$650
Minnesota:
$1,814
(% of AGI for various income ranges: 18.8% for AGIs below $25k, 19.2% for AGIs $25k-50k, 16.8% for AGIs $50k-75k, 28.5% for AGIs $75k-100k, 77.0% for AGIs $100k-200k)
Ordinary dividends: $1,755 (reported on 17.9% of returns)
Here:
$1,755
State:
$6,928
(% of AGI for various income ranges: 11.6% for AGIs below $25k, 14.4% for AGIs $25k-50k, 14.2% for AGIs $50k-75k, 43.8% for AGIs $75k-100k, 185.5% for AGIs $100k-200k)
Net capital gain/loss in AGI: +$5,497 (reported on 16.8% of returns)
Here:
+$5,497
State:
+$20,591
(% of AGI for various income ranges: 23.4% for AGIs below $25k, 31.1% for AGIs $25k-50k, 46.3% for AGIs $50k-75k, 182.3% for AGIs $75k-100k, 541.0% for AGIs $100k-200k)
Profit/loss from business: +$12,355 (reported on 12.7% of returns)
Here:
+$12,355
State:
+$14,342
(% of AGI for various income ranges: 68.4% for AGIs below $25k, 151.4% for AGIs $25k-50k, 185.3% for AGIs $50k-75k, 375.4% for AGIs $75k-100k, 557.0% for AGIs $100k-200k)
Taxable individual retirement arrangement distribution: $12,821 (reported on 8.1% of returns)
56024:
$12,821
Minnesota:
$20,675
(% of AGI for various income ranges: 96.2% for AGIs below $25k, 166.9% for AGIs $25k-50k, 243.1% for AGIs $75k-100k, 285.0% for AGIs $100k-200k)
Total itemized deductions: $24,538 (reported on 4.6% of returns)
Here:
$24,538
State:
$33,311
(% of AGI for various income ranges: 460.0% for AGIs $50k-75k, 544.5% for AGIs $100k-200k)
Charity contributions: $7,320 (reported on 2.9% of returns)
Here:
$7,320
State:
$11,879
(% of AGI for various income ranges: 183.0% for AGIs $100k-200k)
Taxes paid: $7,338 (reported on 4.6% of returns)
56024:
$7,338
State:
$8,252
(% of AGI for various income ranges: 131.1% for AGIs $50k-75k, 169.0% for AGIs $100k-200k)
Earned income credit: $2,061 (reported on 13.3% of returns)
Here:
$2,061
State:
$2,055
(% of AGI for various income ranges: 80.6% for AGIs below $25k, 60.0% for AGIs $25k-50k)
Percentage of individuals using paid preparers for their 2020 taxes: 95.4%
Here:
95%
State:
94%
(% for various income ranges: 93.8% for AGIs below $25k, 93.5% for AGIs $25k-50k, 96.0% for AGIs $50k-75k, 94.7% for AGIs $75k-100k, 100.0% for AGIs $100k-200k, 100.0% for AGIs over 200k)
Averages for the 2012 tax year for zip code 56024, filed in 2013:
Average Adjusted Gross Income (AGI) in 2012: $52,494 (Individual Income Tax Returns)
Here:
$52,494
State:
$67,192
Salary/wage: $46,675 (reported on 91.5% of returns)
Here:
$46,675
State:
$55,182
(% of AGI for various income ranges: 80.2% for AGIs below $25k, 86.7% for AGIs $25k-50k, 85.8% for AGIs $50k-75k, 85.2% for AGIs $75k-100k, 82.5% for AGIs $100k-200k, 55.9% for AGIs over 200k)
Taxable interest for individuals: $608 (reported on 34.5% of returns)
This zip code:
$608
Minnesota:
$1,664
(% of AGI for various income ranges: 0.8% for AGIs below $25k, 0.5% for AGIs $25k-50k, 0.2% for AGIs $50k-75k, 0.2% for AGIs $75k-100k, 0.7% for AGIs $100k-200k)
Ordinary dividends: $2,238 (reported on 16.9% of returns)
Here:
$2,238
State:
$5,665
(% of AGI for various income ranges: 0.5% for AGIs below $25k, 0.3% for AGIs $25k-50k, 0.3% for AGIs $50k-75k, 0.5% for AGIs $75k-100k, 2.0% for AGIs $100k-200k)
Net capital gain/loss in AGI: +$1,919 (reported on 11.3% of returns)
Here:
+$1,919
State:
+$16,131
(% of AGI for various income ranges: 1.9% for AGIs $100k-200k)
Profit/loss from business: +$9,745 (reported on 15.5% of returns)
Here:
+$9,745
State:
+$12,430
(% of AGI for various income ranges: 4.4% for AGIs below $25k, 3.1% for AGIs $25k-50k, 3.9% for AGIs $50k-75k, 2.3% for AGIs $75k-100k, 3.2% for AGIs $100k-200k)
Taxable individual retirement arrangement distribution: $8,246 (reported on 9.2% of returns)
56024:
$8,246
Minnesota:
$15,212
(% of AGI for various income ranges: 3.2% for AGIs below $25k, 3.0% for AGIs $25k-50k, 3.1% for AGIs $75k-100k)
Total itemized deductions: $19,164 (21% of AGI, reported on 33.1% of returns)
Here:
$19,164
State:
$24,665
Here:
20.5% of AGI
State:
19.6% of AGI
(% of AGI for various income ranges: 5.8% for AGIs below $25k, 7.3% for AGIs $25k-50k, 12.3% for AGIs $50k-75k, 14.9% for AGIs $75k-100k, 14.8% for AGIs $100k-200k, 12.5% for AGIs over 200k)
Charity contributions: $2,718 (reported on 27.5% of returns)
Here:
$2,718
State:
$3,948
(% of AGI for various income ranges: 0.6% for AGIs $25k-50k, 1.4% for AGIs $50k-75k, 1.5% for AGIs $75k-100k, 3.1% for AGIs $100k-200k)
Taxes paid: $7,111 (reported on 33.1% of returns)
56024:
$7,111
State:
$10,589
(% of AGI for various income ranges: 0.9% for AGIs below $25k, 1.7% for AGIs $25k-50k, 3.8% for AGIs $50k-75k, 5.3% for AGIs $75k-100k, 6.5% for AGIs $100k-200k, 6.7% for AGIs over 200k)
Earned income credit: $1,943 (reported on 14.8% of returns)
Here:
$1,943
State:
$2,037
(% of AGI for various income ranges: 5.2% for AGIs below $25k, 0.8% for AGIs $25k-50k)
Percentage of individuals using paid preparers for their 2012 taxes: 58.5%
Here:
58%
State:
55%
(% for various income ranges: 50.0% for AGIs below $25k, 55.6% for AGIs $25k-50k, 63.6% for AGIs $50k-75k, 66.7% for AGIs $75k-100k, 71.4% for AGIs $100k-200k, 100.0% for AGIs over 200k)
Averages for the 2004 tax year for zip code 56024, filed in 2005:
Average Adjusted Gross Income (AGI) in 2004: $40,412 (Individual Income Tax Returns)
Here:
$40,412
State:
$53,560
Salary/wage: $37,245 (reported on 92.8% of returns)
Here:
$37,245
State:
$46,177
(% of AGI for various income ranges: 143.6% for AGIs below $10k, 86.3% for AGIs $10k-25k, 83.7% for AGIs $25k-50k, 91.1% for AGIs $50k-75k, 86.3% for AGIs $75k-100k, 70.5% for AGIs over 100k)
Taxable interest for individuals: $1,010 (reported on 42.2% of returns)
This zip code:
$1,010
Minnesota:
$1,796
(% of AGI for various income ranges: 2.8% for AGIs below $10k, 1.4% for AGIs $10k-25k, 1.3% for AGIs $25k-50k, 0.4% for AGIs $50k-75k, 0.5% for AGIs $75k-100k, 2.2% for AGIs over 100k)
Taxable dividends: $660 (reported on 21.0% of returns)
Here:
$660
State:
$3,096
(% of AGI for various income ranges: 0.9% for AGIs below $10k, 0.3% for AGIs $10k-25k, 0.3% for AGIs $25k-50k, 0.4% for AGIs $50k-75k, 0.2% for AGIs $75k-100k, 0.6% for AGIs over 100k)
Net capital gain/loss: +$3,465 (reported on 16.6% of returns)
Here:
+$3,465
State:
+$10,864
(% of AGI for various income ranges: -1.5% for AGIs below $10k, 0.1% for AGIs $10k-25k, 0.6% for AGIs $25k-50k, -0.3% for AGIs $50k-75k, 2.3% for AGIs $75k-100k, 5.8% for AGIs over 100k)
Profit/loss from business: +$9,223 (reported on 15.8% of returns)
Here:
+$9,223
State:
+$10,442
(% of AGI for various income ranges: -1.1% for AGIs below $10k, 0.6% for AGIs $10k-25k, 6.0% for AGIs $25k-50k, 3.0% for AGIs $50k-75k, 5.0% for AGIs $75k-100k, 1.6% for AGIs over 100k)
Profit/loss from farming: +$1,263 (reported on 1.6% of returns)
Here:
+$1,263
State:
-$962
IRA payment deduction: $3,317 (reported on 3.4% of returns)
56024:
$3,317
Minnesota:
$2,955
Total itemized deductions: $15,206 (22% of AGI, reported on 35.5% of returns)
Here:
$15,206
State:
$20,035
Here:
22.3% of AGI
State:
21.3% of AGI
(% of AGI for various income ranges: 17.2% for AGIs below $10k, 7.2% for AGIs $10k-25k, 11.4% for AGIs $25k-50k, 14.6% for AGIs $50k-75k, 15.6% for AGIs $75k-100k, 14.5% for AGIs over 100k)
Charity contributions deductions: $1,875 (3% of AGI, reported on 32.4% of returns)
Here:
$1,875
State:
$3,333
Here:
2.7% of AGI
State:
3.4% of AGI
(% of AGI for various income ranges: 0.7% for AGIs $10k-25k, 1.3% for AGIs $25k-50k, 1.6% for AGIs $50k-75k, 1.7% for AGIs $75k-100k, 2.0% for AGIs over 100k)
Total tax: $4,538 (reported on 79.1% of returns)
56024:
$4,538
State:
$8,485
(% of AGI for various income ranges: 3.9% for AGIs below $10k, 4.8% for AGIs $10k-25k, 7.0% for AGIs $25k-50k, 7.5% for AGIs $50k-75k, 9.6% for AGIs $75k-100k, 16.5% for AGIs over 100k)
Earned income credit: $1,544 (reported on 11.4% of returns)
Here:
$1,544
State:
$1,523
Percentage of individuals using paid preparers for their 2004 taxes: 62.4%
Here:
62%
State:
59%
(% for various income ranges: 47.0% for AGIs below $10k, 60.3% for AGIs $10k-25k, 68.4% for AGIs $25k-50k, 64.6% for AGIs $50k-75k, 73.5% for AGIs $75k-100k, 73.8% for AGIs over 100k)
Likely homosexual households (counted as self-reported same-sex unmarried-partner households)
Lesbian couples: 1.0% of all households
Gay men: 0.0% of all households
Household received Food Stamps/SNAP in the past 12 months: 118 Household did not receive Food Stamps/SNAP in the past 12 months: 1,211
Women who had a birth in the past 12 months: 82 (46 now married, 34 unmarried) Women who did not have a birth in the past 12 months: 732 (356 now married, 376 unmarried)
Housing units in zip code 56024 with a mortgage: 592 (74 second mortgage, 15 home equity loan, 47 both second mortgage and home equity loan) Houses without a mortgage: 17
Median monthly owner costs for units with a mortgage: $1,562 Median monthly owner costs for units without a mortgage: $602
Residents with income below the poverty level in 2022:
This zip code:
6.0%
Whole state:
9.6%
Residents with income below 50% of the poverty level in 2022:
This zip code:
1.7%
Whole state:
5.2%
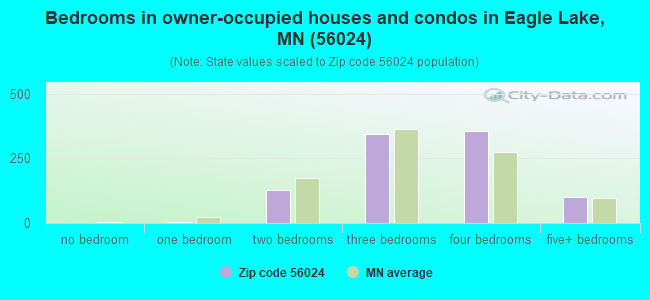
Median number of rooms in houses and condos:
Here:
6.9
State:
7.1
Median number of rooms in apartments:
Here:
4.8
State:
3.8
Notable locations in this zip code not listed on our city pages
Churches in zip code 56024 include: Church of Christ (A), Salem Evangelical Lutheran Church (B), Epiphany Lutheran Church (C). Display/hide their locations on the map
In group quarters: 12 (-1 institutionalized population)
Size of family households: 412 2-persons, 238 3-persons, 176 4-persons, 102 5-persons, 34 6-persons, 14 7-or-more-persons
Size of nonfamily households: 238 1-person, 78 2-persons, 25 3-persons
649 married couples with children.
291 single-parent households (159 men, 132 women).
97.5% of residents of 56024 zip code speak English at home.
1.8% of residents speak Spanish at home (58% very well, 42% not well).
0.1% of residents speak other language at home (100% not well).
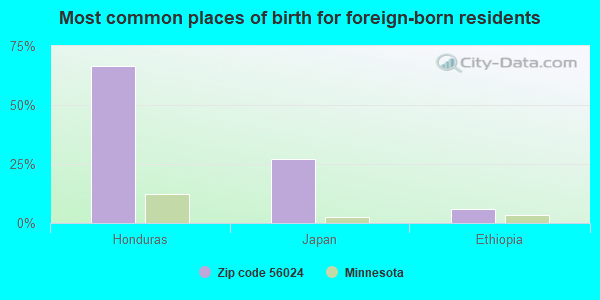
Foreign born population: 32 (0.9%) (29.3% of them are naturalized citizens)
This zip code:
0.9%
Whole state:
8.7%
67%Honduras
27%Japan
6%Ethiopia
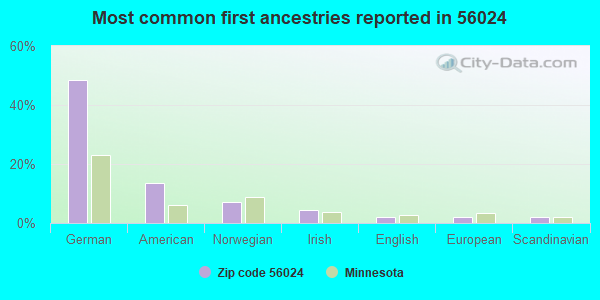
48%German
14%American
7%Norwegian
4%Irish
2%English
2%European
2%Scandinavian
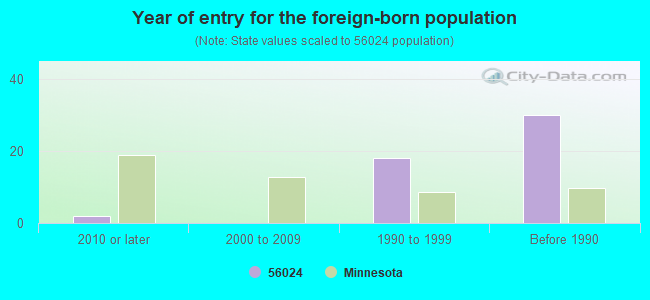
Year of entry for the foreign-born population
22010 or later
02000 to 2009
181990 to 1999
30Before 1990
Facilities with environmental interests located in this zip code:
GENES REPAIR INC (100 INDUSTRIAL DR in EAGLE LAKE, MN)
STATE MASTER (Minnesota Pollution Control Agency permits and compilance tracking) - RCRAINFO-MND130642457, CESQG, RCRIS-MND130642457, Small Quantity Generators, between 100 kg and 1000 kg of hazardous waste/month (Resource Conservation and Recovery Act (tracking hazardous waste)) - notification Business SIC classification: GENERAL AUTOMOTIVE REPAIR SHOPS Business NAICS classification: GENERAL AUTOMOTIVE REPAIR. Organizations: BRUENDER EUGENE (CONTACT/OWNER)
, GENE S REPAIR INC (CONTACT/OWNER)
A& B TRANSMISSION INC (60581 211TH ST in EAGLE LAKE, MN)
STATE MASTER (Minnesota Pollution Control Agency permits and compilance tracking) - RCRAINFO-MNR000012203, CESQG, RCRIS-MNR000012203, Conditionally Exempt Small Quantity Generators, less than 100 kg/month of hazardous waste (Resource Conservation and Recovery Act (tracking hazardous waste)) - notification Business SIC classification: AUTOMOTIVE TRANSMISSION REPAIR SHOPS Business NAICS classification: AUTOMOTIVE TRANSMISSION REPAIR. Organizations: MIKE BARTEN (CONTACT/OWNER)
, A & B TRANSMISSION INC (CONTACT/OWNER)
Alternative names: A & B TRANSMISSIONS INC
HOLMBERG BRADLEY A DDS (104 PLAINVIEW in EAGLE LAKE, MN)
STATE MASTER (Minnesota Pollution Control Agency permits and compilance tracking) - RCRAINFO-MND985706837, CESQG, RCRIS-MND985706837, Conditionally Exempt Small Quantity Generators, less than 100 kg/month of hazardous waste (Resource Conservation and Recovery Act (tracking hazardous waste)) - notification Business SIC classification: OFFICES AND CLINICS OF DENTISTS Business NAICS classification: OFFICES OF DENTISTS.
Housing units lacking complete kitchen facilities: 0.2%
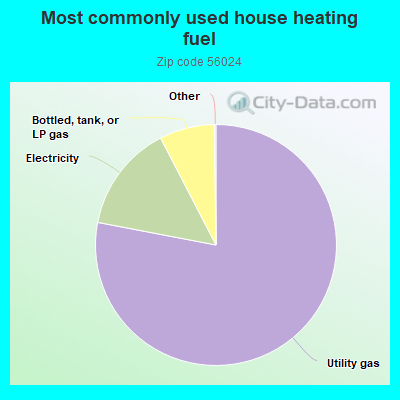
78.1%Utility gas
14.4%Electricity
7.4%Bottled, tank, or LP gas
Population in 1990: 2,218. Population change in the 1990s: +21 (+0.9%).
Place of birth for U.S.-born residents:
This state: 2,896
Northeast: 27
Midwest: 331
South: 141
West: 113
61% of the 56024 zip code residents lived in the same house 5 years ago. Out of people who lived in different houses, 57% lived in this county. Out of people who lived in different counties, 50% lived in Minnesota.
85% of the 56024 zip code residents lived in the same house 1 year ago. Out of people who lived in different houses, 34% moved from this county. Out of people who lived in different houses, 54% moved from different county within same state. Out of people who lived in different houses, 9% moved from different state. Out of people who lived in different houses, 1% moved from abroad.
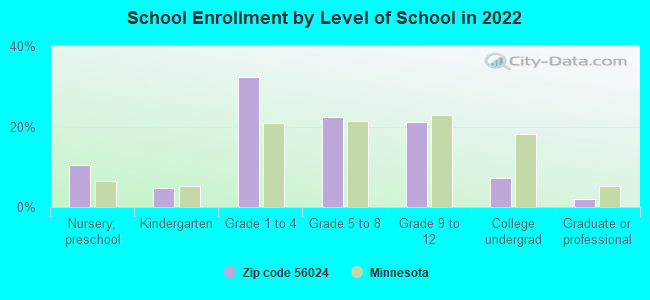
Private vs. public school enrollment:
Students in private schools in grades 1 to 8 (elementary and middle school): 34
Here:
7.5%
Minnesota:
12.9%
Students in private schools in grades 9 to 12 (high school): 5
Here:
3.1%
Minnesota:
8.6%
Students in private undergraduate colleges: 7
Here:
13.0%
Minnesota:
26.2%
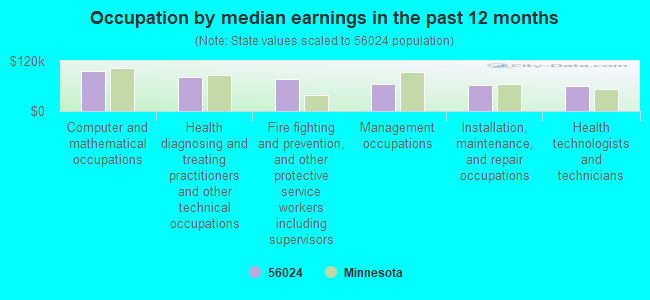
Occupation by median earnings in the past 12 months ($)
95,323Computer and mathematical occupations
80,679Health diagnosing and treating practitioners and other technical occupations
76,122Fire fighting and prevention, and other protective service workers including supervisors
65,666Management occupations
61,629Installation, maintenance, and repair occupations
59,175Health technologists and technicians
Top industries in this zip code by the number of employees in 2005:
Health Care and Social Assistance: Offices of Dentists (10-19: 1)
Other Services (except Public Administration): General Automotive Repair (5-9: 2)
Construction: New Single-Family Housing Construction (except Operative Builders) (1-4: 4)
Other Services (except Public Administration): Civic and Social Organizations (5-9: 1)
Other Services (except Public Administration): Religious Organizations (5-9: 1)
Construction: Water and Sewer Line and Related Structures Construction (5-9: 1)
Construction: Highway, Street, and Bridge Construction (5-9: 1)
Other Services (except Public Administration): Automotive Body, Paint, and Interior Repair and Maintenance (5-9: 1)
People in group quarters in 2010:
8 people in group homes intended for adults
Fatal accident statistics in 2014:
Fatal accident count: 1
Vehicles involved in fatal accidents: 2
Fatal accidents caused by drunken drivers: 0
Fatalities: 1
Persons involved in fatal accidents: 3
Pedestrians involved in fatal accidents: 0
Fatal accident statistics in 2013:
Fatal accident count: 1
Vehicles involved in fatal accidents: 1
Fatal accidents caused by drunken drivers: 0
Fatalities: 1
Persons involved in fatal accidents: 1
Pedestrians involved in fatal accidents: 0
Home Mortgage Disclosure Act Aggregated Statistics For Year 2009 (Based on 2 partial tracts)
A) FHA, FSA/RHS & VA Home Purchase Loans
B) Conventional Home Purchase Loans
C) Refinancings
D) Home Improvement Loans
E) Loans on Dwellings For 5+ Families
F) Non-occupant Loans on < 5 Family Dwellings (A B C & D)
G) Loans On Manufactured Home Dwelling (A B C & D)
Number
Average Value
Number
Average Value
Number
Average Value
Number
Average Value
Number
Average Value
Number
Average Value
Number
Average Value
LOANS ORIGINATED
13
$134,332
11
$189,882
89
$173,559
6
$141,543
1
$229,550
5
$217,762
0
$0
APPLICATIONS APPROVED, NOT ACCEPTED
1
$136,170
1
$6,110
7
$147,684
1
$123,390
0
$0
1
$86,700
1
$45,580
APPLICATIONS DENIED
1
$191,750
2
$122,555
17
$163,830
2
$48,075
0
$0
2
$75,035
1
$130,610
APPLICATIONS WITHDRAWN
1
$127,830
1
$44,460
16
$185,984
1
$25,010
0
$0
0
$0
0
$0
FILES CLOSED FOR INCOMPLETENESS
0
$0
2
$134,505
6
$181,377
2
$20,840
0
$0
1
$38,910
0
$0
Detailed HMDA statistics for the following Tracts:9701.00
Private Mortgage Insurance Companies Aggregated Statistics For Year 2009 (Based on 2 partial tracts)
A) Conventional Home Purchase Loans
B) Refinancings
Number
Average Value
Number
Average Value
LOANS ORIGINATED
6
$197,308
2
$244,275
APPLICATIONS APPROVED, NOT ACCEPTED
0
$0
2
$135,615
APPLICATIONS DENIED
0
$0
0
$0
APPLICATIONS WITHDRAWN
0
$0
0
$0
FILES CLOSED FOR INCOMPLETENESS
1
$257,890
0
$0
Detailed PMIC statistics for the following Tracts:9701.00
2002 - 2018 National Fire Incident Reporting System (NFIRS) incidents
Based on the data from the years 2002 - 2018 the average number of fires per year is 12. The highest number of reported fire incidents - 20 took place in 2002, and the least - 5 in 2018. The data has a declining trend.
When looking into fire subcategories, the most incidents belonged to: Outside Fires (40.4%), and Structure Fires (36.4%).
Fire incident types reported to NFIRS in Zip Code 56024


+$1,263
-$962
 Nearest zip codes: 56080, 56063, 56048, 56001, 56028, 56078.


 Based on the data from the years 2002 - 2018 the average number of fires per year is 12. The highest number of reported fire incidents - 20 took place in 2002, and the least - 5 in 2018. The data has a declining trend.
 When looking into fire subcategories, the most incidents belonged to: Outside Fires (40.4%), and Structure Fires (36.4%).