Estimated zip code population in 2022: 1,042 Zip code population in 2010: 1,017 Zip code population in 2000: 1,151
Houses and condos: 367 Renter-occupied apartments: 40
% of renters here:
12%
State:
28%
March 2022 cost of living index in zip code 56119: 85.2 (less than average, U.S. average is 100)
Land area: 90.6 sq. mi. Water area: 0.8 sq. mi.
Population density: 12 people per square mile
(very low).
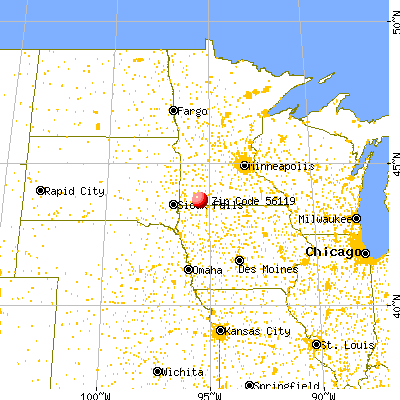
OSM Map
General Map
Google Map
MSN Map
OSM Map
General Map
Google Map
MSN Map
OSM Map
General Map
Google Map
MSN Map
OSM Map
General Map
Google Map
MSN Map
Please wait while loading the map...
Real estate property taxes paid for housing units in 2022:
This zip code:
0.7% ($1,296)
Minnesota:
1.0% ($3,087)
Median real estate property taxes paid for housing units with mortgages in 2022: $1,220 (0.7%) Median real estate property taxes paid for housing units with no mortgage in 2022: $1,340 (0.8%)
Business Search- 14 Million verified businesses
Males: 586
(56.2%)
Females: 456
(43.8%)
For population 25 years and over in 56119:
High school or higher: 94.3%
Bachelor's degree or higher: 14.0%
Graduate or professional degree: 3.6%
Unemployed: 2.1%
Mean travel time to work (commute): 16.6 minutes
For population 15 years and over in 56119:
Never married: 22.1%
Now married: 66.6%
Separated: 0.9%
Widowed: 4.2%
Divorced: 6.2%
Zip code 56119 compared to state average:
Median house value below state average.
Black race population percentage significantly below state average.
Hispanic race population percentage significantly above state average.
Foreign-born population percentage above state average.
Renting percentage significantly below state average.
Length of stay since moving in significantly above state average.
Percentage of population with a bachelor's degree or higher significantly below state average.
Estimated median house/condo value in 2022: $179,677
56119:
$179,677
Minnesota:
$314,600
Median resident age:
This zip code:
41.7 years
Minnesota median age:
39.0 years
Average household size:
This zip code:
3.0 people
Minnesota:
2.4 people
Averages for the 2020 tax year for zip code 56119, filed in 2021:
Average Adjusted Gross Income (AGI) in 2020: $61,081 (Individual Income Tax Returns)
Here:
$61,081
State:
$82,178
Salary/wage: $45,731 (reported on 80.8% of returns)
Here:
$45,731
State:
$67,438
(% of AGI for various income ranges: 1343.0% for AGIs below $25k, 4526.2% for AGIs $25k-50k, 8247.5% for AGIs $50k-75k, 13120.0% for AGIs $75k-100k, 23360.0% for AGIs $100k-200k)
Taxable interest for individuals: $862 (reported on 40.4% of returns)
This zip code:
$862
Minnesota:
$1,814
(% of AGI for various income ranges: 18.0% for AGIs below $25k, 51.2% for AGIs $25k-50k, 22.5% for AGIs $50k-75k, 40.0% for AGIs $75k-100k, 336.7% for AGIs $100k-200k)
Ordinary dividends: $1,833 (reported on 23.1% of returns)
Here:
$1,833
State:
$6,928
(% of AGI for various income ranges: 72.5% for AGIs $25k-50k, 90.0% for AGIs $75k-100k, 450.0% for AGIs $100k-200k)
Net capital gain/loss in AGI: +$3,167 (reported on 17.3% of returns)
Here:
+$3,167
State:
+$20,591
(% of AGI for various income ranges: 10.0% for AGIs below $25k, 137.5% for AGIs $50k-75k, 733.3% for AGIs $100k-200k)
Profit/loss from business: +$8,186 (reported on 13.5% of returns)
Here:
+$8,186
State:
+$14,342
(% of AGI for various income ranges: 575.0% for AGIs $25k-50k, 376.7% for AGIs $100k-200k)
Taxable individual retirement arrangement distribution: $8,760 (reported on 9.6% of returns)
56119:
$8,760
Minnesota:
$20,675
(% of AGI for various income ranges: 294.0% for AGIs below $25k, 480.0% for AGIs $75k-100k)
Earned income credit: $1,850 (reported on 11.5% of returns)
Here:
$1,850
State:
$2,055
(% of AGI for various income ranges: 67.0% for AGIs below $25k, 55.0% for AGIs $25k-50k)
Percentage of individuals using paid preparers for their 2020 taxes: 96.2%
Here:
96%
State:
94%
(% for various income ranges: 93.8% for AGIs below $25k, 100.0% for AGIs $25k-50k, 87.5% for AGIs $50k-75k, 100.0% for AGIs $75k-100k, 100.0% for AGIs $100k-200k)
Averages for the 2012 tax year for zip code 56119, filed in 2013:
Average Adjusted Gross Income (AGI) in 2012: $54,181 (Individual Income Tax Returns)
Here:
$54,181
State:
$67,192
Salary/wage: $35,098 (reported on 84.6% of returns)
Here:
$35,098
State:
$55,182
(% of AGI for various income ranges: 74.6% for AGIs below $25k, 74.6% for AGIs $25k-50k, 74.5% for AGIs $50k-75k, 68.1% for AGIs $75k-100k, 29.0% for AGIs $100k-200k)
Taxable interest for individuals: $735 (reported on 44.2% of returns)
This zip code:
$735
Minnesota:
$1,664
(% of AGI for various income ranges: 0.9% for AGIs below $25k, 0.4% for AGIs $25k-50k, 0.3% for AGIs $50k-75k, 0.6% for AGIs $75k-100k, 0.7% for AGIs $100k-200k)
Ordinary dividends: $1,070 (reported on 19.2% of returns)
Here:
$1,070
State:
$5,665
(% of AGI for various income ranges: 0.3% for AGIs $25k-50k, 0.5% for AGIs $50k-75k, 0.6% for AGIs $100k-200k)
Net capital gain/loss in AGI: +$1,550 (reported on 15.4% of returns)
Here:
+$1,550
State:
+$16,131
(% of AGI for various income ranges: 0.2% for AGIs $50k-75k, 1.2% for AGIs $100k-200k)
Profit/loss from business: +$5,114 (reported on 13.5% of returns)
Here:
+$5,114
State:
+$12,430
Taxable individual retirement arrangement distribution: $4,400 (reported on 7.7% of returns)
56119:
$4,400
Minnesota:
$15,212
Total itemized deductions: $18,164 (19% of AGI, reported on 21.2% of returns)
Here:
$18,164
State:
$24,665
Here:
19.1% of AGI
State:
19.6% of AGI
(% of AGI for various income ranges: 17.8% for AGIs below $25k, 16.4% for AGIs $50k-75k, 7.4% for AGIs $100k-200k)
Charity contributions: $2,878 (reported on 17.3% of returns)
Here:
$2,878
State:
$3,948
Taxes paid: $7,618 (reported on 21.2% of returns)
56119:
$7,618
State:
$10,589
(% of AGI for various income ranges: 4.2% for AGIs below $25k, 4.9% for AGIs $50k-75k, 4.5% for AGIs $100k-200k)
Earned income credit: $2,300 (reported on 11.5% of returns)
Here:
$2,300
State:
$2,037
(% of AGI for various income ranges: 4.9% for AGIs below $25k, 0.7% for AGIs $25k-50k)
Percentage of individuals using paid preparers for their 2012 taxes: 76.9%
Here:
77%
State:
55%
(% for various income ranges: 70.6% for AGIs below $25k, 78.6% for AGIs $25k-50k, 75.0% for AGIs $50k-75k, 66.7% for AGIs $75k-100k, 100.0% for AGIs $100k-200k)
Averages for the 2004 tax year for zip code 56119, filed in 2005:
Average Adjusted Gross Income (AGI) in 2004: $33,663 (Individual Income Tax Returns)
Here:
$33,663
State:
$53,560
Salary/wage: $27,118 (reported on 82.5% of returns)
Here:
$27,118
State:
$46,177
(% of AGI for various income ranges: 90.4% for AGIs below $10k, 68.5% for AGIs $10k-25k, 70.0% for AGIs $25k-50k, 67.6% for AGIs $50k-75k, 55.0% for AGIs $75k-100k)
Taxable interest for individuals: $1,261 (reported on 45.6% of returns)
This zip code:
$1,261
Minnesota:
$1,796
(% of AGI for various income ranges: 5.5% for AGIs below $10k, 3.9% for AGIs $10k-25k, 1.8% for AGIs $25k-50k, 1.2% for AGIs $50k-75k, 0.4% for AGIs $75k-100k)
Taxable dividends: $698 (reported on 22.6% of returns)
Here:
$698
State:
$3,096
(% of AGI for various income ranges: 1.5% for AGIs below $10k, 0.4% for AGIs $10k-25k, 0.7% for AGIs $25k-50k, 0.4% for AGIs $50k-75k, 0.1% for AGIs $75k-100k)
Net capital gain/loss: +$641 (reported on 17.9% of returns)
Here:
+$641
State:
+$10,864
Profit/loss from business: +$5,654 (reported on 15.8% of returns)
Here:
+$5,654
State:
+$10,442
Profit/loss from farming: +$12,144 (reported on 20.3% of returns)
Here:
+$12,144
State:
-$962
(% of AGI for various income ranges: 11.1% for AGIs below $10k, 5.9% for AGIs $10k-25k, 5.4% for AGIs $25k-50k, 7.7% for AGIs $50k-75k, 9.9% for AGIs $75k-100k)
IRA payment deduction: $2,286 (reported on 4.1% of returns)
56119:
$2,286
Minnesota:
$2,955
Total itemized deductions: $14,256 (29% of AGI, reported on 16.8% of returns)
Here:
$14,256
State:
$20,035
Here:
28.8% of AGI
State:
21.3% of AGI
(% of AGI for various income ranges: 10.7% for AGIs $10k-25k, 6.9% for AGIs $25k-50k, 6.1% for AGIs $50k-75k, 7.6% for AGIs $75k-100k)
Charity contributions deductions: $2,095 (4% of AGI, reported on 14.4% of returns)
Here:
$2,095
State:
$3,333
Here:
4.2% of AGI
State:
3.4% of AGI
(% of AGI for various income ranges: 1.1% for AGIs $10k-25k, 0.9% for AGIs $25k-50k, 0.9% for AGIs $50k-75k, 0.8% for AGIs $75k-100k)
Total tax: $3,761 (reported on 79.9% of returns)
56119:
$3,761
State:
$8,485
(% of AGI for various income ranges: 3.7% for AGIs below $10k, 4.7% for AGIs $10k-25k, 8.0% for AGIs $25k-50k, 9.6% for AGIs $50k-75k, 12.5% for AGIs $75k-100k)
Earned income credit: $1,778 (reported on 12.3% of returns)
Here:
$1,778
State:
$1,523
Percentage of individuals using paid preparers for their 2004 taxes: 79.9%
Here:
80%
State:
59%
(% for various income ranges: 70.9% for AGIs below $10k, 78.3% for AGIs $10k-25k, 85.6% for AGIs $25k-50k, 83.2% for AGIs $50k-75k, 80.0% for AGIs $75k-100k)
Household received Food Stamps/SNAP in the past 12 months: 7 Household did not receive Food Stamps/SNAP in the past 12 months: 342
Women who had a birth in the past 12 months: 13 (10 now married, 2 unmarried) Women who did not have a birth in the past 12 months: 191 (112 now married, 79 unmarried)
Housing units in zip code 56119 with a mortgage: 142 (11 second mortgage, 12 both second mortgage and home equity loan) Houses without a mortgage: 1
Median monthly owner costs for units with a mortgage: $1,247 Median monthly owner costs for units without a mortgage: $511
Residents with income below the poverty level in 2022:
This zip code:
7.7%
Whole state:
9.6%
Residents with income below 50% of the poverty level in 2022:
This zip code:
3.1%
Whole state:
5.2%
Median number of rooms in houses and condos:
Here:
7.0
State:
7.1
Median number of rooms in apartments:
Here:
4.3
State:
3.8
Notable locations in this zip code not listed on our city pages
Size of family households: 139 2-persons, 25 3-persons, 47 4-persons, 29 5-persons, 4 6-persons, 12 7-or-more-persons
Size of nonfamily households: 75 1-person, 14 2-persons, 1 3-persons
161 married couples with children.
38 single-parent households (5 men, 33 women).
74.8% of residents of 56119 zip code speak English at home.
21.6% of residents speak Spanish at home (79% very well, 19% well, 3% not well).
1.9% of residents speak Asian or Pacific Island language at home (47% very well, 53% not well).
Foreign born population: 165 (15.8%) (19.9% of them are naturalized citizens)
This zip code:
15.8%
Whole state:
8.7%
85%Honduras
4%Laos
4%Mexico
1%Chile
40%German
6%American
1%English
1%Irish
1%Norwegian
1%European
1%Scottish
Year of entry for the foreign-born population
392010 or later
1092000 to 2009
91990 to 1999
7Before 1990
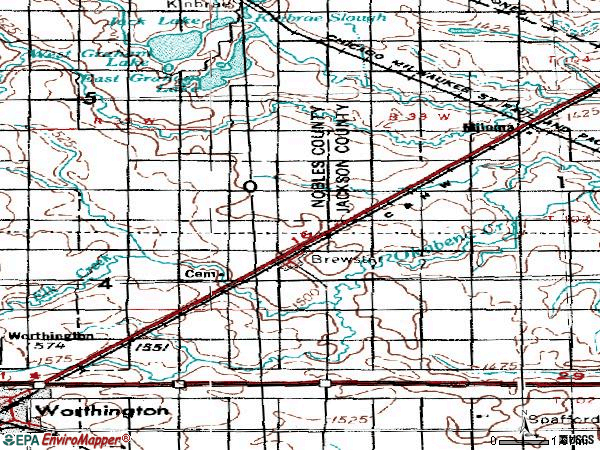
Facilities with environmental interests located in this zip code:
STATE MASTER (Minnesota Pollution Control Agency permits and compilance tracking) - PCS-MN0021750, NPDES NON-MAJOR National Pollutant Discharge Elimination System NON-MAJOR (Tracking pollutant discharge elimination systems) - permit National Pollutant Discharge Elimination System NON-MAJOR (Tracking pollutant discharge elimination systems) - permit COMMUNITY WATER SYSTEM (SDWIS) - SDWIS-MN1530003 3, WATER TREATMENT PLANT Business SIC classification: SEWERAGE SYSTEMS Business NAICS classification: SEWAGE TREATMENT FACILITIES. Organizations: BREWSTER CITY OF (CONTACT/OWNER)
Alternative names: BREWSTER WWTF, BREWSTER WWTP
AIR MAJOR (AIRS/AFS) STATE MASTER (Minnesota Pollution Control Agency permits and compilance tracking) - AIRS-2710500053, AIR PROGRAM, AFS-2710500053, AIR MAJOR, RCRIS-MNS000102673, HAZARDOUS WASTE PROGRAM (Resource Conservation and Recovery Act (tracking hazardous waste)) TRI REPORTER (Tracking of toxic chemicals releasing facilities) Business SIC classification: SOYBEAN OIL MILLS; SHORTENING, TABLE OILS, MARGARINE, AND OTHER EDIBLE FATS AND OILS; INDUSTRIAL ORGANIC CHEMICALS Business NAICS classification: SOYBEAN PROCESSING. Organizations: MINNESOTA SOYBEAN PROCESSORS - BREWSTER (CONTACT/OWNER)
Alternative names: MINNESOTA SOYBEAN PROCESSORS - BREWSTER
BREWSTER PUBLIC SCHOOL (915 4TH ST in BREWSTER, MN)
STATE MASTER (Minnesota Pollution Control Agency permits and compilance tracking) - RCRAINFO-MND985749639, CESQG, RCRIS-MND985749639, (Resource Conservation and Recovery Act (tracking hazardous waste)) Business SIC classification: ELEMENTARY AND SECONDARY SCHOOLS
BREWSTER EL. (915 4TH AVE. in BREWSTER, MN)
(National Center for Education Statistics) - STATE ID-010513010
Housing units lacking complete plumbing facilities: 0.2% Housing units lacking complete kitchen facilities: 2.4%
45.5%Bottled, tank, or LP gas
38.2%Utility gas
8.9%Electricity
7.1%Fuel oil, kerosene, etc.
0.6%Other fuel
0.6%No fuel used
Population in 1990: 800. Population change in the 1990s: +351 (+43.9%).
Place of birth for U.S.-born residents:
This state: 676
Northeast: 6
Midwest: 140
South: 44
West: 8
73% of the 56119 zip code residents lived in the same house 5 years ago. Out of people who lived in different houses, 63% lived in this county. Out of people who lived in different counties, 50% lived in Minnesota.
92% of the 56119 zip code residents lived in the same house 1 year ago. Out of people who lived in different houses, 57% moved from this county. Out of people who lived in different houses, 11% moved from different county within same state. Out of people who lived in different houses, 28% moved from different state. Out of people who lived in different houses, 6% moved from abroad.
Private vs. public school enrollment:
Students in private schools in grades 1 to 8 (elementary and middle school): 11
Here:
8.4%
Minnesota:
12.9%
Students in private schools in grades 9 to 12 (high school):
Here:
0.0%
Minnesota:
8.6%
Students in private undergraduate colleges: 18
Here:
62.3%
Minnesota:
26.2%
Occupation by median earnings in the past 12 months ($)
71,809Management occupations
68,352Business and financial operations occupations
67,045Health diagnosing and treating practitioners and other technical occupations
59,785Transportation occupations
58,799Installation, maintenance, and repair occupations
54,728Life, physical, and social science occupations
Top industries in this zip code by the number of employees in 2005:
Accommodation and Food Services: Limited-Service Restaurants (20-49 employees: 1 establishment)
Arts, Entertainment, and Recreation: Fitness and Recreational Sports Centers (10-19: 1)
Other Services (except Public Administration): Religious Organizations (5-9: 1, 1-4: 2)
Real Estate and Rental and Leasing: Lessors of Residential Buildings and Dwellings (5-9: 1)
Finance and Insurance: Insurance Agencies and Brokerages (1-4: 1)
Construction: Painting and Wall Covering Contractors (1-4: 1)
Fatal accident statistics in 2014:
Fatal accident count: 1
Vehicles involved in fatal accidents: 1
Fatal accidents caused by drunken drivers: 1
Fatalities: 1
Persons involved in fatal accidents: 1
Pedestrians involved in fatal accidents: 0
Fatal accident statistics in 2013:
Fatal accident count: 1
Vehicles involved in fatal accidents: 2
Fatal accidents caused by drunken drivers: 0
Fatalities: 1
Persons involved in fatal accidents: 3
Pedestrians involved in fatal accidents: 0
2002 - 2018 National Fire Incident Reporting System (NFIRS) incidents
According to the data from the years 2002 - 2018 the average number of fire incidents per year is 7. The highest number of reported fires - 19 took place in 2009, and the least - 2 in 2006. The data has a constant trend.
When looking into fire subcategories, the most incidents belonged to: Outside Fires (39.4%), and Structure Fires (33.9%).
Fire incident types reported to NFIRS in Zip Code 56119


+$12,144
-$962
(% of AGI for various income ranges: 11.1% for AGIs below $10k, 5.9% for AGIs $10k-25k, 5.4% for AGIs $25k-50k, 7.7% for AGIs $50k-75k, 9.9% for AGIs $75k-100k)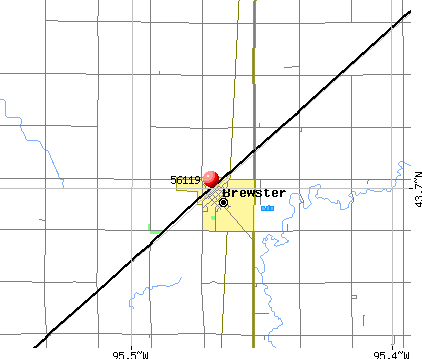 Nearest zip codes: 56161, 56187, 56167, 56131, 56137, 56165.


 According to the data from the years 2002 - 2018 the average number of fire incidents per year is 7. The highest number of reported fires - 19 took place in 2009, and the least - 2 in 2006. The data has a constant trend.
 When looking into fire subcategories, the most incidents belonged to: Outside Fires (39.4%), and Structure Fires (33.9%).