Estimated zip code population in 2022: 2,248 Zip code population in 2010: 2,365 Zip code population in 2000: 2,560
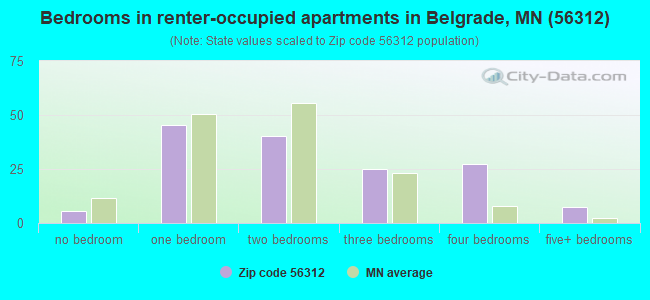
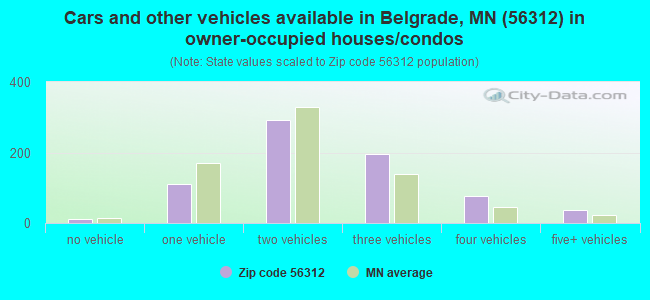
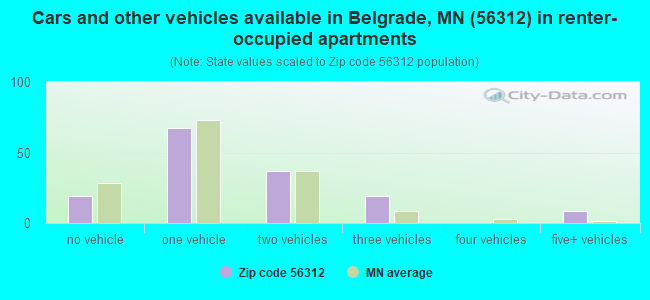
Houses and condos: 967 Renter-occupied apartments: 151
% of renters here:
17%
State:
28%
March 2022 cost of living index in zip code 56312: 86.5 (less than average, U.S. average is 100)
Land area: 173.7 sq. mi. Water area: 2.3 sq. mi.
Population density: 13 people per square mile
(very low).
OSM Map
General Map
Google Map
MSN Map
OSM Map
General Map
Google Map
MSN Map
OSM Map
General Map
Google Map
MSN Map
OSM Map
General Map
Google Map
MSN Map
Please wait while loading the map...
Real estate property taxes paid for housing units in 2022:
This zip code:
0.7% ($1,852)
Minnesota:
1.0% ($3,087)
Median real estate property taxes paid for housing units with mortgages in 2022: $1,758 (0.7%) Median real estate property taxes paid for housing units with no mortgage in 2022: $1,984 (0.9%)
Business Search- 14 Million verified businesses
Males: 1,211
(53.9%)
Females: 1,036
(46.1%)
For population 25 years and over in 56312:
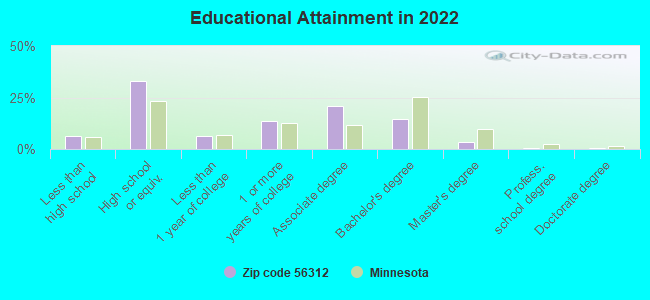
High school or higher: 92.0%
Bachelor's degree or higher: 19.2%
Graduate or professional degree: 4.8%
Unemployed: 1.1%
Mean travel time to work (commute): 21.8 minutes
For population 15 years and over in 56312:
Never married: 29.7%
Now married: 53.7%
Separated: 0.8%
Widowed: 5.6%
Divorced: 10.2%
Zip code 56312 compared to state average:
Unemployed percentage significantly below state average.
Black race population percentage significantly below state average.
Foreign-born population percentage significantly below state average.
Renting percentage below state average.
Length of stay since moving in significantly above state average.
Percentage of population with a bachelor's degree or higher below state average.
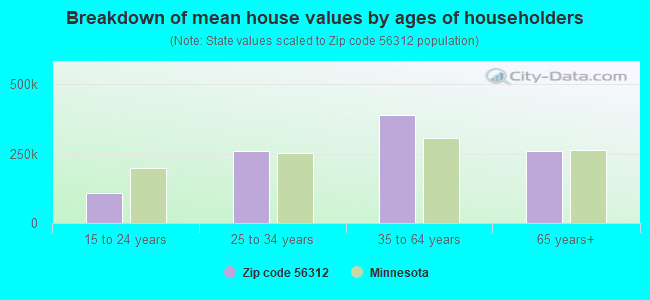
Estimated median house/condo value in 2022: $247,139
56312:
$247,139
Minnesota:
$314,600
Median resident age:
This zip code:
36.6 years
Minnesota median age:
39.0 years
Average household size:
This zip code:
2.5 people
Minnesota:
2.4 people
Averages for the 2020 tax year for zip code 56312, filed in 2021:
Average Adjusted Gross Income (AGI) in 2020: $62,504 (Individual Income Tax Returns)
Here:
$62,504
State:
$82,178
Salary/wage: $51,119 (reported on 84.1% of returns)
Here:
$51,119
State:
$67,438
(% of AGI for various income ranges: 1621.7% for AGIs below $25k, 4187.6% for AGIs $25k-50k, 7291.8% for AGIs $50k-75k, 12900.0% for AGIs $75k-100k, 18386.2% for AGIs $100k-200k)
Taxable interest for individuals: $1,869 (reported on 45.8% of returns)
This zip code:
$1,869
Minnesota:
$1,814
(% of AGI for various income ranges: 65.0% for AGIs below $25k, 44.8% for AGIs $25k-50k, 131.8% for AGIs $50k-75k, 170.0% for AGIs $75k-100k, 241.2% for AGIs $100k-200k)
Ordinary dividends: $1,895 (reported on 18.7% of returns)
Here:
$1,895
State:
$6,928
(% of AGI for various income ranges: 26.1% for AGIs below $25k, 31.9% for AGIs $25k-50k, 60.9% for AGIs $50k-75k, 66.7% for AGIs $75k-100k, 197.5% for AGIs $100k-200k)
Net capital gain/loss in AGI: +$14,868 (reported on 20.6% of returns)
Here:
+$14,868
State:
+$20,591
(% of AGI for various income ranges: 63.3% for AGIs below $25k, 134.3% for AGIs $25k-50k, 188.2% for AGIs $50k-75k, 630.0% for AGIs $75k-100k, 2862.5% for AGIs $100k-200k)
Profit/loss from business: +$7,994 (reported on 15.0% of returns)
Here:
+$7,994
State:
+$14,342
(% of AGI for various income ranges: 113.9% for AGIs below $25k, 182.9% for AGIs $25k-50k, 287.3% for AGIs $50k-75k, 623.3% for AGIs $75k-100k)
Taxable individual retirement arrangement distribution: $11,338 (reported on 7.5% of returns)
56312:
$11,338
Minnesota:
$20,675
(% of AGI for various income ranges: 210.5% for AGIs $25k-50k, 775.0% for AGIs $75k-100k)
Total itemized deductions: $30,567 (reported on 2.8% of returns)
Here:
$30,567
State:
$33,311
(% of AGI for various income ranges: 833.6% for AGIs $50k-75k)
Charity contributions: $4,450 (reported on 1.9% of returns)
Here:
$4,450
State:
$11,879
(% of AGI for various income ranges: 42.4% for AGIs $25k-50k)
Taxes paid: $8,000 (reported on 2.8% of returns)
56312:
$8,000
State:
$8,252
(% of AGI for various income ranges: 218.2% for AGIs $50k-75k)
Earned income credit: $1,925 (reported on 11.2% of returns)
Here:
$1,925
State:
$2,055
(% of AGI for various income ranges: 61.7% for AGIs below $25k, 57.1% for AGIs $25k-50k)
Percentage of individuals using paid preparers for their 2020 taxes: 96.3%
Here:
96%
State:
94%
(% for various income ranges: 93.5% for AGIs below $25k, 100.0% for AGIs $25k-50k, 94.1% for AGIs $50k-75k, 91.7% for AGIs $75k-100k, 100.0% for AGIs $100k-200k, 100.0% for AGIs over 200k)
Averages for the 2012 tax year for zip code 56312, filed in 2013:
Average Adjusted Gross Income (AGI) in 2012: $49,106 (Individual Income Tax Returns)
Here:
$49,106
State:
$67,192
Salary/wage: $37,592 (reported on 84.0% of returns)
Here:
$37,592
State:
$55,182
(% of AGI for various income ranges: 74.3% for AGIs below $25k, 77.8% for AGIs $25k-50k, 78.8% for AGIs $50k-75k, 72.1% for AGIs $75k-100k, 74.5% for AGIs $100k-200k)
Taxable interest for individuals: $1,438 (reported on 44.3% of returns)
This zip code:
$1,438
Minnesota:
$1,664
(% of AGI for various income ranges: 3.0% for AGIs below $25k, 1.3% for AGIs $25k-50k, 0.6% for AGIs $50k-75k, 1.2% for AGIs $75k-100k, 0.7% for AGIs $100k-200k, 2.0% for AGIs over 200k)
Ordinary dividends: $1,406 (reported on 17.0% of returns)
Here:
$1,406
State:
$5,665
(% of AGI for various income ranges: 1.6% for AGIs below $25k, 0.7% for AGIs $25k-50k, 0.5% for AGIs $50k-75k, 0.2% for AGIs $75k-100k, 0.4% for AGIs $100k-200k)
Net capital gain/loss in AGI: +$19,233 (reported on 19.8% of returns)
Here:
+$19,233
State:
+$16,131
(% of AGI for various income ranges: 3.2% for AGIs below $25k, 2.9% for AGIs $25k-50k, 3.1% for AGIs $50k-75k, 4.4% for AGIs $75k-100k, 31.9% for AGIs $100k-200k)
Profit/loss from business: +$8,027 (reported on 14.2% of returns)
Here:
+$8,027
State:
+$12,430
(% of AGI for various income ranges: 7.1% for AGIs below $25k, 6.5% for AGIs $25k-50k, 1.2% for AGIs $50k-75k, 0.8% for AGIs $75k-100k)
Taxable individual retirement arrangement distribution: $5,850 (reported on 7.5% of returns)
56312:
$5,850
Minnesota:
$15,212
(% of AGI for various income ranges: 2.0% for AGIs below $25k, 1.5% for AGIs $25k-50k, 2.6% for AGIs $75k-100k)
Total itemized deductions: $20,139 (23% of AGI, reported on 26.4% of returns)
Here:
$20,139
State:
$24,665
Here:
23.1% of AGI
State:
19.6% of AGI
(% of AGI for various income ranges: 8.3% for AGIs below $25k, 9.9% for AGIs $25k-50k, 9.0% for AGIs $50k-75k, 13.1% for AGIs $75k-100k, 23.2% for AGIs $100k-200k)
Charity contributions: $2,239 (reported on 21.7% of returns)
Here:
$2,239
State:
$3,948
(% of AGI for various income ranges: 0.8% for AGIs below $25k, 1.0% for AGIs $25k-50k, 0.5% for AGIs $50k-75k, 0.9% for AGIs $75k-100k, 2.6% for AGIs $100k-200k)
Taxes paid: $6,936 (reported on 26.4% of returns)
56312:
$6,936
State:
$10,589
(% of AGI for various income ranges: 1.1% for AGIs below $25k, 2.6% for AGIs $25k-50k, 3.0% for AGIs $50k-75k, 4.0% for AGIs $75k-100k, 10.4% for AGIs $100k-200k)
Earned income credit: $2,346 (reported on 12.3% of returns)
Here:
$2,346
State:
$2,037
(% of AGI for various income ranges: 4.6% for AGIs below $25k, 0.8% for AGIs $25k-50k)
Percentage of individuals using paid preparers for their 2012 taxes: 75.5%
Here:
75%
State:
55%
(% for various income ranges: 65.9% for AGIs below $25k, 77.8% for AGIs $25k-50k, 84.2% for AGIs $50k-75k, 80.0% for AGIs $75k-100k, 85.7% for AGIs $100k-200k, 100.0% for AGIs over 200k)
Averages for the 2004 tax year for zip code 56312, filed in 2005:
Average Adjusted Gross Income (AGI) in 2004: $34,838 (Individual Income Tax Returns)
Here:
$34,838
State:
$53,560
Salary/wage: $30,952 (reported on 83.4% of returns)
Here:
$30,952
State:
$46,177
(% of AGI for various income ranges: 134.8% for AGIs below $10k, 67.7% for AGIs $10k-25k, 80.8% for AGIs $25k-50k, 77.8% for AGIs $50k-75k, 78.0% for AGIs $75k-100k, 50.0% for AGIs over 100k)
Taxable interest for individuals: $1,667 (reported on 50.6% of returns)
This zip code:
$1,667
Minnesota:
$1,796
(% of AGI for various income ranges: 6.7% for AGIs below $10k, 6.1% for AGIs $10k-25k, 1.7% for AGIs $25k-50k, 1.6% for AGIs $50k-75k, 0.9% for AGIs $75k-100k, 2.6% for AGIs over 100k)
Taxable dividends: $1,036 (reported on 17.7% of returns)
Here:
$1,036
State:
$3,096
(% of AGI for various income ranges: 1.2% for AGIs below $10k, 1.1% for AGIs $10k-25k, 0.7% for AGIs $25k-50k, 0.2% for AGIs $50k-75k, 0.2% for AGIs $75k-100k, 0.4% for AGIs over 100k)
Net capital gain/loss: +$7,472 (reported on 23.3% of returns)
Here:
+$7,472
State:
+$10,864
(% of AGI for various income ranges: 2.0% for AGIs below $10k, 7.2% for AGIs $10k-25k, 3.2% for AGIs $25k-50k, 3.8% for AGIs $50k-75k, -0.3% for AGIs $75k-100k, 12.3% for AGIs over 100k)
Profit/loss from business: +$6,381 (reported on 15.4% of returns)
Here:
+$6,381
State:
+$10,442
(% of AGI for various income ranges: 1.2% for AGIs below $10k, 5.4% for AGIs $10k-25k, 4.0% for AGIs $25k-50k, 3.7% for AGIs $50k-75k, -0.3% for AGIs $75k-100k)
IRA payment deduction: $3,206 (reported on 5.8% of returns)
56312:
$3,206
Minnesota:
$2,955
Total itemized deductions: $15,183 (23% of AGI, reported on 21.0% of returns)
Here:
$15,183
State:
$20,035
Here:
22.7% of AGI
State:
21.3% of AGI
(% of AGI for various income ranges: 12.1% for AGIs below $10k, 6.8% for AGIs $10k-25k, 6.6% for AGIs $25k-50k, 11.3% for AGIs $50k-75k, 12.5% for AGIs $75k-100k, 10.3% for AGIs over 100k)
Charity contributions deductions: $1,709 (3% of AGI, reported on 18.3% of returns)
Here:
$1,709
State:
$3,333
Here:
2.7% of AGI
State:
3.4% of AGI
(% of AGI for various income ranges: 0.6% for AGIs below $10k, 0.7% for AGIs $10k-25k, 0.5% for AGIs $25k-50k, 1.0% for AGIs $50k-75k, 1.2% for AGIs $75k-100k, 1.4% for AGIs over 100k)
Total tax: $4,300 (reported on 77.7% of returns)
56312:
$4,300
State:
$8,485
(% of AGI for various income ranges: 5.6% for AGIs below $10k, 4.9% for AGIs $10k-25k, 7.1% for AGIs $25k-50k, 7.5% for AGIs $50k-75k, 9.5% for AGIs $75k-100k, 20.9% for AGIs over 100k)
Earned income credit: $1,558 (reported on 12.7% of returns)
Here:
$1,558
State:
$1,523
Percentage of individuals using paid preparers for their 2004 taxes: 75.6%
Here:
76%
State:
59%
(% for various income ranges: 69.2% for AGIs below $10k, 73.0% for AGIs $10k-25k, 77.9% for AGIs $25k-50k, 81.3% for AGIs $50k-75k, 79.6% for AGIs $75k-100k, 93.5% for AGIs over 100k)
Household received Food Stamps/SNAP in the past 12 months: 65 Household did not receive Food Stamps/SNAP in the past 12 months: 814
Women who had a birth in the past 12 months: 25 (20 now married, 5 unmarried) Women who did not have a birth in the past 12 months: 411 (211 now married, 199 unmarried)
Housing units in zip code 56312 with a mortgage: 424 (21 second mortgage, 1 home equity loan, 17 both second mortgage and home equity loan) Median monthly owner costs for units with a mortgage: $1,652 Median monthly owner costs for units without a mortgage: $579
Residents with income below the poverty level in 2022:
This zip code:
7.8%
Whole state:
9.6%
Residents with income below 50% of the poverty level in 2022:
This zip code:
4.0%
Whole state:
5.2%
Median number of rooms in houses and condos:
Here:
7.0
State:
7.1
Median number of rooms in apartments:
Here:
4.7
State:
3.8
Notable locations in this zip code not listed on our city pages
Notable locations in zip code 56312: Belgrade (A), Belgrade Fire Department (B), Elrosa Fire Department (C), Belgrade Police Department (D), Myrtle Maybee Public Library (E). Display/hide their locations on the map
Churches in zip code 56312 include: Crow Lake Church (A), Crow River Church (B), Gausdal Church (C), Saint Peter and Paul Church (D), Grace Lutheran Church (E). Display/hide their locations on the map
Cemeteries: Zion Cemetery (1), Saint Anthony Cemetery (2), Saint Francis de Sales Cemetery (3), Saints Peter and Paul Cemetery (4), Crow Lake Cemetery (5), United Methodist Cemetery (6), Saint Paul's Lutheran Cemetery (7). Display/hide their locations on the map
Lakes, reservoirs, and swamps: Dia Linn Lake (A), Hystad Lake (B), George Lake (C), Fish Lake (D), Crow Lake (E), Lake Monongalia (F), Prairie Lake (G), Fish Lake (H). Display/hide their locations on the map
In group quarters: 41 (-1 institutionalized population)
Size of family households: 313 2-persons, 78 3-persons, 59 4-persons, 70 5-persons, 31 6-persons, 10 7-or-more-persons
Size of nonfamily households: 235 1-person, 72 2-persons, 10 5-persons
434 married couples with children.
92 single-parent households (16 men, 76 women).
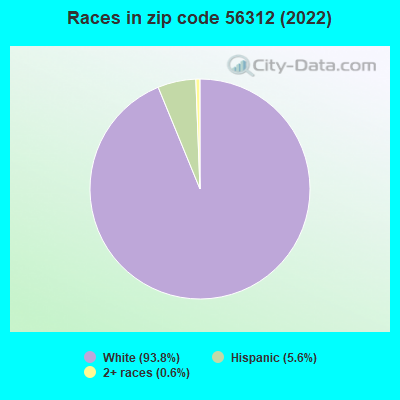
95.2% of residents of 56312 zip code speak English at home.
3.5% of residents speak Spanish at home (44% very well, 42% well, 14% not well).
0.8% of residents speak other Indo-European language at home (75% very well, 12% well, 12% not well).
Foreign born population: 17 (0.8%) (71.7% of them are naturalized citizens)
This zip code:
0.8%
Whole state:
8.7%
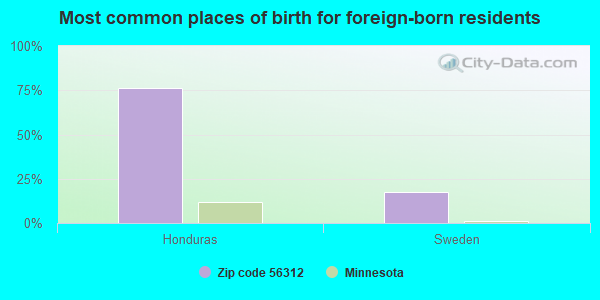
76%Honduras
18%Sweden
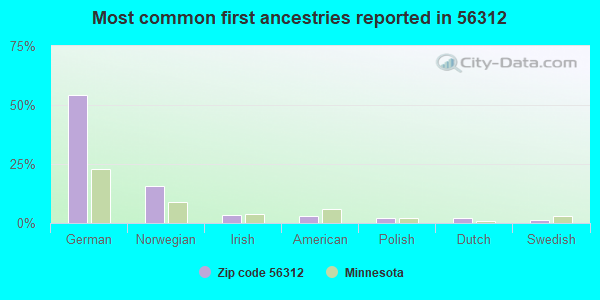
54%German
16%Norwegian
4%Irish
3%American
2%Polish
2%Dutch
1%Swedish
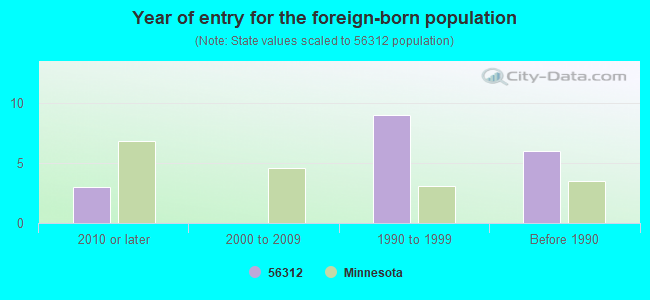
Year of entry for the foreign-born population
32010 or later
02000 to 2009
91990 to 1999
6Before 1990
Major facilities with environmental interests located in this zip code:
BELGRADE WWTP (21757 FARMCREST RD in BELGRADE, MN)
STATE MASTER (Minnesota Pollution Control Agency permits and compilance tracking) - PCS-MN0051381, NPDES NON-MAJOR CRITERIA AND HAZARDOUS AIR POLLUTANT INVENTORY (Inventory of air pollution sources) National Pollutant Discharge Elimination System NON-MAJOR (Tracking pollutant discharge elimination systems) - permit COMMUNITY WATER SYSTEM (SDWIS) - SDWIS-MN1730004 3, WATER TREATMENT PLANT Business SIC classification: SEWERAGE SYSTEMS Business NAICS classification: SEWAGE TREATMENT FACILITIES. Organizations: BELGRADE CITY OF (CONTACT/OWNER)
B B E BUS GARAGE (316 LANGDON AVE in BELGRADE, MN)
STATE MASTER (Minnesota Pollution Control Agency permits and compilance tracking) - RCRAINFO-MN0000267161, CESQG, RCRIS-MN0000267161, Conditionally Exempt Small Quantity Generators, less than 100 kg/month of hazardous waste (Resource Conservation and Recovery Act (tracking hazardous waste)) - notification Business SIC and NAICS classification: ELEMENTARY AND SECONDARY SCHOOLS Organizations: B B E SCHOOL DIST 736 737 (CONTACT/OWNER)
, BELGRADE-BROOTEN-ELROSA SECONDARY SCHOOL (CONTACT/OWNER)
Alternative names: BBE BUS GARAGE
BAYER BUILT WOODWORKS INC (24614 US HIGHWAY 71 in BELGRADE, MN)
STATE MASTER (Minnesota Pollution Control Agency permits and compilance tracking) - AFS-2714500172, AIR SYNTHETIC MINOR, RCRIS-MNS000101865, SQG Small Quantity Generators, between 100 kg and 1000 kg of hazardous waste/month (Resource Conservation and Recovery Act (tracking hazardous waste)) Business SIC classification: LUMBER, PLYWOOD, MILLWORK, AND WOOD PANELS
BELGRADE BROOTEN ELROSA JR SR HI SCHOOL (710 WASHBURN AVE in BELGRADE, MN)
STATE MASTER (Minnesota Pollution Control Agency permits and compilance tracking) - RCRAINFO-MND985741628, CESQG, RCRIS-MND985741628, Conditionally Exempt Small Quantity Generators, less than 100 kg/month of hazardous waste (Resource Conservation and Recovery Act (tracking hazardous waste)) - notification Business SIC and NAICS classification: ELEMENTARY AND SECONDARY SCHOOLS Organizations: BBE SCHOOL DIST 736 737 (CONTACT/OWNER)
, BELGRADE-BROOTEN-ELROSA SECONDARY SCHOOL (CONTACT/OWNER)
Alternative names: BBE SCHOOL DIST 736 737, BELGRADE-BROOTEN-ELROSA SEC.
BELGRADE NURSING HOME (61 SCHOOL ST in BELGRADE, MN)
STATE MASTER (Minnesota Pollution Control Agency permits and compilance tracking) - RCRAINFO-MND985746767, HAZARDOUS WASTE PROGRAM, RCRIS-MND985746767, Conditionally Exempt Small Quantity Generators, less than 100 kg/month of hazardous waste (Resource Conservation and Recovery Act (tracking hazardous waste)) - notification Business SIC classification: INTERMEDIATE CARE FACILITIES Business NAICS classification: CONTINUING CARE RETIREMENT COMMUNITIES. Organizations: BELGRADE CITY OF (CONTACT/OWNER)
BELLING LYLE DDS (500 BORGERDING AVENUE in BELGRADE, MN)
STATE MASTER (Minnesota Pollution Control Agency permits and compilance tracking) - RCRAINFO-MN0000000679, CESQG, RCRIS-MN0000000679, Conditionally Exempt Small Quantity Generators, less than 100 kg/month of hazardous waste (Resource Conservation and Recovery Act (tracking hazardous waste)) - notification Business SIC classification: OFFICES AND CLINICS OF DENTISTS Business NAICS classification: OFFICES OF DENTISTS.
NAPA AUTO PARTS (JCT HWY 71 & 55 in BELGRADE, MN)
STATE MASTER (Minnesota Pollution Control Agency permits and compilance tracking) - RCRAINFO-MNR000004424, CESQG, RCRIS-MNR000004424, Conditionally Exempt Small Quantity Generators, less than 100 kg/month of hazardous waste (Resource Conservation and Recovery Act (tracking hazardous waste)) - notification Business SIC classification: AUTO AND HOME SUPPLY STORES Organizations: BRAEGELMAN DENNIS (CONTACT/OWNER)
BELGRADE STEEL TANK CO INC (405 LOWERY AVE in BELGRADE, MN)
STATE MASTER (Minnesota Pollution Control Agency permits and compilance tracking) - AIRS-2714500107, AIR PROGRAM, PCS-006153027, GENERAL PERMIT STORM WATER IND, AFS-2714500107, AIR SYNTHETIC MINOR, PCS-006153027, NPDES STORMWATER PERMIT CRITERIA AND HAZARDOUS AIR POLLUTANT INVENTORY (Inventory of air pollution sources) Business SIC classification: FABRICATED PLATE WORK (BOILER SHOPS) Business NAICS classification: METAL TANK (HEAVY GAUGE) MANUFACTURING.
BELGRADE RUBBER CO (HWY 71 N in BELGRADE, MN)
Small Quantity Generators, between 100 kg and 1000 kg of hazardous waste/month (Resource Conservation and Recovery Act (tracking hazardous waste)) - notification Small Quantity Generators, between 100 kg and 1000 kg of hazardous waste/month (Resource Conservation and Recovery Act (tracking hazardous waste)) - notification Organizations: BELGRADE RUBBER INC (CONTACT/OWNER)
BELGRADE (CITY HALL in BELGRADE, MN)
National Pollutant Discharge Elimination System NON-MAJOR (Tracking pollutant discharge elimination systems) - permit Business SIC classification: SEWERAGE SYSTEMS
BELGRADE WTP (330 WELLS STREET in BELGRADE, MN)
National Pollutant Discharge Elimination System NON-MAJOR (Tracking pollutant discharge elimination systems) - permit Business SIC classification: SEWERAGE SYSTEMS
NORMS REPAIR (RTE 1 in BELGRADE, MN)
Small Quantity Generators, between 100 kg and 1000 kg of hazardous waste/month (Resource Conservation and Recovery Act (tracking hazardous waste)) - notification Organizations: ROERING NORMAN (CONTACT/OWNER)
BELGRADE COOP ASSN (PO BOX 369 in BELGRADE, MN)
COMPLIANCE ACTIVITY (Tracking inspections of insecticide, fungicide, and rodenticide, and toxic substances)
Housing units lacking complete plumbing facilities: 0.8% Housing units lacking complete kitchen facilities: 1.8%
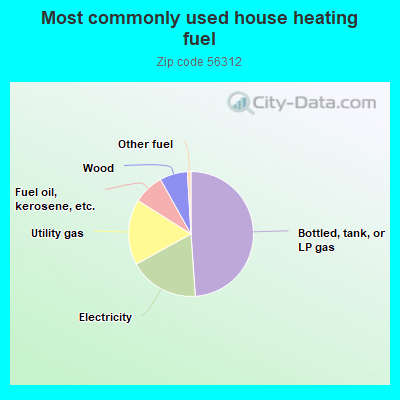
48.9%Bottled, tank, or LP gas
18.1%Electricity
17.0%Utility gas
7.9%Fuel oil, kerosene, etc.
7.2%Wood
0.9%Other fuel
Population in 1990: 1,661. Population change in the 1990s: +899 (+54.1%).
Place of birth for U.S.-born residents:
This state: 2,051
Northeast: 7
Midwest: 93
South: 35
West: 33
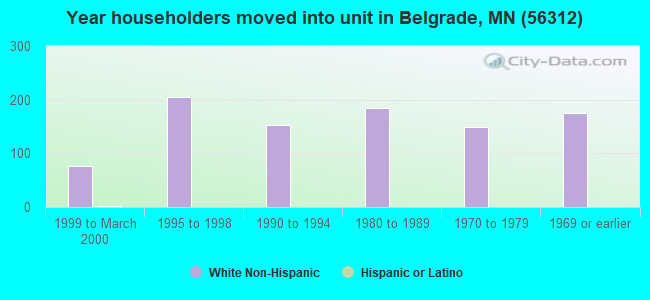
73% of the 56312 zip code residents lived in the same house 5 years ago. Out of people who lived in different houses, 54% lived in this county. Out of people who lived in different counties, 50% lived in Minnesota.
90% of the 56312 zip code residents lived in the same house 1 year ago. Out of people who lived in different houses, 60% moved from this county. Out of people who lived in different houses, 35% moved from different county within same state.
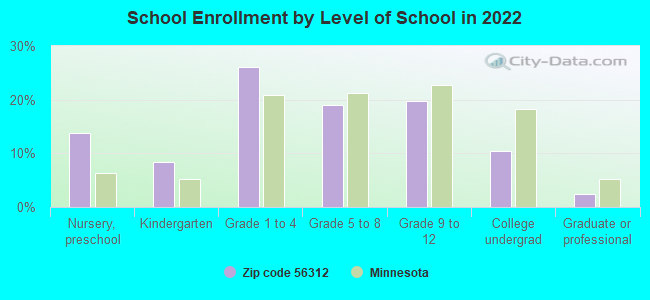
Private vs. public school enrollment:
Students in private schools in grades 1 to 8 (elementary and middle school): 15
Here:
6.9%
Minnesota:
12.9%
Students in private schools in grades 9 to 12 (high school): 1
Here:
1.1%
Minnesota:
8.6%
Students in private undergraduate colleges: 7
Here:
13.8%
Minnesota:
26.2%
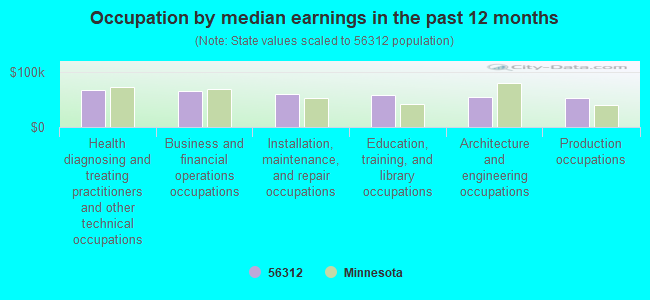
Occupation by median earnings in the past 12 months ($)
66,964Health diagnosing and treating practitioners and other technical occupations
65,225Business and financial operations occupations
61,126Installation, maintenance, and repair occupations
58,217Education, training, and library occupations
55,258Architecture and engineering occupations
53,067Production occupations
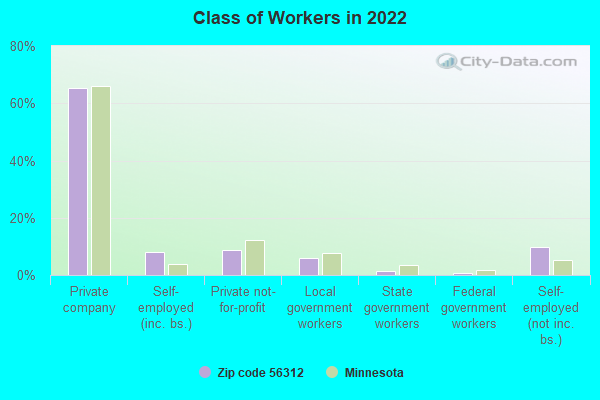
Top industries in this zip code by the number of employees in 2005:
Health Care and Social Assistance: Nursing Care Facilities (50-99 employees: 1 establishment)
Finance and Insurance: Commercial Banking (20-49: 1)
Accommodation and Food Services: Limited-Service Restaurants (10-19: 1, 1-4: 2)
Other Services (except Public Administration): Religious Organizations (5-9: 2, 1-4: 2)
Other Services (except Public Administration): Civic and Social Organizations (10-19: 1)
People in group quarters in 2010:
41 people in nursing facilities/skilled-nursing facilities
People in group quarters in 2000:
59 people in nursing homes
4 people in homes for the mentally retarded
Fatal accident statistics in 2014:
Fatal accident count: 1
Vehicles involved in fatal accidents: 2
Fatal accidents caused by drunken drivers: 1
Fatalities: 1
Persons involved in fatal accidents: 6
Pedestrians involved in fatal accidents: 0
Fatal accident statistics in 2012:
Fatal accident count: 1
Vehicles involved in fatal accidents: 1
Fatal accidents caused by drunken drivers: 0
Fatalities: 1
Persons involved in fatal accidents: 1
Pedestrians involved in fatal accidents: 1
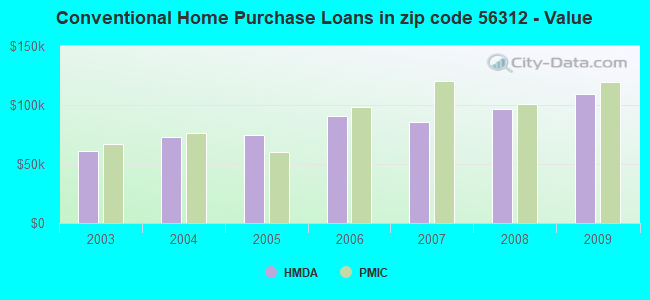
Home Mortgage Disclosure Act Aggregated Statistics For Year 2009 (Based on 2 partial tracts)
A) FHA, FSA/RHS & VA Home Purchase Loans
B) Conventional Home Purchase Loans
C) Refinancings
D) Home Improvement Loans
F) Non-occupant Loans on < 5 Family Dwellings (A B C & D)
G) Loans On Manufactured Home Dwelling (A B C & D)
Number
Average Value
Number
Average Value
Number
Average Value
Number
Average Value
Number
Average Value
Number
Average Value
LOANS ORIGINATED
10
$105,886
24
$109,475
79
$122,710
20
$31,218
9
$51,818
9
$38,651
APPLICATIONS APPROVED, NOT ACCEPTED
0
$0
1
$36,950
9
$157,010
3
$10,193
1
$194,950
1
$36,950
APPLICATIONS DENIED
3
$95,990
6
$43,535
23
$135,564
6
$35,465
3
$126,570
1
$188,580
APPLICATIONS WITHDRAWN
1
$61,160
5
$130,224
18
$142,144
0
$0
0
$0
1
$160,550
FILES CLOSED FOR INCOMPLETENESS
1
$104,480
0
$0
0
$0
0
$0
0
$0
0
$0
Aggregated Statistics For Year 2008 (Based on 2 partial tracts)
A) FHA, FSA/RHS & VA Home Purchase Loans
B) Conventional Home Purchase Loans
C) Refinancings
D) Home Improvement Loans
F) Non-occupant Loans on < 5 Family Dwellings (A B C & D)
G) Loans On Manufactured Home Dwelling (A B C & D)
Number
Average Value
Number
Average Value
Number
Average Value
Number
Average Value
Number
Average Value
Number
Average Value
LOANS ORIGINATED
8
$74,541
38
$96,638
54
$86,976
24
$58,932
11
$91,279
4
$60,842
APPLICATIONS APPROVED, NOT ACCEPTED
0
$0
3
$62,860
8
$162,460
1
$16,560
0
$0
0
$0
APPLICATIONS DENIED
0
$0
11
$87,109
19
$133,657
6
$24,847
0
$0
1
$29,310
APPLICATIONS WITHDRAWN
1
$263,760
1
$101,940
4
$163,415
5
$89,704
1
$101,940
0
$0
FILES CLOSED FOR INCOMPLETENESS
0
$0
0
$0
3
$85,797
0
$0
0
$0
0
$0
Aggregated Statistics For Year 2007 (Based on 2 partial tracts)
A) FHA, FSA/RHS & VA Home Purchase Loans
B) Conventional Home Purchase Loans
C) Refinancings
D) Home Improvement Loans
F) Non-occupant Loans on < 5 Family Dwellings (A B C & D)
G) Loans On Manufactured Home Dwelling (A B C & D)
Number
Average Value
Number
Average Value
Number
Average Value
Number
Average Value
Number
Average Value
Number
Average Value
LOANS ORIGINATED
8
$94,609
29
$85,415
70
$92,143
18
$47,712
8
$117,545
10
$45,744
APPLICATIONS APPROVED, NOT ACCEPTED
0
$0
1
$71,360
8
$112,130
1
$108,310
1
$337,660
0
$0
APPLICATIONS DENIED
0
$0
15
$103,380
47
$155,696
6
$66,470
3
$158,427
3
$74,330
APPLICATIONS WITHDRAWN
3
$70,507
3
$136,340
8
$139,684
0
$0
0
$0
0
$0
FILES CLOSED FOR INCOMPLETENESS
0
$0
0
$0
6
$135,278
1
$101,940
0
$0
0
$0
Aggregated Statistics For Year 2006 (Based on 2 partial tracts)
A) FHA, FSA/RHS & VA Home Purchase Loans
B) Conventional Home Purchase Loans
C) Refinancings
D) Home Improvement Loans
F) Non-occupant Loans on < 5 Family Dwellings (A B C & D)
G) Loans On Manufactured Home Dwelling (A B C & D)
Number
Average Value
Number
Average Value
Number
Average Value
Number
Average Value
Number
Average Value
Number
Average Value
LOANS ORIGINATED
9
$71,921
52
$90,983
71
$89,517
20
$50,267
8
$84,894
10
$31,855
APPLICATIONS APPROVED, NOT ACCEPTED
0
$0
13
$77,236
8
$78,841
0
$0
1
$161,820
0
$0
APPLICATIONS DENIED
3
$52,243
14
$61,253
56
$100,662
13
$39,696
1
$149,080
6
$94,928
APPLICATIONS WITHDRAWN
0
$0
4
$79,638
29
$89,458
3
$48,420
1
$127,420
0
$0
FILES CLOSED FOR INCOMPLETENESS
1
$95,560
4
$92,060
20
$114,996
0
$0
1
$67,530
0
$0
Aggregated Statistics For Year 2005 (Based on 2 partial tracts)
A) FHA, FSA/RHS & VA Home Purchase Loans
B) Conventional Home Purchase Loans
C) Refinancings
D) Home Improvement Loans
F) Non-occupant Loans on < 5 Family Dwellings (A B C & D)
G) Loans On Manufactured Home Dwelling (A B C & D)
Number
Average Value
Number
Average Value
Number
Average Value
Number
Average Value
Number
Average Value
Number
Average Value
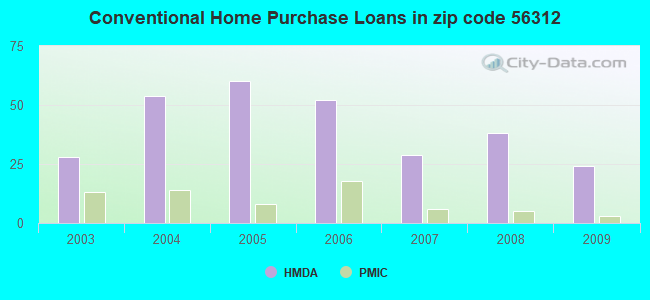
LOANS ORIGINATED
10
$89,704
60
$74,944
75
$101,936
20
$36,378
14
$64,711
8
$24,210
APPLICATIONS APPROVED, NOT ACCEPTED
0
$0
4
$90,150
9
$108,166
3
$31,430
3
$103,633
0
$0
APPLICATIONS DENIED
0
$0
15
$73,734
55
$111,041
6
$33,342
5
$63,200
4
$82,505
APPLICATIONS WITHDRAWN
0
$0
9
$42,473
25
$128,796
4
$39,182
1
$66,260
0
$0
FILES CLOSED FOR INCOMPLETENESS
1
$71,360
1
$104,480
15
$153,074
0
$0
0
$0
0
$0
Aggregated Statistics For Year 2004 (Based on 2 partial tracts)
A) FHA, FSA/RHS & VA Home Purchase Loans
B) Conventional Home Purchase Loans
C) Refinancings
D) Home Improvement Loans
F) Non-occupant Loans on < 5 Family Dwellings (A B C & D)
G) Loans On Manufactured Home Dwelling (A B C & D)
Number
Average Value
Number
Average Value
Number
Average Value
Number
Average Value
Number
Average Value
Number
Average Value
LOANS ORIGINATED
9
$87,212
54
$72,795
99
$96,402
27
$40,539
1
$29,310
14
$31,855
APPLICATIONS APPROVED, NOT ACCEPTED
0
$0
6
$56,277
14
$94,473
1
$119,770
0
$0
3
$30,157
APPLICATIONS DENIED
1
$119,770
19
$81,146
38
$109,615
5
$31,090
4
$129,968
3
$45,870
APPLICATIONS WITHDRAWN
0
$0
3
$65,410
27
$130,865
4
$57,340
0
$0
0
$0
FILES CLOSED FOR INCOMPLETENESS
1
$115,950
1
$124,870
14
$113,677
0
$0
0
$0
0
$0
Aggregated Statistics For Year 2003 (Based on 2 partial tracts)
A) FHA, FSA/RHS & VA Home Purchase Loans
B) Conventional Home Purchase Loans
C) Refinancings
D) Home Improvement Loans
E) Loans on Dwellings For 5+ Families
F) Non-occupant Loans on < 5 Family Dwellings (A B C & D)
Detailed PMIC statistics for the following Tracts:0109.00
2002 - 2018 National Fire Incident Reporting System (NFIRS) incidents
Based on the data from the years 2002 - 2018 the average number of fire incidents per year is 14. The highest number of fires - 24 took place in 2009, and the least - 7 in 2014. The data has a rising trend.
When looking into fire subcategories, the most incidents belonged to: Outside Fires (40.8%), and Structure Fires (34.6%).
Fire incident types reported to NFIRS in Zip Code 56312


 Nearest zip codes: 56325, 56273, 56335, 56316, 56288, 56352.


 Based on the data from the years 2002 - 2018 the average number of fire incidents per year is 14. The highest number of fires - 24 took place in 2009, and the least - 7 in 2014. The data has a rising trend.
 When looking into fire subcategories, the most incidents belonged to: Outside Fires (40.8%), and Structure Fires (34.6%).