Estimated zip code population in 2022: 2,302 Zip code population in 2010: 2,288 Zip code population in 2000: 2,287
Houses and condos: 999 Renter-occupied apartments: 65
% of renters here:
7%
State:
28%
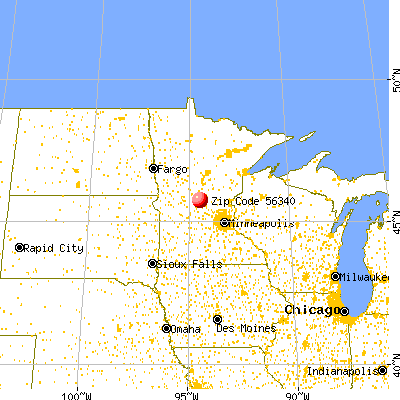
March 2022 cost of living index in zip code 56340: 87.1 (less than average, U.S. average is 100)
Land area: 49.4 sq. mi. Water area: 0.0 sq. mi.
Population density: 47 people per square mile
(very low).
OSM Map
General Map
Google Map
MSN Map
OSM Map
General Map
Google Map
MSN Map
OSM Map
General Map
Google Map
MSN Map
OSM Map
General Map
Google Map
MSN Map
Please wait while loading the map...
Real estate property taxes paid for housing units in 2022:
This zip code:
0.9% ($2,461)
Minnesota:
1.0% ($3,087)
Median real estate property taxes paid for housing units with mortgages in 2022: $2,570 (0.8%) Median real estate property taxes paid for housing units with no mortgage in 2022: $2,081 (0.9%)
Business Search- 14 Million verified businesses
Males: 1,218
(52.9%)
Females: 1,083
(47.1%)
For population 25 years and over in 56340:
High school or higher: 95.4%
Bachelor's degree or higher: 14.8%
Graduate or professional degree: 2.5%
Unemployed: 1.2%
Mean travel time to work (commute): 29.5 minutes
For population 15 years and over in 56340:
Never married: 23.2%
Now married: 64.9%
Separated: 0.3%
Widowed: 4.9%
Divorced: 6.7%
Zip code 56340 compared to state average:
Unemployed percentage below state average.
Black race population percentage significantly below state average.
Hispanic race population percentage significantly below state average.
Foreign-born population percentage significantly below state average.
Renting percentage significantly below state average.
Length of stay since moving in significantly above state average.
Percentage of population with a bachelor's degree or higher significantly below state average.
Estimated median house/condo value in 2022: $284,873
56340:
$284,873
Minnesota:
$314,600
Median resident age:
This zip code:
39.5 years
Minnesota median age:
39.0 years
Average household size:
This zip code:
2.5 people
Minnesota:
2.4 people
Averages for the 2020 tax year for zip code 56340, filed in 2021:
Average Adjusted Gross Income (AGI) in 2020: $66,453 (Individual Income Tax Returns)
Here:
$66,453
State:
$82,178
Salary/wage: $59,725 (reported on 85.3% of returns)
Here:
$59,725
State:
$67,438
(% of AGI for various income ranges: 1396.1% for AGIs below $25k, 4332.6% for AGIs $25k-50k, 7223.8% for AGIs $50k-75k, 10427.3% for AGIs $75k-100k, 17006.2% for AGIs $100k-200k)
Taxable interest for individuals: $1,248 (reported on 46.6% of returns)
This zip code:
$1,248
Minnesota:
$1,814
(% of AGI for various income ranges: 51.1% for AGIs below $25k, 63.2% for AGIs $25k-50k, 54.6% for AGIs $50k-75k, 105.5% for AGIs $75k-100k, 153.1% for AGIs $100k-200k)
Ordinary dividends: $1,545 (reported on 17.2% of returns)
Here:
$1,545
State:
$6,928
(% of AGI for various income ranges: 19.4% for AGIs below $25k, 36.8% for AGIs $25k-50k, 17.7% for AGIs $50k-75k, 73.6% for AGIs $75k-100k, 76.9% for AGIs $100k-200k)
Net capital gain/loss in AGI: +$8,187 (reported on 19.8% of returns)
Here:
+$8,187
State:
+$20,591
(% of AGI for various income ranges: 56.7% for AGIs below $25k, 154.7% for AGIs $25k-50k, 156.9% for AGIs $50k-75k, 393.6% for AGIs $75k-100k, 653.8% for AGIs $100k-200k)
Profit/loss from business: +$12,969 (reported on 13.8% of returns)
Here:
+$12,969
State:
+$14,342
(% of AGI for various income ranges: 85.6% for AGIs below $25k, 97.9% for AGIs $25k-50k, 280.0% for AGIs $50k-75k, 431.8% for AGIs $75k-100k, 689.2% for AGIs $100k-200k)
Taxable individual retirement arrangement distribution: $13,456 (reported on 7.8% of returns)
56340:
$13,456
Minnesota:
$20,675
(% of AGI for various income ranges: 82.8% for AGIs below $25k, 105.3% for AGIs $25k-50k, 330.0% for AGIs $50k-75k, 333.1% for AGIs $100k-200k)
Total itemized deductions: $23,880 (reported on 4.3% of returns)
Here:
$23,880
State:
$33,311
(% of AGI for various income ranges: 311.1% for AGIs $25k-50k, 463.8% for AGIs $100k-200k)
Charity contributions: $3,867 (reported on 2.6% of returns)
Here:
$3,867
State:
$11,879
(% of AGI for various income ranges: 105.5% for AGIs $75k-100k)
Taxes paid: $6,860 (reported on 4.3% of returns)
56340:
$6,860
State:
$8,252
(% of AGI for various income ranges: 73.2% for AGIs $25k-50k, 156.9% for AGIs $100k-200k)
Earned income credit: $2,082 (reported on 9.5% of returns)
Here:
$2,082
State:
$2,055
(% of AGI for various income ranges: 75.6% for AGIs below $25k, 48.9% for AGIs $25k-50k)
Percentage of individuals using paid preparers for their 2020 taxes: 95.7%
Here:
96%
State:
94%
(% for various income ranges: 93.3% for AGIs below $25k, 92.6% for AGIs $25k-50k, 95.0% for AGIs $50k-75k, 100.0% for AGIs $75k-100k, 100.0% for AGIs $100k-200k, 100.0% for AGIs over 200k)
Averages for the 2012 tax year for zip code 56340, filed in 2013:
Average Adjusted Gross Income (AGI) in 2012: $49,439 (Individual Income Tax Returns)
Here:
$49,439
State:
$67,192
Salary/wage: $46,786 (reported on 86.5% of returns)
Here:
$46,786
State:
$55,182
(% of AGI for various income ranges: 76.8% for AGIs below $25k, 83.4% for AGIs $25k-50k, 82.8% for AGIs $50k-75k, 88.6% for AGIs $75k-100k, 76.0% for AGIs $100k-200k)
Taxable interest for individuals: $790 (reported on 47.1% of returns)
This zip code:
$790
Minnesota:
$1,664
(% of AGI for various income ranges: 2.3% for AGIs below $25k, 1.3% for AGIs $25k-50k, 0.5% for AGIs $50k-75k, 0.2% for AGIs $75k-100k, 0.6% for AGIs $100k-200k)
Ordinary dividends: $1,421 (reported on 13.5% of returns)
Here:
$1,421
State:
$5,665
(% of AGI for various income ranges: 0.8% for AGIs below $25k, 0.4% for AGIs $25k-50k, 0.6% for AGIs $50k-75k, 0.4% for AGIs $100k-200k)
Net capital gain/loss in AGI: +$4,013 (reported on 14.4% of returns)
Here:
+$4,013
State:
+$16,131
(% of AGI for various income ranges: 1.5% for AGIs below $25k, 1.7% for AGIs $25k-50k, 1.5% for AGIs $50k-75k, 1.2% for AGIs $100k-200k)
Profit/loss from business: +$6,164 (reported on 13.5% of returns)
Here:
+$6,164
State:
+$12,430
(% of AGI for various income ranges: 6.9% for AGIs below $25k, 2.4% for AGIs $25k-50k, 1.8% for AGIs $50k-75k, 0.9% for AGIs $75k-100k)
Taxable individual retirement arrangement distribution: $6,755 (reported on 10.6% of returns)
56340:
$6,755
Minnesota:
$15,212
(% of AGI for various income ranges: 3.3% for AGIs below $25k, 2.1% for AGIs $25k-50k, 1.6% for AGIs $50k-75k, 1.7% for AGIs $75k-100k)
Total itemized deductions: $17,789 (23% of AGI, reported on 34.6% of returns)
Here:
$17,789
State:
$24,665
Here:
22.6% of AGI
State:
19.6% of AGI
(% of AGI for various income ranges: 7.3% for AGIs below $25k, 10.1% for AGIs $25k-50k, 11.9% for AGIs $50k-75k, 14.9% for AGIs $75k-100k, 14.4% for AGIs $100k-200k)
Charity contributions: $2,000 (reported on 26.9% of returns)
Here:
$2,000
State:
$3,948
(% of AGI for various income ranges: 1.3% for AGIs $25k-50k, 0.9% for AGIs $50k-75k, 1.1% for AGIs $75k-100k, 1.5% for AGIs $100k-200k)
Taxes paid: $6,336 (reported on 34.6% of returns)
56340:
$6,336
State:
$10,589
(% of AGI for various income ranges: 1.1% for AGIs below $25k, 2.7% for AGIs $25k-50k, 3.7% for AGIs $50k-75k, 5.1% for AGIs $75k-100k, 7.0% for AGIs $100k-200k)
Earned income credit: $1,864 (reported on 13.5% of returns)
Here:
$1,864
State:
$2,037
(% of AGI for various income ranges: 4.3% for AGIs below $25k, 0.9% for AGIs $25k-50k)
Percentage of individuals using paid preparers for their 2012 taxes: 73.1%
Here:
73%
State:
55%
(% for various income ranges: 67.6% for AGIs below $25k, 75.0% for AGIs $25k-50k, 76.2% for AGIs $50k-75k, 66.7% for AGIs $75k-100k, 88.9% for AGIs $100k-200k)
Averages for the 2004 tax year for zip code 56340, filed in 2005:
Average Adjusted Gross Income (AGI) in 2004: $38,443 (Individual Income Tax Returns)
Here:
$38,443
State:
$53,560
Salary/wage: $35,160 (reported on 86.0% of returns)
Here:
$35,160
State:
$46,177
(% of AGI for various income ranges: 117.5% for AGIs below $10k, 74.6% for AGIs $10k-25k, 83.5% for AGIs $25k-50k, 88.9% for AGIs $50k-75k, 84.1% for AGIs $75k-100k, 41.9% for AGIs over 100k)
Taxable interest for individuals: $1,323 (reported on 57.1% of returns)
This zip code:
$1,323
Minnesota:
$1,796
(% of AGI for various income ranges: 9.9% for AGIs below $10k, 2.9% for AGIs $10k-25k, 2.4% for AGIs $25k-50k, 1.2% for AGIs $50k-75k, 1.5% for AGIs $75k-100k, 1.5% for AGIs over 100k)
Taxable dividends: $1,067 (reported on 17.6% of returns)
Here:
$1,067
State:
$3,096
(% of AGI for various income ranges: 1.6% for AGIs below $10k, 0.5% for AGIs $10k-25k, 0.3% for AGIs $25k-50k, 0.1% for AGIs $50k-75k, 1.0% for AGIs $75k-100k, 1.0% for AGIs over 100k)
Net capital gain/loss: +$10,226 (reported on 21.0% of returns)
Here:
+$10,226
State:
+$10,864
(% of AGI for various income ranges: 29.1% for AGIs below $10k, 3.0% for AGIs $10k-25k, 2.9% for AGIs $25k-50k, 3.7% for AGIs $50k-75k, 3.5% for AGIs $75k-100k, 14.7% for AGIs over 100k)
Profit/loss from business: +$5,448 (reported on 14.4% of returns)
Here:
+$5,448
State:
+$10,442
(% of AGI for various income ranges: 10.4% for AGIs below $10k, 8.0% for AGIs $10k-25k, 2.2% for AGIs $25k-50k, -0.5% for AGIs $50k-75k, 3.6% for AGIs $75k-100k)
IRA payment deduction: $3,094 (reported on 3.2% of returns)
56340:
$3,094
Minnesota:
$2,955
Total itemized deductions: $15,357 (24% of AGI, reported on 31.1% of returns)
Here:
$15,357
State:
$20,035
Here:
23.6% of AGI
State:
21.3% of AGI
(% of AGI for various income ranges: 7.7% for AGIs $10k-25k, 10.2% for AGIs $25k-50k, 14.1% for AGIs $50k-75k, 15.9% for AGIs $75k-100k, 14.0% for AGIs over 100k)
Charity contributions deductions: $2,000 (3% of AGI, reported on 27.0% of returns)
Here:
$2,000
State:
$3,333
Here:
2.9% of AGI
State:
3.4% of AGI
(% of AGI for various income ranges: 1.2% for AGIs $10k-25k, 0.8% for AGIs $25k-50k, 1.0% for AGIs $50k-75k, 1.8% for AGIs $75k-100k, 3.1% for AGIs over 100k)
Total tax: $4,267 (reported on 78.2% of returns)
56340:
$4,267
State:
$8,485
(% of AGI for various income ranges: 3.5% for AGIs below $10k, 5.6% for AGIs $10k-25k, 7.4% for AGIs $25k-50k, 7.0% for AGIs $50k-75k, 8.9% for AGIs $75k-100k, 16.6% for AGIs over 100k)
Earned income credit: $1,450 (reported on 11.9% of returns)
Here:
$1,450
State:
$1,523
Percentage of individuals using paid preparers for their 2004 taxes: 75.9%
Here:
76%
State:
59%
(% for various income ranges: 70.0% for AGIs below $10k, 75.9% for AGIs $10k-25k, 75.0% for AGIs $25k-50k, 80.1% for AGIs $50k-75k, 79.7% for AGIs $75k-100k, 86.8% for AGIs over 100k)
Household received Food Stamps/SNAP in the past 12 months: 26 Household did not receive Food Stamps/SNAP in the past 12 months: 906
Women who had a birth in the past 12 months: 18 (19 now married, 0 unmarried) Women who did not have a birth in the past 12 months: 387 (246 now married, 141 unmarried)
Housing units in zip code 56340 with a mortgage: 587 (81 second mortgage, 14 home equity loan, 57 both second mortgage and home equity loan) Houses without a mortgage: 30
Median monthly owner costs for units with a mortgage: $1,764 Median monthly owner costs for units without a mortgage: $587
Residents with income below the poverty level in 2022:
This zip code:
6.0%
Whole state:
9.6%
Residents with income below 50% of the poverty level in 2022:
This zip code:
3.3%
Whole state:
5.2%
Median number of rooms in houses and condos:
Here:
6.9
State:
7.1
Median number of rooms in apartments:
Here:
5.7
State:
3.8
Notable locations in this zip code not listed on our city pages
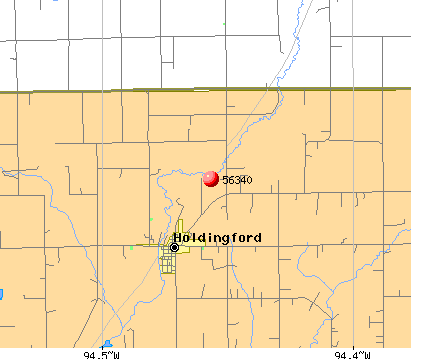
Notable locations in zip code 56340: Warga Dairy Farm (A), Holdingford City Hall (B), Holdingford Fire Department and Rescue Squad (C), Holdingford Police Department (D). Display/hide their locations on the map
Cemeteries: Saint Hegwigs Cemetery (1), Saint Mary Cemetery (2), Saint Marys Cemetery (3), Highland Cemetery (4), Upsala Cemetery (5), Mount Carmel Cemetery (6). Display/hide their locations on the map
477 married couples with children.
86 single-parent households (58 men, 28 women).
98.0% of residents of 56340 zip code speak English at home.
0.1% of residents speak Spanish at home (100% well).
1.2% of residents speak other Indo-European language at home (96% very well, 4% not well).
Foreign born population: 0 (0.0%)
:
0.0%
Whole state:
8.7%
52%German
25%Polish
4%American
3%European
2%French
2%Norwegian
2%Dutch
Facilities with environmental interests located in this zip code:
HOLDINGFORD WWTP (MAIN ST in HOLDINGFORD, MN)
STATE MASTER (Minnesota Pollution Control Agency permits and compilance tracking) - PCS-MN0023710, NPDES NON-MAJOR CRITERIA AND HAZARDOUS AIR POLLUTANT INVENTORY (Inventory of air pollution sources) National Pollutant Discharge Elimination System NON-MAJOR (Tracking pollutant discharge elimination systems) - permit National Pollutant Discharge Elimination System NON-MAJOR (Tracking pollutant discharge elimination systems) - permit COMMUNITY WATER SYSTEM (SDWIS) - SDWIS-MN1730014 3, WATER TREATMENT PLANT, SDWIS-MN1730014 4, Business SIC classification: SEWERAGE SYSTEMS Organizations: HOLDINGFORD CITY OF (CONTACT/OWNER)
HOLDINGFORD EL. ( in HOLDINGFORD, MN)
(National Center for Education Statistics) - STATE ID-010738001
HOLDINGFORD SEC. ( in HOLDINGFORD, MN)
(National Center for Education Statistics) - STATE ID-010738002
CENTRAL MN ALC HOLDINGFORD ( in HOLDINGFORD, MN)
(National Center for Education Statistics) - STATE ID-506074638 Organizations: CENTRAL MINNESOTA JOINT POWERS DIST (SCHOOL DISTRICT)
CENTRAL MN T.S. HOLDINGFORD ( in HOLDINGFORD, MN)
(National Center for Education Statistics) - STATE ID-506074838 Organizations: CENTRAL MINNESOTA JOINT POWERS DIST (SCHOOL DISTRICT)
ALBANY ROLLER MILLS (130 PLYMOUTH ST in HOLDINGFORD, MN)
AIR MINOR (AIRS/AFS) Business SIC classification: PREPARED FEEDS AND FEED INGREDIENTS FOR ANIMALS AND FOWLS, EXCEPT DOGS AND CATS
HOLDINGFORD ELEMENTARY SCHOOL (250 WASHINGTON ST in HOLDINGFORD, MN)
Conditionally Exempt Small Quantity Generators, less than 100 kg/month of hazardous waste (Resource Conservation and Recovery Act (tracking hazardous waste)) - notification TRANSPORTER (Resource Conservation and Recovery Act (tracking hazardous waste)) - notification Organizations: HOLDINGFORD PUBLIC SCHOOL 738 (CONTACT/OWNER)
GREAT PLAINS SUPPLY (41354 CNTY RD 9 in HOLDINGFORD, MN)
Conditionally Exempt Small Quantity Generators, less than 100 kg/month of hazardous waste (Resource Conservation and Recovery Act (tracking hazardous waste)) - notification Organizations: GREAT PLAINS SUPPLY INC (CONTACT/OWNER)
Housing units lacking complete plumbing facilities: 1.0% Housing units lacking complete kitchen facilities: 1.2%
33.7%Bottled, tank, or LP gas
29.4%Utility gas
15.4%Electricity
10.5%Fuel oil, kerosene, etc.
9.6%Wood
1.5%Other fuel
Population in 1990: 1,721. Population change in the 1990s: +566 (+32.9%).
Place of birth for U.S.-born residents:
This state: 2,175
Midwest: 66
South: 24
West: 28
71% of the 56340 zip code residents lived in the same house 5 years ago. Out of people who lived in different houses, 60% lived in this county. Out of people who lived in different counties, 50% lived in Minnesota.
95% of the 56340 zip code residents lived in the same house 1 year ago. Out of people who lived in different houses, 75% moved from this county. Out of people who lived in different houses, 22% moved from different county within same state.
Private vs. public school enrollment:
Students in private schools in grades 1 to 8 (elementary and middle school): 7
Here:
2.7%
Minnesota:
12.9%
Students in private schools in grades 9 to 12 (high school):
Here:
0.0%
Minnesota:
8.6%
Students in private undergraduate colleges: 16
Here:
21.4%
Minnesota:
26.2%
Occupation by median earnings in the past 12 months ($)
87,618Health diagnosing and treating practitioners and other technical occupations
73,723Construction and extraction occupations
62,675Transportation occupations
55,794Health technologists and technicians
55,177Sales and related occupations
54,425Installation, maintenance, and repair occupations
Top industries in this zip code by the number of employees in 2005:
Other Services (except Public Administration): Labor Unions and Similar Labor Organizations (20-49 employees: 1 establishment)
Health Care and Social Assistance: Continuing Care Retirement Communities (20-49: 1)
Other Services (except Public Administration): Religious Organizations (10-19: 1, 1-4: 2)
Accommodation and Food Services: Full-Service Restaurants (5-9: 1, 1-4: 2)
Other Services (except Public Administration): Civic and Social Organizations (5-9: 1, 1-4: 2)
Arts, Entertainment, and Recreation: Fitness and Recreational Sports Centers (5-9: 1, 1-4: 1)
Construction: Plumbing, Heating, and Air-Conditioning Contractors (1-4: 4)
People in group quarters in 2000:
27 people in homes for the mentally retarded
8 people in nursing homes
Fatal accident statistics in 2014:
Fatal accident count: 1
Vehicles involved in fatal accidents: 1
Fatal accidents caused by drunken drivers: 0
Fatalities: 1
Persons involved in fatal accidents: 2
Pedestrians involved in fatal accidents: 0
Home Mortgage Disclosure Act Aggregated Statistics For Year 2009 (Based on 4 partial tracts)
A) FHA, FSA/RHS & VA Home Purchase Loans
B) Conventional Home Purchase Loans
C) Refinancings
D) Home Improvement Loans
F) Non-occupant Loans on < 5 Family Dwellings (A B C & D)
G) Loans On Manufactured Home Dwelling (A B C & D)
Number
Average Value
Number
Average Value
Number
Average Value
Number
Average Value
Number
Average Value
Number
Average Value
LOANS ORIGINATED
16
$153,746
17
$158,855
123
$170,092
13
$78,898
5
$56,976
0
$0
APPLICATIONS APPROVED, NOT ACCEPTED
1
$198,090
1
$221,360
4
$122,355
1
$75,050
1
$73,680
0
$0
APPLICATIONS DENIED
2
$119,480
3
$95,187
23
$164,524
3
$36,647
1
$139,960
1
$122,560
APPLICATIONS WITHDRAWN
0
$0
1
$34,520
15
$175,353
1
$196,020
0
$0
1
$34,520
FILES CLOSED FOR INCOMPLETENESS
0
$0
1
$26,510
3
$242,147
0
$0
1
$26,510
0
$0
Aggregated Statistics For Year 2008 (Based on 4 partial tracts)
A) FHA, FSA/RHS & VA Home Purchase Loans
B) Conventional Home Purchase Loans
C) Refinancings
D) Home Improvement Loans
E) Loans on Dwellings For 5+ Families
F) Non-occupant Loans on < 5 Family Dwellings (A B C & D)
G) Loans On Manufactured Home Dwelling (A B C & D)
Number
Average Value
Number
Average Value
Number
Average Value
Number
Average Value
Number
Average Value
Number
Average Value
Number
Average Value
LOANS ORIGINATED
10
$145,691
23
$164,938
68
$147,630
16
$52,148
0
$0
10
$107,816
1
$144,240
APPLICATIONS APPROVED, NOT ACCEPTED
1
$59,170
2
$198,825
5
$113,762
3
$14,023
0
$0
0
$0
0
$0
APPLICATIONS DENIED
1
$190,130
4
$142,082
21
$171,919
3
$66,353
0
$0
1
$49,310
0
$0
APPLICATIONS WITHDRAWN
1
$204,030
4
$168,490
12
$167,347
0
$0
1
$36,980
0
$0
0
$0
FILES CLOSED FOR INCOMPLETENESS
0
$0
0
$0
2
$89,205
0
$0
0
$0
0
$0
0
$0
Aggregated Statistics For Year 2007 (Based on 4 partial tracts)
A) FHA, FSA/RHS & VA Home Purchase Loans
B) Conventional Home Purchase Loans
C) Refinancings
D) Home Improvement Loans
F) Non-occupant Loans on < 5 Family Dwellings (A B C & D)
G) Loans On Manufactured Home Dwelling (A B C & D)
Number
Average Value
Number
Average Value
Number
Average Value
Number
Average Value
Number
Average Value
Number
Average Value
LOANS ORIGINATED
3
$127,723
33
$186,007
72
$137,214
21
$46,221
7
$108,406
2
$90,610
APPLICATIONS APPROVED, NOT ACCEPTED
0
$0
3
$211,737
6
$89,838
1
$32,600
0
$0
0
$0
APPLICATIONS DENIED
0
$0
7
$156,690
24
$136,643
6
$80,430
0
$0
2
$130,060
APPLICATIONS WITHDRAWN
1
$111,880
4
$126,778
17
$152,433
0
$0
2
$170,290
1
$78,280
FILES CLOSED FOR INCOMPLETENESS
0
$0
1
$58,560
2
$168,715
1
$88,150
0
$0
0
$0
Aggregated Statistics For Year 2006 (Based on 4 partial tracts)
A) FHA, FSA/RHS & VA Home Purchase Loans
B) Conventional Home Purchase Loans
C) Refinancings
D) Home Improvement Loans
F) Non-occupant Loans on < 5 Family Dwellings (A B C & D)
G) Loans On Manufactured Home Dwelling (A B C & D)
Number
Average Value
Number
Average Value
Number
Average Value
Number
Average Value
Number
Average Value
Number
Average Value
LOANS ORIGINATED
5
$148,198
58
$141,634
68
$119,409
19
$30,682
16
$120,889
2
$36,745
APPLICATIONS APPROVED, NOT ACCEPTED
0
$0
5
$147,586
8
$179,036
1
$61,430
1
$148,950
0
$0
APPLICATIONS DENIED
0
$0
10
$113,306
24
$143,493
5
$68,772
2
$106,870
1
$184,920
APPLICATIONS WITHDRAWN
0
$0
3
$170,510
19
$139,869
1
$62,810
2
$80,425
1
$154,920
FILES CLOSED FOR INCOMPLETENESS
0
$0
3
$225,207
4
$179,565
0
$0
1
$85,460
0
$0
Aggregated Statistics For Year 2005 (Based on 4 partial tracts)
A) FHA, FSA/RHS & VA Home Purchase Loans
B) Conventional Home Purchase Loans
C) Refinancings
D) Home Improvement Loans
F) Non-occupant Loans on < 5 Family Dwellings (A B C & D)
G) Loans On Manufactured Home Dwelling (A B C & D)
Number
Average Value
Number
Average Value
Number
Average Value
Number
Average Value
Number
Average Value
Number
Average Value
LOANS ORIGINATED
4
$156,802
76
$137,237
82
$138,501
22
$38,130
7
$106,623
4
$80,002
APPLICATIONS APPROVED, NOT ACCEPTED
0
$0
6
$137,918
9
$119,761
1
$32,650
0
$0
1
$73,970
APPLICATIONS DENIED
1
$148,410
8
$131,310
39
$136,767
6
$89,393
1
$144,500
2
$67,060
APPLICATIONS WITHDRAWN
0
$0
9
$137,481
24
$164,494
1
$60,410
2
$96,765
1
$226,220
FILES CLOSED FOR INCOMPLETENESS
0
$0
0
$0
15
$142,651
0
$0
0
$0
0
$0
Aggregated Statistics For Year 2004 (Based on 4 partial tracts)
A) FHA, FSA/RHS & VA Home Purchase Loans
B) Conventional Home Purchase Loans
C) Refinancings
D) Home Improvement Loans
F) Non-occupant Loans on < 5 Family Dwellings (A B C & D)
G) Loans On Manufactured Home Dwelling (A B C & D)
Number
Average Value
Number
Average Value
Number
Average Value
Number
Average Value
Number
Average Value
Number
Average Value
LOANS ORIGINATED
4
$128,375
62
$132,972
101
$120,315
20
$42,237
8
$104,911
5
$66,968
APPLICATIONS APPROVED, NOT ACCEPTED
1
$117,580
3
$157,130
10
$138,030
2
$60,350
0
$0
0
$0
APPLICATIONS DENIED
2
$75,125
11
$106,588
28
$119,836
7
$60,264
2
$98,185
2
$54,160
APPLICATIONS WITHDRAWN
0
$0
4
$170,362
24
$135,603
2
$100,510
1
$159,240
0
$0
FILES CLOSED FOR INCOMPLETENESS
0
$0
0
$0
9
$162,118
1
$71,320
0
$0
0
$0
Aggregated Statistics For Year 2003 (Based on 4 partial tracts)
A) FHA, FSA/RHS & VA Home Purchase Loans
B) Conventional Home Purchase Loans
C) Refinancings
D) Home Improvement Loans
F) Non-occupant Loans on < 5 Family Dwellings (A B C & D)
Detailed PMIC statistics for the following Tracts:0102.00
, 0104.03
2002 - 2018 National Fire Incident Reporting System (NFIRS) incidents
Based on the data from the years 2002 - 2018 the average number of fires per year is 10. The highest number of reported fires - 15 took place in 2008, and the least - 5 in 2015. The data has a dropping trend.
When looking into fire subcategories, the most reports belonged to: Structure Fires (37.0%), and Outside Fires (32.1%).
Fire incident types reported to NFIRS in Zip Code 56340


 Nearest zip codes: 56314, 56310, 56384, 56374, 56375, 56321.


 Based on the data from the years 2002 - 2018 the average number of fires per year is 10. The highest number of reported fires - 15 took place in 2008, and the least - 5 in 2015. The data has a dropping trend.
 When looking into fire subcategories, the most reports belonged to: Structure Fires (37.0%), and Outside Fires (32.1%).