Estimated zip code population in 2022: 771 Zip code population in 2010: 733 Zip code population in 2000: 688
Houses and condos: 352 Renter-occupied apartments: 46
% of renters here:
15%
State:
28%
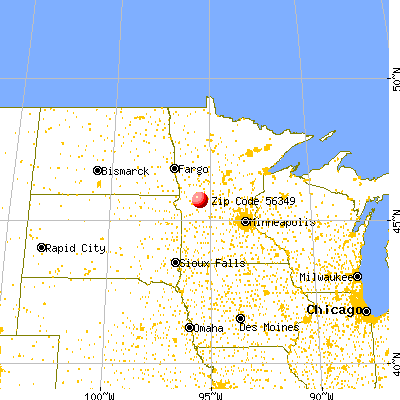
March 2022 cost of living index in zip code 56349: 85.9 (less than average, U.S. average is 100)
Land area: 42.7 sq. mi. Water area: 7.5 sq. mi.
Population density: 18 people per square mile
(very low).
OSM Map
General Map
Google Map
MSN Map
OSM Map
General Map
Google Map
MSN Map
OSM Map
General Map
Google Map
MSN Map
OSM Map
General Map
Google Map
MSN Map
Please wait while loading the map...
Real estate property taxes paid for housing units in 2022:
This zip code:
0.7% ($1,763)
Minnesota:
1.0% ($3,087)
Median real estate property taxes paid for housing units with mortgages in 2022: $1,725 (0.6%) Median real estate property taxes paid for housing units with no mortgage in 2022: $1,805 (0.7%)
Business Search- 14 Million verified businesses
Males: 426
(55.3%)
Females: 345
(44.7%)
For population 25 years and over in 56349:
High school or higher: 97.1%
Bachelor's degree or higher: 20.3%
Graduate or professional degree: 6.7%
Unemployed: 0.6%
Mean travel time to work (commute): 19.6 minutes
For population 15 years and over in 56349:
Never married: 18.6%
Now married: 71.3%
Separated: 0.0%
Widowed: 4.4%
Divorced: 5.6%
Zip code 56349 compared to state average:
Unemployed percentage significantly below state average.
Black race population percentage significantly below state average.
Hispanic race population percentage significantly below state average.
Median age above state average.
Foreign-born population percentage significantly below state average.
Renting percentage below state average.
Length of stay since moving in significantly above state average.
Percentage of population with a bachelor's degree or higher below state average.
Estimated median house/condo value in 2022: $262,167
56349:
$262,167
Minnesota:
$314,600
Median resident age:
This zip code:
46.5 years
Minnesota median age:
39.0 years
Average household size:
This zip code:
2.4 people
Minnesota:
2.4 people
Averages for the 2020 tax year for zip code 56349, filed in 2021:
Average Adjusted Gross Income (AGI) in 2020: $64,007 (Individual Income Tax Returns)
Here:
$64,007
State:
$82,178
Salary/wage: $54,806 (reported on 80.5% of returns)
Here:
$54,806
State:
$67,438
(% of AGI for various income ranges: 1286.7% for AGIs below $25k, 3820.0% for AGIs $25k-50k, 5844.0% for AGIs $50k-75k, 10103.3% for AGIs $75k-100k, 28956.7% for AGIs $100k-200k)
Taxable interest for individuals: $894 (reported on 39.0% of returns)
This zip code:
$894
Minnesota:
$1,814
(% of AGI for various income ranges: 33.3% for AGIs below $25k, 18.6% for AGIs $25k-50k, 24.0% for AGIs $50k-75k, 103.3% for AGIs $75k-100k, 223.3% for AGIs $100k-200k)
Ordinary dividends: $1,500 (reported on 22.0% of returns)
Here:
$1,500
State:
$6,928
(% of AGI for various income ranges: 53.3% for AGIs below $25k, 74.0% for AGIs $50k-75k, 220.0% for AGIs $100k-200k)
Net capital gain/loss in AGI: +$4,062 (reported on 19.5% of returns)
Here:
+$4,062
State:
+$20,591
(% of AGI for various income ranges: 63.3% for AGIs below $25k, 260.0% for AGIs $50k-75k, 523.3% for AGIs $100k-200k)
Profit/loss from business: +$8,350 (reported on 14.6% of returns)
Here:
+$8,350
State:
+$14,342
(% of AGI for various income ranges: 570.0% for AGIs below $25k, 318.0% for AGIs $50k-75k)
Taxable individual retirement arrangement distribution: $24,700 (reported on 12.2% of returns)
56349:
$24,700
Minnesota:
$20,675
(% of AGI for various income ranges: 416.7% for AGIs below $25k, 3283.3% for AGIs $75k-100k)
Earned income credit: $2,450 (reported on 9.8% of returns)
Here:
$2,450
State:
$2,055
(% of AGI for various income ranges: 140.0% for AGIs $25k-50k)
Percentage of individuals using paid preparers for their 2020 taxes: 97.6%
Here:
98%
State:
94%
(% for various income ranges: 100.0% for AGIs below $25k, 100.0% for AGIs $25k-50k, 100.0% for AGIs $50k-75k, 100.0% for AGIs $75k-100k, 87.5% for AGIs $100k-200k)
Averages for the 2012 tax year for zip code 56349, filed in 2013:
Average Adjusted Gross Income (AGI) in 2012: $56,458 (Individual Income Tax Returns)
Here:
$56,458
State:
$67,192
Salary/wage: $40,781 (reported on 84.2% of returns)
Here:
$40,781
State:
$55,182
(% of AGI for various income ranges: 69.1% for AGIs below $25k, 77.5% for AGIs $25k-50k, 76.0% for AGIs $50k-75k, 76.6% for AGIs $75k-100k, 37.5% for AGIs $100k-200k)
Taxable interest for individuals: $1,578 (reported on 47.4% of returns)
This zip code:
$1,578
Minnesota:
$1,664
(% of AGI for various income ranges: 3.6% for AGIs below $25k, 0.4% for AGIs $25k-50k, 0.4% for AGIs $50k-75k, 0.3% for AGIs $75k-100k, 2.2% for AGIs $100k-200k)
Ordinary dividends: $1,244 (reported on 23.7% of returns)
Here:
$1,244
State:
$5,665
(% of AGI for various income ranges: 4.8% for AGIs below $25k, 0.6% for AGIs $50k-75k, 0.1% for AGIs $100k-200k)
Net capital gain/loss in AGI: +$8,538 (reported on 21.1% of returns)
Here:
+$8,538
State:
+$16,131
Profit/loss from business: +$9,633 (reported on 15.8% of returns)
Here:
+$9,633
State:
+$12,430
Taxable individual retirement arrangement distribution: $10,000 (reported on 10.5% of returns)
56349:
$10,000
Minnesota:
$15,212
Total itemized deductions: $21,918 (21% of AGI, reported on 28.9% of returns)
Here:
$21,918
State:
$24,665
Here:
21.0% of AGI
State:
19.6% of AGI
(% of AGI for various income ranges: 15.4% for AGIs $25k-50k, 8.5% for AGIs $50k-75k, 9.3% for AGIs $75k-100k, 14.0% for AGIs $100k-200k)
Charity contributions: $2,711 (reported on 23.7% of returns)
Here:
$2,711
State:
$3,948
(% of AGI for various income ranges: 1.7% for AGIs $25k-50k, 1.6% for AGIs $50k-75k, 1.4% for AGIs $100k-200k)
Taxes paid: $8,773 (reported on 28.9% of returns)
56349:
$8,773
State:
$10,589
(% of AGI for various income ranges: 3.8% for AGIs $25k-50k, 2.7% for AGIs $50k-75k, 3.5% for AGIs $75k-100k, 7.0% for AGIs $100k-200k)
Earned income credit: $1,925 (reported on 10.5% of returns)
Here:
$1,925
State:
$2,037
(% of AGI for various income ranges: 5.0% for AGIs below $25k)
Percentage of individuals using paid preparers for their 2012 taxes: 71.1%
Here:
71%
State:
55%
(% for various income ranges: 61.5% for AGIs below $25k, 66.7% for AGIs $25k-50k, 85.7% for AGIs $50k-75k, 80.0% for AGIs $75k-100k, 75.0% for AGIs $100k-200k)
Averages for the 2004 tax year for zip code 56349, filed in 2005:
Average Adjusted Gross Income (AGI) in 2004: $36,281 (Individual Income Tax Returns)
Here:
$36,281
State:
$53,560
Salary/wage: $31,659 (reported on 83.1% of returns)
Here:
$31,659
State:
$46,177
(% of AGI for various income ranges: 98.4% for AGIs below $10k, 70.5% for AGIs $10k-25k, 80.9% for AGIs $25k-50k, 79.5% for AGIs $50k-75k, 83.6% for AGIs $75k-100k, 32.0% for AGIs over 100k)
Taxable interest for individuals: $1,146 (reported on 59.6% of returns)
This zip code:
$1,146
Minnesota:
$1,796
(% of AGI for various income ranges: 8.8% for AGIs below $10k, 5.7% for AGIs $10k-25k, 1.6% for AGIs $25k-50k, 1.2% for AGIs $50k-75k, 0.5% for AGIs $75k-100k, 0.6% for AGIs over 100k)
Taxable dividends: $921 (reported on 21.3% of returns)
Here:
$921
State:
$3,096
(% of AGI for various income ranges: 6.5% for AGIs below $10k, 0.5% for AGIs $10k-25k, 0.8% for AGIs $25k-50k, 0.1% for AGIs $50k-75k, 0.5% for AGIs $75k-100k)
Net capital gain/loss: +$2,406 (reported on 19.4% of returns)
Here:
+$2,406
State:
+$10,864
(% of AGI for various income ranges: 3.6% for AGIs below $10k, 0.1% for AGIs $10k-25k, 0.3% for AGIs $25k-50k, -0.2% for AGIs $50k-75k, 7.8% for AGIs $75k-100k)
Profit/loss from business: +$9,014 (reported on 20.2% of returns)
Here:
+$9,014
State:
+$10,442
(% of AGI for various income ranges: 6.9% for AGIs below $10k, 9.4% for AGIs $10k-25k, 3.9% for AGIs $25k-50k, 9.2% for AGIs $50k-75k)
Profit/loss from farming: +$57 (reported on 14.9% of returns)
Here:
+$57
State:
-$962
IRA payment deduction: $2,062 (reported on 4.5% of returns)
56349:
$2,062
Minnesota:
$2,955
Total itemized deductions: $13,461 (21% of AGI, reported on 21.3% of returns)
Here:
$13,461
State:
$20,035
Here:
21.3% of AGI
State:
21.3% of AGI
(% of AGI for various income ranges: 7.5% for AGIs $10k-25k, 6.6% for AGIs $25k-50k, 8.1% for AGIs $50k-75k, 19.5% for AGIs $75k-100k)
Charity contributions deductions: $1,656 (2% of AGI, reported on 18.0% of returns)
Here:
$1,656
State:
$3,333
Here:
2.5% of AGI
State:
3.4% of AGI
Total tax: $3,848 (reported on 83.1% of returns)
56349:
$3,848
State:
$8,485
(% of AGI for various income ranges: 3.9% for AGIs below $10k, 5.2% for AGIs $10k-25k, 7.4% for AGIs $25k-50k, 8.3% for AGIs $50k-75k, 9.8% for AGIs $75k-100k, 14.9% for AGIs over 100k)
Earned income credit: $1,893 (reported on 7.9% of returns)
Here:
$1,893
State:
$1,523
Percentage of individuals using paid preparers for their 2004 taxes: 74.7%
Here:
75%
State:
59%
(% for various income ranges: 73.0% for AGIs below $10k, 73.7% for AGIs $10k-25k, 68.9% for AGIs $25k-50k, 87.1% for AGIs $50k-75k, 69.6% for AGIs $75k-100k, 83.3% for AGIs over 100k)
Household received Food Stamps/SNAP in the past 12 months: 15 Household did not receive Food Stamps/SNAP in the past 12 months: 304
Women who had a birth in the past 12 months: 7 (5 now married, 1 unmarried) Women who did not have a birth in the past 12 months: 98 (64 now married, 34 unmarried)
Housing units in zip code 56349 with a mortgage: 161 (10 second mortgage, 11 both second mortgage and home equity loan) Houses without a mortgage: 10
Median monthly owner costs for units with a mortgage: $1,488 Median monthly owner costs for units without a mortgage: $585
Residents with income below the poverty level in 2022:
This zip code:
5.1%
Whole state:
9.6%
Residents with income below 50% of the poverty level in 2022:
This zip code:
3.9%
Whole state:
5.2%
Median number of rooms in houses and condos:
Here:
6.6
State:
7.1
Median number of rooms in apartments:
Here:
4.1
State:
3.8
Notable locations in this zip code not listed on our city pages
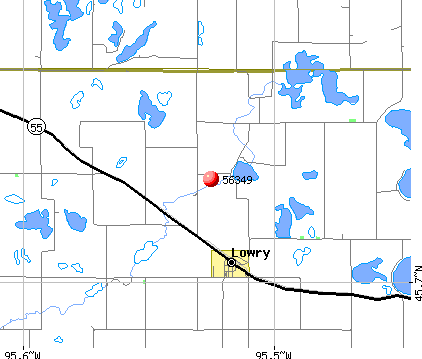
Churches in zip code 56349 include: Ben Wade Covenant Church (A), Saint Paul's Lutheran Church (B), Saint John Church (C), Norunga Church (D). Display/hide their locations on the map
Cemeteries: Oak Hill Cemetery (1), Saint John's Cemetery (2), Norunga Cemetery (3), Saint Pauls Cemetery (4), Swedish Mission Cemetery (5). Display/hide their locations on the map
Lakes and reservoirs: Lake Reno (A), Mud Lake (B), Mitmoen Lake (C), McClellan Lake (D), Lair Lake (E), Jorgenson Lake (F), John Lake (G), Horse Lake (H). Display/hide their locations on the map
Parks in zip code 56349 include: Lowry State Wildlife Management Area (1), Chermak State Wildlife Management Area (2). Display/hide their locations on the map
Size of family households: 156 2-persons, 25 3-persons, 36 4-persons, 25 5-persons, 3 6-persons
Size of nonfamily households: 56 1-person, 16 2-persons
140 married couples with children.
21 single-parent households (3 men, 18 women).
99.0% of residents of 56349 zip code speak English at home.
0.5% of residents speak other Indo-European language at home (100% very well).
0.1% of residents speak Asian or Pacific Island language at home (100% well).
Foreign born population: 1 (0.1%) (100.0% of them are naturalized citizens)
This zip code:
0.1%
Whole state:
8.7%
100%Singapore
33%German
22%Norwegian
13%Czech
5%Swedish
4%English
4%European
3%American
Year of entry for the foreign-born population
02010 or later
02000 to 2009
01990 to 1999
3Before 1990
Facilities with environmental interests located in this zip code:
BLAIR FARMS INC (31111 COUNTY ROAD 28 in LOWRY, MN)
National Pollutant Discharge Elimination System NON-MAJOR (Tracking pollutant discharge elimination systems) - permit Business SIC classification: DAIRY FARMS
CHANS AUTO SALES (HWY 55 AND 457 FLORENCE AVE in LOWRY, MN)
Small Quantity Generators, between 100 kg and 1000 kg of hazardous waste/month (Resource Conservation and Recovery Act (tracking hazardous waste)) - notification Organizations: CHAN JEFF (CONTACT/OWNER)
Housing units lacking complete plumbing facilities: 2.3% Housing units lacking complete kitchen facilities: 4.4%
43.6%Bottled, tank, or LP gas
34.5%Utility gas
12.3%Electricity
7.4%Wood
1.9%Fuel oil, kerosene, etc.
1.0%Other fuel
Population in 1990: 429. Population change in the 1990s: +259 (+60.4%).
Place of birth for U.S.-born residents:
This state: 657
Midwest: 63
South: 28
West: 17
70% of the 56349 zip code residents lived in the same house 5 years ago. Out of people who lived in different houses, 46% lived in this county. Out of people who lived in different counties, 50% lived in Minnesota.
94% of the 56349 zip code residents lived in the same house 1 year ago. Out of people who lived in different houses, 29% moved from this county. Out of people who lived in different houses, 54% moved from different county within same state. Out of people who lived in different houses, 17% moved from different state.
Private vs. public school enrollment:
Students in private schools in grades 1 to 8 (elementary and middle school): 4
Here:
5.4%
Minnesota:
12.9%
Students in private schools in grades 9 to 12 (high school):
Here:
0.0%
Minnesota:
8.6%
Students in private undergraduate colleges: 1
Here:
9.8%
Minnesota:
26.2%
Occupation by median earnings in the past 12 months ($)
90,726Business and financial operations occupations
86,603Installation, maintenance, and repair occupations
77,362Architecture and engineering occupations
67,469Computer and mathematical occupations
63,668Construction and extraction occupations
61,720Health diagnosing and treating practitioners and other technical occupations
Top industries in this zip code by the number of employees in 2005:
Finance and Insurance: Commercial Banking (10-19 employees: 1 establishment)
Construction: Site Preparation Contractors (5-9: 1, 1-4: 1)
Accommodation and Food Services: Full-Service Restaurants (5-9: 1, 1-4: 1)
Other Services (except Public Administration): Civic and Social Organizations (5-9: 1)
Wholesale Trade: Grain and Field Bean Merchant Wholesalers (5-9: 1)
Other Services (except Public Administration): Religious Organizations (1-4: 3)
Wholesale Trade: Farm and Garden Machinery and Equipment Merchant Wholesalers (1-4: 1)
Fatal accident statistics in 2011:
Fatal accident count: 1
Vehicles involved in fatal accidents: 1
Fatal accidents caused by drunken drivers: 1
Fatalities: 1
Persons involved in fatal accidents: 3
Pedestrians involved in fatal accidents: 1
2003 - 2018 National Fire Incident Reporting System (NFIRS) incidents
According to the data from the years 2003 - 2018 the average number of fires per year is 6. The highest number of fires - 14 took place in 2011, and the least - 0 in 2004. The data has a growing trend.
When looking into fire subcategories, the most incidents belonged to: Outside Fires (48.5%), and Structure Fires (24.3%).
Fire incident types reported to NFIRS in Zip Code 56349


+$57
-$962
 Nearest zip codes: 56327, 56381, 56308, 56343, 56323, 56334.


 According to the data from the years 2003 - 2018 the average number of fires per year is 6. The highest number of fires - 14 took place in 2011, and the least - 0 in 2004. The data has a growing trend.
 When looking into fire subcategories, the most incidents belonged to: Outside Fires (48.5%), and Structure Fires (24.3%).