Estimated zip code population in 2022: 233 Zip code population in 2010: 346 Zip code population in 2000: 368
Houses and condos: 123 Renter-occupied apartments: 3
% of renters here:
3%
State:
28%
March 2022 cost of living index in zip code 56546: 84.3 (less than average, U.S. average is 100)
Land area: 60.3 sq. mi. Water area: 0.0 sq. mi.
Population density: 4 people per square mile
(very low).
OSM Map
General Map
Google Map
MSN Map
OSM Map
General Map
Google Map
MSN Map
OSM Map
General Map
Google Map
MSN Map
OSM Map
General Map
Google Map
MSN Map
Please wait while loading the map...
Real estate property taxes paid for housing units in 2022:
This zip code:
0.9% ($2,046)
Minnesota:
1.0% ($3,087)
Median real estate property taxes paid for housing units with mortgages in 2022: $2,388 (0.8%) Median real estate property taxes paid for housing units with no mortgage in 2022: $1,866 (0.9%)
Business Search- 14 Million verified businesses
Males: 122
(52.4%)
Females: 111
(47.6%)
For population 25 years and over in 56546:
High school or higher: 88.7%
Bachelor's degree or higher: 25.4%
Graduate or professional degree: 0.7%
Unemployed: 2.9%
Mean travel time to work (commute): 31.6 minutes
For population 15 years and over in 56546:
Never married: 29.4%
Now married: 54.7%
Separated: 0.0%
Widowed: 6.0%
Divorced: 10.0%
Zip code 56546 compared to state average:
Black race population percentage significantly below state average.
Foreign-born population percentage significantly below state average.
Renting percentage significantly below state average.
Length of stay since moving in above state average.
Number of college students below state average.
Percentage of population with a bachelor's degree or higher below state average.
Estimated median house/condo value in 2022: $223,006
56546:
$223,006
Minnesota:
$314,600
Median resident age:
This zip code:
41.8 years
Minnesota median age:
39.0 years
Average household size:
This zip code:
2.3 people
Minnesota:
2.4 people
Averages for the 2020 tax year for zip code 56546, filed in 2021:
Average Adjusted Gross Income (AGI) in 2020: $68,975 (Individual Income Tax Returns)
Here:
$68,975
State:
$82,178
Salary/wage: $50,356 (reported on 75.0% of returns)
Here:
$50,356
State:
$67,438
(% of AGI for various income ranges: 2235.0% for AGIs below $25k, 5853.3% for AGIs $50k-75k)
Taxable interest for individuals: $850 (reported on 33.3% of returns)
This zip code:
$850
Minnesota:
$1,814
(% of AGI for various income ranges: 113.3% for AGIs $50k-75k)
Ordinary dividends: $1,000 (reported on 16.7% of returns)
Here:
$1,000
State:
$6,928
(% of AGI for various income ranges: 50.0% for AGIs below $25k)
Net capital gain/loss in AGI: +$6,650 (reported on 16.7% of returns)
Here:
+$6,650
State:
+$20,591
(% of AGI for various income ranges: 332.5% for AGIs below $25k)
Percentage of individuals using paid preparers for their 2020 taxes: 100.0%
Here:
100%
State:
94%
(% for various income ranges: 100.0% for AGIs below $25k, 100.0% for AGIs $50k-75k, 100.0% for AGIs $100k-200k)
Averages for the 2012 tax year for zip code 56546, filed in 2013:
Average Adjusted Gross Income (AGI) in 2012: $64,408 (Individual Income Tax Returns)
Here:
$64,408
State:
$67,192
Salary/wage: $36,545 (reported on 91.7% of returns)
Here:
$36,545
State:
$55,182
(% of AGI for various income ranges: 82.5% for AGIs below $25k, 76.3% for AGIs $25k-50k, 62.5% for AGIs $50k-75k, 32.8% for AGIs $100k-200k)
Taxable interest for individuals: $600 (reported on 50.0% of returns)
This zip code:
$600
Minnesota:
$1,664
Ordinary dividends: $2,200 (reported on 16.7% of returns)
Here:
$2,200
State:
$5,665
Net capital gain/loss in AGI: +$9,400 (reported on 16.7% of returns)
Here:
+$9,400
State:
+$16,131
Total itemized deductions: $17,225 (17% of AGI, reported on 33.3% of returns)
Here:
$17,225
State:
$24,665
Here:
16.7% of AGI
State:
19.6% of AGI
Charity contributions: $2,133 (reported on 25.0% of returns)
Here:
$2,133
State:
$3,948
Taxes paid: $10,233 (reported on 25.0% of returns)
56546:
$10,233
State:
$10,589
Percentage of individuals using paid preparers for their 2012 taxes: 75.0%
Here:
75%
State:
55%
Averages for the 2004 tax year for zip code 56546, filed in 2005:
Average Adjusted Gross Income (AGI) in 2004: $43,942 (Individual Income Tax Returns)
Here:
$43,942
State:
$53,560
Salary/wage: $30,869 (reported on 89.0% of returns)
Here:
$30,869
State:
$46,177
(% of AGI for various income ranges: 81.0% for AGIs below $10k, 72.7% for AGIs $10k-25k, 79.3% for AGIs $25k-50k, 70.7% for AGIs $50k-75k, 67.7% for AGIs $75k-100k, 31.7% for AGIs over 100k)
Taxable interest for individuals: $507 (reported on 48.7% of returns)
This zip code:
$507
Minnesota:
$1,796
(% of AGI for various income ranges: 1.5% for AGIs $10k-25k, 0.3% for AGIs $25k-50k, 0.5% for AGIs $50k-75k, 1.7% for AGIs $75k-100k)
Taxable dividends: $286 (reported on 18.2% of returns)
Here:
$286
State:
$3,096
Net capital gain/loss: +$1,476 (reported on 13.6% of returns)
Here:
+$1,476
State:
+$10,864
Profit/loss from farming: +$8,240 (reported on 16.2% of returns)
Here:
+$8,240
State:
-$962
Total itemized deductions: $14,273 (19% of AGI, reported on 21.4% of returns)
Here:
$14,273
State:
$20,035
Here:
19.4% of AGI
State:
21.3% of AGI
Charity contributions deductions: $1,000 (1% of AGI, reported on 17.5% of returns)
Here:
$1,000
State:
$3,333
Here:
1.3% of AGI
State:
3.4% of AGI
Total tax: $5,836 (reported on 83.1% of returns)
56546:
$5,836
State:
$8,485
(% of AGI for various income ranges: 6.8% for AGIs $10k-25k, 8.5% for AGIs $25k-50k, 10.2% for AGIs $50k-75k, 11.6% for AGIs $75k-100k, 16.2% for AGIs over 100k)
Earned income credit: $1,286 (reported on 9.1% of returns)
Here:
$1,286
State:
$1,523
Percentage of individuals using paid preparers for their 2004 taxes: 64.9%
Here:
65%
State:
59%
(% for various income ranges: 56.5% for AGIs below $10k, 51.5% for AGIs $10k-25k, 58.3% for AGIs $25k-50k, 119.2% for AGIs $50k-75k, 84.6% for AGIs over 100k)
Household received Food Stamps/SNAP in the past 12 months: 8 Household did not receive Food Stamps/SNAP in the past 12 months: 95
Women who did not have a birth in the past 12 months: 39 (18 now married, 21 unmarried)
Housing units in zip code 56546 with a mortgage: 38 (4 second mortgage, 3 both second mortgage and home equity loan) Median monthly owner costs for units with a mortgage: $1,881 Median monthly owner costs for units without a mortgage: $661
Residents with income below the poverty level in 2022:
This zip code:
6.4%
Whole state:
9.6%
Residents with income below 50% of the poverty level in 2022:
This zip code:
4.5%
Whole state:
5.2%
Median number of rooms in houses and condos:
Here:
6.7
State:
7.1
Notable locations in this zip code not listed on our city pages
Size of family households: 39 2-persons, 14 3-persons, 11 4-persons, 8 5-persons, 1 7-or-more-persons
Size of nonfamily households: 28 1-person
20 married couples with children.
8 single-parent households (8 men).
99.1% of residents of 56546 zip code speak English at home.
0.9% of residents speak Spanish at home (100% very well).
Foreign born population: 0 (0.0%)
:
0.0%
Whole state:
8.7%
32%Norwegian
22%German
5%European
5%Scandinavian
3%Czech
2%English
1%Italian
Facilities with environmental interests located in this zip code:
GEORGETOWN (CITY HALL in GEORGETOWN, MN)
National Pollutant Discharge Elimination System NON-MAJOR (Tracking pollutant discharge elimination systems) - permit Business SIC classification: SEWERAGE SYSTEMS
GEORGETOWN FARMERS ELEVATOR COMPANY (HWY 75 WEST in GEORGETOWN, MN)
ENFORCEMENT/COMPLIANCE ACTIVITY (Integrated Compliance Information System)
Housing units lacking complete plumbing facilities: 2.9% Housing units lacking complete kitchen facilities: 4.7%
58.0%Bottled, tank, or LP gas
35.0%Electricity
8.0%Fuel oil, kerosene, etc.
Population in 1990: 425.
Place of birth for U.S.-born residents:
This state: 104
Northeast: 2
Midwest: 113
South: 5
West: 6
68% of the 56546 zip code residents lived in the same house 5 years ago. Out of people who lived in different houses, 38% lived in this county. Out of people who lived in different counties, 50% lived in Minnesota.
92% of the 56546 zip code residents lived in the same house 1 year ago. Out of people who lived in different houses, 75% moved from this county. Out of people who lived in different houses, 25% moved from different state.
Private vs. public school enrollment:
Students in private schools in grades 1 to 8 (elementary and middle school): 2
Here:
11.9%
Minnesota:
12.9%
Students in private schools in grades 9 to 12 (high school):
Here:
0.0%
Minnesota:
8.6%
Students in private undergraduate colleges:
Here:
0.0%
Minnesota:
26.2%
Occupation by median earnings in the past 12 months ($)
98,165Sales and related occupations
79,659Management occupations
66,819Business and financial operations occupations
51,567Installation, maintenance, and repair occupations
39,744Office and administrative support occupations
39,537Production occupations
Top industries in this zip code by the number of employees in 2005:
Wholesale Trade: Grain and Field Bean Merchant Wholesalers (5-9 employees: 1 establishment)
Construction: Power and Communication Line and Related Structures Construction (5-9: 1)
Construction: Highway, Street, and Bridge Construction (1-4: 1)
Construction: Water and Sewer Line and Related Structures Construction (1-4: 1)
Accommodation and Food Services: Drinking Places (Alcoholic Beverages) (1-4: 1)
Home Mortgage Disclosure Act Aggregated Statistics For Year 2009 (Based on 2 partial tracts)
A) FHA, FSA/RHS & VA Home Purchase Loans
B) Conventional Home Purchase Loans
C) Refinancings
D) Home Improvement Loans
F) Non-occupant Loans on < 5 Family Dwellings (A B C & D)
G) Loans On Manufactured Home Dwelling (A B C & D)
Number
Average Value
Number
Average Value
Number
Average Value
Number
Average Value
Number
Average Value
Number
Average Value
LOANS ORIGINATED
2
$129,930
4
$130,760
25
$131,183
4
$27,148
1
$77,770
0
$0
APPLICATIONS APPROVED, NOT ACCEPTED
0
$0
0
$0
1
$127,090
0
$0
0
$0
0
$0
APPLICATIONS DENIED
1
$106,700
1
$104,320
6
$162,730
3
$34,143
0
$0
2
$94,365
APPLICATIONS WITHDRAWN
0
$0
1
$161,230
4
$170,238
1
$190,150
0
$0
0
$0
FILES CLOSED FOR INCOMPLETENESS
0
$0
0
$0
0
$0
0
$0
0
$0
0
$0
Aggregated Statistics For Year 2008 (Based on 2 partial tracts)
A) FHA, FSA/RHS & VA Home Purchase Loans
B) Conventional Home Purchase Loans
C) Refinancings
D) Home Improvement Loans
F) Non-occupant Loans on < 5 Family Dwellings (A B C & D)
G) Loans On Manufactured Home Dwelling (A B C & D)
Number
Average Value
Number
Average Value
Number
Average Value
Number
Average Value
Number
Average Value
Number
Average Value
LOANS ORIGINATED
3
$144,947
7
$146,596
12
$106,774
5
$28,832
0
$0
1
$119,970
APPLICATIONS APPROVED, NOT ACCEPTED
0
$0
1
$155,540
1
$42,680
0
$0
0
$0
1
$41,730
APPLICATIONS DENIED
0
$0
0
$0
7
$135,283
2
$51,925
1
$28,450
0
$0
APPLICATIONS WITHDRAWN
1
$94,840
0
$0
2
$163,600
0
$0
0
$0
0
$0
FILES CLOSED FOR INCOMPLETENESS
0
$0
0
$0
0
$0
0
$0
0
$0
0
$0
Aggregated Statistics For Year 2007 (Based on 2 partial tracts)
A) FHA, FSA/RHS & VA Home Purchase Loans
B) Conventional Home Purchase Loans
C) Refinancings
D) Home Improvement Loans
G) Loans On Manufactured Home Dwelling (A B C & D)
Number
Average Value
Number
Average Value
Number
Average Value
Number
Average Value
Number
Average Value
LOANS ORIGINATED
3
$99,583
9
$128,298
15
$127,939
4
$29,875
2
$82,750
APPLICATIONS APPROVED, NOT ACCEPTED
0
$0
1
$108,120
1
$170,240
0
$0
1
$108,120
APPLICATIONS DENIED
0
$0
1
$63,540
6
$102,427
1
$14,700
0
$0
APPLICATIONS WITHDRAWN
0
$0
0
$0
4
$133,488
0
$0
0
$0
FILES CLOSED FOR INCOMPLETENESS
0
$0
0
$0
2
$120,210
0
$0
0
$0
Aggregated Statistics For Year 2006 (Based on 2 partial tracts)
B) Conventional Home Purchase Loans
C) Refinancings
D) Home Improvement Loans
G) Loans On Manufactured Home Dwelling (A B C & D)
Number
Average Value
Number
Average Value
Number
Average Value
Number
Average Value
LOANS ORIGINATED
8
$124,536
14
$98,634
9
$48,790
1
$59,270
APPLICATIONS APPROVED, NOT ACCEPTED
1
$81,090
1
$49,790
0
$0
0
$0
APPLICATIONS DENIED
3
$98,633
6
$137,755
2
$30,110
1
$56,430
APPLICATIONS WITHDRAWN
3
$122,343
5
$129,930
1
$64,020
0
$0
FILES CLOSED FOR INCOMPLETENESS
0
$0
1
$85,830
0
$0
0
$0
Aggregated Statistics For Year 2005 (Based on 2 partial tracts)
A) FHA, FSA/RHS & VA Home Purchase Loans
B) Conventional Home Purchase Loans
C) Refinancings
D) Home Improvement Loans
F) Non-occupant Loans on < 5 Family Dwellings (A B C & D)
G) Loans On Manufactured Home Dwelling (A B C & D)
Number
Average Value
Number
Average Value
Number
Average Value
Number
Average Value
Number
Average Value
Number
Average Value
LOANS ORIGINATED
2
$122,580
12
$136,135
18
$109,962
6
$33,273
2
$29,400
2
$59,750
APPLICATIONS APPROVED, NOT ACCEPTED
0
$0
0
$0
2
$83,695
0
$0
0
$0
0
$0
APPLICATIONS DENIED
0
$0
3
$140,207
3
$124,873
4
$34,852
0
$0
0
$0
APPLICATIONS WITHDRAWN
0
$0
1
$126,140
5
$85,736
1
$182,570
0
$0
0
$0
FILES CLOSED FOR INCOMPLETENESS
0
$0
1
$165,970
2
$160,755
0
$0
0
$0
0
$0
Aggregated Statistics For Year 2004 (Based on 2 partial tracts)
A) FHA, FSA/RHS & VA Home Purchase Loans
B) Conventional Home Purchase Loans
C) Refinancings
D) Home Improvement Loans
F) Non-occupant Loans on < 5 Family Dwellings (A B C & D)
G) Loans On Manufactured Home Dwelling (A B C & D)
Number
Average Value
Number
Average Value
Number
Average Value
Number
Average Value
Number
Average Value
Number
Average Value
LOANS ORIGINATED
2
$114,755
10
$91,426
21
$89,646
6
$30,112
1
$126,140
1
$38,880
APPLICATIONS APPROVED, NOT ACCEPTED
0
$0
1
$136,100
0
$0
0
$0
0
$0
0
$0
APPLICATIONS DENIED
0
$0
0
$0
9
$84,934
0
$0
0
$0
1
$85,360
APPLICATIONS WITHDRAWN
0
$0
0
$0
9
$112,069
1
$56,900
0
$0
0
$0
FILES CLOSED FOR INCOMPLETENESS
0
$0
0
$0
4
$110,252
0
$0
0
$0
0
$0
Aggregated Statistics For Year 2003 (Based on 2 partial tracts)
A) FHA, FSA/RHS & VA Home Purchase Loans
B) Conventional Home Purchase Loans
C) Refinancings
D) Home Improvement Loans
F) Non-occupant Loans on < 5 Family Dwellings (A B C & D)
Number
Average Value
Number
Average Value
Number
Average Value
Number
Average Value
Number
Average Value
LOANS ORIGINATED
2
$77,530
9
$102,217
44
$96,726
3
$29,873
2
$89,860
APPLICATIONS APPROVED, NOT ACCEPTED
0
$0
0
$0
2
$116,415
0
$0
0
$0
APPLICATIONS DENIED
0
$0
1
$75,870
16
$100,738
2
$17,545
0
$0
APPLICATIONS WITHDRAWN
0
$0
1
$241,840
8
$67,396
0
$0
0
$0
FILES CLOSED FOR INCOMPLETENESS
0
$0
0
$0
0
$0
0
$0
0
$0
Aggregated Statistics For Year 1999 (Based on 1 partial tract)


+$8,240
-$962
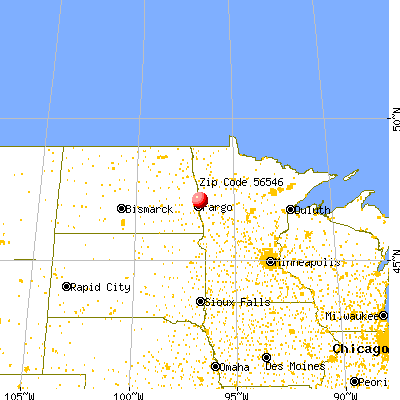
 Nearest zip codes: 56574, 56550, 58102, 56536, 58105, 56529.


