Estimated zip code population in 2022: 1,476 Zip code population in 2010: 1,372 Zip code population in 2000: 1,398
Houses and condos: 602 Renter-occupied apartments: 90
% of renters here:
16%
State:
30%
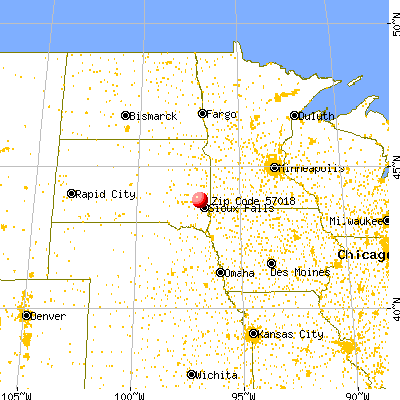
March 2022 cost of living index in zip code 57018: 77.1 (low, U.S. average is 100)
Land area: 81.7 sq. mi. Water area: 1.5 sq. mi.
Population density: 18 people per square mile
(very low).
OSM Map
General Map
Google Map
MSN Map
OSM Map
General Map
Google Map
MSN Map
OSM Map
General Map
Google Map
MSN Map
OSM Map
General Map
Google Map
MSN Map
Please wait while loading the map...
Real estate property taxes paid for housing units in 2022:
This zip code:
1.0% ($2,317)
South Dakota:
1.0% ($2,481)
Median real estate property taxes paid for housing units with mortgages in 2022: $2,399 (1.0%) Median real estate property taxes paid for housing units with no mortgage in 2022: $2,189 (0.9%)
Business Search- 14 Million verified businesses
Males: 726
(49.2%)
Females: 749
(50.8%)
For population 25 years and over in 57018:
High school or higher: 96.5%
Bachelor's degree or higher: 27.2%
Graduate or professional degree: 3.7%
Unemployed: 6.6%
Mean travel time to work (commute): 26.0 minutes
For population 15 years and over in 57018:
Never married: 21.3%
Now married: 67.2%
Separated: 2.9%
Widowed: 5.5%
Divorced: 3.2%
Zip code 57018 compared to state average:
Unemployed percentage above state average.
Black race population percentage significantly below state average.
Hispanic race population percentage significantly below state average.
Foreign-born population percentage significantly below state average.
Renting percentage below state average.
Length of stay since moving in significantly above state average.
Number of college students significantly below state average.
Estimated median house/condo value in 2022: $241,651
57018:
$241,651
South Dakota:
$245,000
According to our research of South Dakota and other state lists, there were 3 registered sex offenders living in 57018 zip code as of May 30, 2024. The ratio of all residents to sex offenders in zip code 57018 is 459 to 1. The ratio of registered sex offenders to all residents in this zip code is lower than the state average.
Median resident age:
This zip code:
37.7 years
South Dakota median age:
38.5 years
Average household size:
This zip code:
2.6 people
South Dakota:
2.4 people
Averages for the 2020 tax year for zip code 57018, filed in 2021:
Average Adjusted Gross Income (AGI) in 2020: $76,941 (Individual Income Tax Returns)
Here:
$76,941
State:
$75,230
Salary/wage: $59,848 (reported on 84.1% of returns)
Here:
$59,848
State:
$54,824
(% of AGI for various income ranges: 1372.5% for AGIs below $25k, 4176.0% for AGIs $25k-50k, 6151.2% for AGIs $50k-75k, 8307.1% for AGIs $75k-100k, 17970.0% for AGIs $100k-200k)
Taxable interest for individuals: $1,054 (reported on 34.8% of returns)
This zip code:
$1,054
South Dakota:
$2,207
(% of AGI for various income ranges: 9.2% for AGIs below $25k, 25.0% for AGIs $25k-50k, 25.0% for AGIs $50k-75k, 81.4% for AGIs $75k-100k, 175.0% for AGIs $100k-200k)
Ordinary dividends: $3,129 (reported on 24.6% of returns)
Here:
$3,129
State:
$6,303
(% of AGI for various income ranges: 54.2% for AGIs below $25k, 32.5% for AGIs $50k-75k, 127.1% for AGIs $75k-100k, 440.0% for AGIs $100k-200k)
Net capital gain/loss in AGI: +$4,906 (reported on 23.2% of returns)
Here:
+$4,906
State:
+$27,098
(% of AGI for various income ranges: 31.0% for AGIs $25k-50k, 52.5% for AGIs $50k-75k, 167.1% for AGIs $75k-100k, 743.8% for AGIs $100k-200k)
Profit/loss from business: +$10,567 (reported on 13.0% of returns)
Here:
+$10,567
State:
+$13,092
(% of AGI for various income ranges: 156.7% for AGIs below $25k, 288.8% for AGIs $50k-75k, 665.0% for AGIs $100k-200k)
Taxable individual retirement arrangement distribution: $9,833 (reported on 8.7% of returns)
57018:
$9,833
South Dakota:
$17,605
(% of AGI for various income ranges: 143.3% for AGIs below $25k, 597.1% for AGIs $75k-100k)
Total itemized deductions: $34,050 (reported on 2.9% of returns)
Here:
$34,050
State:
$43,941
(% of AGI for various income ranges: 681.0% for AGIs $25k-50k)
Taxes paid: $5,250 (reported on 2.9% of returns)
57018:
$5,250
State:
$6,525
(% of AGI for various income ranges: 105.0% for AGIs $25k-50k)
Earned income credit: $2,583 (reported on 8.7% of returns)
Here:
$2,583
State:
$2,165
(% of AGI for various income ranges: 75.0% for AGIs below $25k, 65.0% for AGIs $25k-50k)
Percentage of individuals using paid preparers for their 2020 taxes: 92.8%
Here:
93%
State:
95%
(% for various income ranges: 94.4% for AGIs below $25k, 85.7% for AGIs $25k-50k, 90.9% for AGIs $50k-75k, 100.0% for AGIs $75k-100k, 93.3% for AGIs $100k-200k, 100.0% for AGIs over 200k)
Averages for the 2012 tax year for zip code 57018, filed in 2013:
Average Adjusted Gross Income (AGI) in 2012: $54,665 (Individual Income Tax Returns)
Here:
$54,665
State:
$58,425
Salary/wage: $42,398 (reported on 86.8% of returns)
Here:
$42,398
State:
$41,676
(% of AGI for various income ranges: 77.3% for AGIs below $25k, 81.2% for AGIs $25k-50k, 75.6% for AGIs $50k-75k, 78.6% for AGIs $75k-100k, 49.2% for AGIs $100k-200k)
Taxable interest for individuals: $1,238 (reported on 38.2% of returns)
This zip code:
$1,238
South Dakota:
$2,148
(% of AGI for various income ranges: 1.7% for AGIs below $25k, 1.9% for AGIs $25k-50k, 1.0% for AGIs $50k-75k, 0.3% for AGIs $75k-100k, 0.5% for AGIs $100k-200k)
Ordinary dividends: $2,131 (reported on 19.1% of returns)
Here:
$2,131
State:
$6,197
(% of AGI for various income ranges: 3.3% for AGIs below $25k, 1.1% for AGIs $25k-50k, 0.3% for AGIs $75k-100k, 0.8% for AGIs $100k-200k)
Net capital gain/loss in AGI: +$12,650 (reported on 14.7% of returns)
Here:
+$12,650
State:
+$21,273
(% of AGI for various income ranges: 0.3% for AGIs $50k-75k, 8.9% for AGIs $100k-200k)
Profit/loss from business: +$5,470 (reported on 14.7% of returns)
Here:
+$5,470
State:
+$11,552
(% of AGI for various income ranges: 7.5% for AGIs below $25k, 4.0% for AGIs $25k-50k, 1.5% for AGIs $75k-100k)
Taxable individual retirement arrangement distribution: $6,612 (reported on 11.8% of returns)
57018:
$6,612
South Dakota:
$12,416
Total itemized deductions: $16,292 (20% of AGI, reported on 17.6% of returns)
Here:
$16,292
State:
$21,763
Here:
19.9% of AGI
State:
16.0% of AGI
(% of AGI for various income ranges: 8.3% for AGIs $25k-50k, 4.8% for AGIs $50k-75k, 6.3% for AGIs $75k-100k, 4.5% for AGIs $100k-200k)
Charity contributions: $3,000 (reported on 11.8% of returns)
Here:
$3,000
State:
$5,927
(% of AGI for various income ranges: 0.8% for AGIs $25k-50k, 0.8% for AGIs $75k-100k, 1.0% for AGIs $100k-200k)
Taxes paid: $3,033 (reported on 17.6% of returns)
57018:
$3,033
State:
$5,214
(% of AGI for various income ranges: 1.2% for AGIs $25k-50k, 0.8% for AGIs $50k-75k, 1.1% for AGIs $75k-100k, 1.1% for AGIs $100k-200k)
Earned income credit: $2,086 (reported on 10.3% of returns)
Here:
$2,086
State:
$2,081
(% of AGI for various income ranges: 4.1% for AGIs below $25k, 0.7% for AGIs $25k-50k)
Percentage of individuals using paid preparers for their 2012 taxes: 64.7%
Here:
65%
State:
55%
(% for various income ranges: 54.5% for AGIs below $25k, 61.1% for AGIs $25k-50k, 66.7% for AGIs $50k-75k, 75.0% for AGIs $75k-100k, 87.5% for AGIs $100k-200k)
Averages for the 2004 tax year for zip code 57018, filed in 2005:
Average Adjusted Gross Income (AGI) in 2004: $39,074 (Individual Income Tax Returns)
Here:
$39,074
State:
$41,242
Salary/wage: $34,382 (reported on 85.5% of returns)
Here:
$34,382
State:
$32,969
(% of AGI for various income ranges: 140.3% for AGIs below $10k, 76.7% for AGIs $10k-25k, 78.8% for AGIs $25k-50k, 76.4% for AGIs $50k-75k, 78.4% for AGIs $75k-100k, 59.6% for AGIs over 100k)
Taxable interest for individuals: $1,836 (reported on 41.5% of returns)
This zip code:
$1,836
South Dakota:
$2,098
(% of AGI for various income ranges: 5.7% for AGIs below $10k, 3.5% for AGIs $10k-25k, 2.0% for AGIs $25k-50k, 2.7% for AGIs $50k-75k, 0.3% for AGIs $75k-100k, 0.5% for AGIs over 100k)
Taxable dividends: $841 (reported on 24.2% of returns)
Here:
$841
State:
$2,577
(% of AGI for various income ranges: 0.9% for AGIs below $10k, 0.8% for AGIs $10k-25k, 0.5% for AGIs $25k-50k, 0.7% for AGIs $50k-75k, 0.3% for AGIs $75k-100k, 0.3% for AGIs over 100k)
Net capital gain/loss: +$5,217 (reported on 20.4% of returns)
Here:
+$5,217
State:
+$11,418
(% of AGI for various income ranges: -2.4% for AGIs below $10k, -0.5% for AGIs $10k-25k, 0.6% for AGIs $25k-50k, 1.7% for AGIs $50k-75k, -0.1% for AGIs $75k-100k, 11.6% for AGIs over 100k)
Profit/loss from business: +$6,722 (reported on 16.0% of returns)
Here:
+$6,722
State:
+$9,138
(% of AGI for various income ranges: 4.0% for AGIs below $10k, 5.5% for AGIs $10k-25k, 4.9% for AGIs $25k-50k, 2.3% for AGIs $50k-75k, 0.8% for AGIs $75k-100k)
Profit/loss from farming: +$2,349 (reported on 15.7% of returns)
Here:
+$2,349
State:
-$429
(% of AGI for various income ranges: 5.0% for AGIs below $10k, 1.7% for AGIs $10k-25k, 3.7% for AGIs $25k-50k, 0.0% for AGIs $50k-75k, -1.6% for AGIs over 100k)
IRA payment deduction: $1,300 (reported on 1.5% of returns)
57018:
$1,300
South Dakota:
$3,029
Total itemized deductions: $13,991 (22% of AGI, reported on 16.7% of returns)
Here:
$13,991
State:
$17,139
Here:
21.5% of AGI
State:
19.0% of AGI
(% of AGI for various income ranges: 6.7% for AGIs $10k-25k, 5.4% for AGIs $25k-50k, 6.4% for AGIs $50k-75k, 5.6% for AGIs $75k-100k, 6.4% for AGIs over 100k)
Charity contributions deductions: $1,921 (3% of AGI, reported on 13.1% of returns)
Here:
$1,921
State:
$4,114
Here:
2.8% of AGI
State:
4.2% of AGI
(% of AGI for various income ranges: 0.8% for AGIs $10k-25k, 0.4% for AGIs $25k-50k, 0.7% for AGIs $50k-75k, 0.3% for AGIs $75k-100k, 1.1% for AGIs over 100k)
Total tax: $5,092 (reported on 77.1% of returns)
57018:
$5,092
State:
$6,372
(% of AGI for various income ranges: 4.3% for AGIs below $10k, 5.1% for AGIs $10k-25k, 7.3% for AGIs $25k-50k, 8.9% for AGIs $50k-75k, 10.5% for AGIs $75k-100k, 19.1% for AGIs over 100k)
Earned income credit: $1,594 (reported on 9.5% of returns)
Here:
$1,594
State:
$1,607
Percentage of individuals using paid preparers for their 2004 taxes: 62.8%
Here:
63%
State:
63%
(% for various income ranges: 44.8% for AGIs below $10k, 58.9% for AGIs $10k-25k, 64.7% for AGIs $25k-50k, 69.9% for AGIs $50k-75k, 86.8% for AGIs $75k-100k, 85.7% for AGIs over 100k)
Household received Food Stamps/SNAP in the past 12 months: 35 Household did not receive Food Stamps/SNAP in the past 12 months: 524
Women who had a birth in the past 12 months: 5 (5 now married, 0 unmarried) Women who did not have a birth in the past 12 months: 323 (198 now married, 127 unmarried)
Housing units in zip code 57018 with a mortgage: 254 (29 second mortgage, 17 both second mortgage and home equity loan) Houses without a mortgage: 4
Median monthly owner costs for units with a mortgage: $1,618 Median monthly owner costs for units without a mortgage: $566
Residents with income below the poverty level in 2022:
This zip code:
9.7%
Whole state:
12.5%
Residents with income below 50% of the poverty level in 2022:
This zip code:
4.3%
Whole state:
6.8%
Median number of rooms in houses and condos:
Here:
7.2
State:
7.0
Median number of rooms in apartments:
Here:
3.7
State:
4.1
Notable locations in this zip code not listed on our city pages
Notable locations in zip code 57018: Buffalo Trading Post (A), Colton Volunteer Fire Department (B), Colton City Hall (C), Colton Branch Library (D). Display/hide their locations on the map
In group quarters: 5 (-1 institutionalized population)
Size of family households: 224 2-persons, 55 3-persons, 85 4-persons, 43 5-persons, 19 6-persons
Size of nonfamily households: 108 1-person, 16 2-persons
324 married couples with children.
103 single-parent households (17 men, 86 women).
97.6% of residents of 57018 zip code speak English at home.
2.2% of residents speak other Indo-European language at home (100% very well).
Foreign born population: 4 (0.3%) (0.0% of them are naturalized citizens)
:
0.3%
Whole state:
3.5%
117%Togo
39%Norwegian
21%American
12%German
6%Dutch
5%English
4%Irish
3%Slovak
Year of entry for the foreign-born population
02010 or later
02000 to 2009
71990 to 1999
2Before 1990
Facilities with environmental interests located in this zip code:
TRI-VALLEY JR HI SCH (46450 252ND ST in COLTON, SD)
(National Center for Education Statistics) - STATE ID-1 (National Center for Education Statistics) - STATE ID-3 Organizations: TRI-VALLEY SCHOOL DISTRICT 49-6 (SCHOOL DISTRICT)
EASTERN FARMERS CORP. (104 EAST EIGHTH STREET in COLTON, SD)
(Integrated Compliance Information System) - ICIS-08-2003-0051, FORMAL ENFORCEMENT ACTION ENFORCEMENT/COMPLIANCE ACTIVITY (Integrated Compliance Information System) Alternative names: EASTERN FARMERS COOPERATIVE - COLTON
TRI-VALLEY ELEM (46450 252ND ST in COLTON, SD)
(National Center for Education Statistics) - STATE ID-2 Organizations: TRI-VALLEY SCHOOL DISTRICT 49-6 (SCHOOL DISTRICT)
TRI-VALLEY SCHOOL DISTRICT (46450 252ND ST; MINNEHAHA CNTY in COLTON, SD)
ENFORCEMENT/COMPLIANCE ACTIVITY (Integrated Compliance Information System) COMPLIANCE ACTIVITY (Tracking inspections of insecticide, fungicide, and rodenticide, and toxic substances) Small Quantity Generators, between 100 kg and 1000 kg of hazardous waste/month (Resource Conservation and Recovery Act (tracking hazardous waste)) - notification Organizations: TRI-VALLEY SCHOOL DISTRICT 49-6 (CONTACT/OWNER)
Alternative names: TRI-VALLEY SCHOOL DISTRICT # 49-6
COLTON - CITY OF (SECTION 27, T104N, R51W, in COLTON, SD)
National Pollutant Discharge Elimination System NON-MAJOR (Tracking pollutant discharge elimination systems) - permit Business SIC classification: SEWERAGE SYSTEMS
TRI-VALLEY SCHOOL DIST.49-6 (IN COLTON,MINNEHAHA CO.S1/2 in COLTON, SD)
National Pollutant Discharge Elimination System NON-MAJOR (Tracking pollutant discharge elimination systems) - permit Business SIC classification: SEWERAGE SYSTEMS Alternative names: TRI VALLEY SCHOOL DISTRICT 49-
Housing units lacking complete kitchen facilities: 0.1%
49.0%Utility gas
25.7%Bottled, tank, or LP gas
22.4%Electricity
1.7%Fuel oil, kerosene, etc.
1.3%Other fuel
Population in 1990: 1,242. Population change in the 1990s: +156 (+12.6%).
Place of birth for U.S.-born residents:
This state: 1,033
Northeast: 19
Midwest: 304
South: 38
West: 66
68% of the 57018 zip code residents lived in the same house 5 years ago. Out of people who lived in different houses, 76% lived in this county. Out of people who lived in different counties, 50% lived in South Dakota.
95% of the 57018 zip code residents lived in the same house 1 year ago. Out of people who lived in different houses, 69% moved from this county. Out of people who lived in different houses, 36% moved from different county within same state.
Private vs. public school enrollment:
Students in private schools in grades 1 to 8 (elementary and middle school):
Here:
0.0%
South Dakota:
11.9%
Students in private schools in grades 9 to 12 (high school):
Here:
0.0%
South Dakota:
7.2%
Students in private undergraduate colleges:
Here:
0.0%
South Dakota:
10.2%
Occupation by median earnings in the past 12 months ($)
170,138Computer and mathematical occupations
95,702Management occupations
83,438Business and financial operations occupations
83,313Transportation occupations
77,599Health diagnosing and treating practitioners and other technical occupations
64,311Construction and extraction occupations
Top industries in this zip code by the number of employees in 2005:
Health Care and Social Assistance: Homes for the Elderly (50-99 employees: 1 establishment)
Construction: Poured Concrete Foundation and Structure Contractors (5-9: 1, 1-4: 1)
Construction: Site Preparation Contractors (5-9: 1)
Wholesale Trade: Grain and Field Bean Merchant Wholesalers (5-9: 1)
Wholesale Trade: Automobile and Other Motor Vehicle Merchant Wholesalers (5-9: 1)
Construction: Plumbing, Heating, and Air-Conditioning Contractors (1-4: 2)
People in group quarters in 2000:
16 people in nursing homes
Fatal accident statistics in 2012:
Fatal accident count: 1
Vehicles involved in fatal accidents: 1
Fatal accidents caused by drunken drivers: 1
Fatalities: 1
Persons involved in fatal accidents: 1
Pedestrians involved in fatal accidents: 0
Home Mortgage Disclosure Act Aggregated Statistics For Year 2009 (Based on 2 partial tracts)
A) FHA, FSA/RHS & VA Home Purchase Loans
B) Conventional Home Purchase Loans
C) Refinancings
D) Home Improvement Loans
E) Loans on Dwellings For 5+ Families
F) Non-occupant Loans on < 5 Family Dwellings (A B C & D)
G) Loans On Manufactured Home Dwelling (A B C & D)
Number
Average Value
Number
Average Value
Number
Average Value
Number
Average Value
Number
Average Value
Number
Average Value
Number
Average Value
LOANS ORIGINATED
5
$182,346
16
$199,221
63
$143,166
7
$63,726
1
$145,560
5
$63,704
1
$33,650
APPLICATIONS APPROVED, NOT ACCEPTED
2
$70,825
3
$191,217
9
$183,302
1
$12,520
0
$0
0
$0
1
$72,000
APPLICATIONS DENIED
2
$147,910
3
$85,563
21
$152,346
1
$7,830
0
$0
1
$34,430
0
$0
APPLICATIONS WITHDRAWN
2
$70,045
0
$0
7
$163,787
1
$7,830
0
$0
0
$0
0
$0
FILES CLOSED FOR INCOMPLETENESS
1
$133,040
0
$0
2
$87,260
1
$11,740
0
$0
0
$0
0
$0
Aggregated Statistics For Year 2008 (Based on 2 partial tracts)
A) FHA, FSA/RHS & VA Home Purchase Loans
B) Conventional Home Purchase Loans
C) Refinancings
D) Home Improvement Loans
F) Non-occupant Loans on < 5 Family Dwellings (A B C & D)
G) Loans On Manufactured Home Dwelling (A B C & D)
Number
Average Value
Number
Average Value
Number
Average Value
Number
Average Value
Number
Average Value
Number
Average Value
LOANS ORIGINATED
5
$121,616
18
$149,955
36
$174,042
3
$21,653
2
$156,520
1
$55,560
APPLICATIONS APPROVED, NOT ACCEPTED
0
$0
3
$175,823
9
$125,824
3
$212,083
0
$0
0
$0
APPLICATIONS DENIED
0
$0
2
$38,740
16
$123,015
0
$0
0
$0
2
$38,740
APPLICATIONS WITHDRAWN
1
$93,130
0
$0
5
$191,424
1
$156,520
0
$0
0
$0
FILES CLOSED FOR INCOMPLETENESS
0
$0
0
$0
1
$171,390
0
$0
0
$0
0
$0
Aggregated Statistics For Year 2007 (Based on 2 partial tracts)
A) FHA, FSA/RHS & VA Home Purchase Loans
B) Conventional Home Purchase Loans
C) Refinancings
D) Home Improvement Loans
F) Non-occupant Loans on < 5 Family Dwellings (A B C & D)
G) Loans On Manufactured Home Dwelling (A B C & D)
Number
Average Value
Number
Average Value
Number
Average Value
Number
Average Value
Number
Average Value
Number
Average Value
LOANS ORIGINATED
2
$111,910
20
$135,468
34
$117,344
11
$61,755
2
$156,520
0
$0
APPLICATIONS APPROVED, NOT ACCEPTED
0
$0
4
$144,780
5
$108,156
2
$19,565
0
$0
1
$93,910
APPLICATIONS DENIED
0
$0
2
$88,045
19
$136,378
5
$110,346
0
$0
5
$66,522
APPLICATIONS WITHDRAWN
0
$0
0
$0
6
$131,085
1
$28,960
0
$0
1
$58,700
FILES CLOSED FOR INCOMPLETENESS
0
$0
2
$86,475
4
$159,845
0
$0
0
$0
0
$0
Aggregated Statistics For Year 2006 (Based on 2 partial tracts)
A) FHA, FSA/RHS & VA Home Purchase Loans
B) Conventional Home Purchase Loans
C) Refinancings
D) Home Improvement Loans
F) Non-occupant Loans on < 5 Family Dwellings (A B C & D)
G) Loans On Manufactured Home Dwelling (A B C & D)
Number
Average Value
Number
Average Value
Number
Average Value
Number
Average Value
Number
Average Value
Number
Average Value
LOANS ORIGINATED
7
$102,856
21
$104,459
41
$109,030
9
$34,260
3
$50,607
3
$35,740
APPLICATIONS APPROVED, NOT ACCEPTED
0
$0
6
$89,347
5
$108,938
3
$38,607
0
$0
1
$109,560
APPLICATIONS DENIED
1
$57,910
5
$147,912
24
$114,292
9
$84,956
0
$0
1
$114,260
APPLICATIONS WITHDRAWN
0
$0
4
$89,020
12
$104,607
1
$100,960
0
$0
0
$0
FILES CLOSED FOR INCOMPLETENESS
0
$0
1
$29,740
3
$84,000
0
$0
0
$0
0
$0
Aggregated Statistics For Year 2005 (Based on 2 partial tracts)
A) FHA, FSA/RHS & VA Home Purchase Loans
B) Conventional Home Purchase Loans
C) Refinancings
D) Home Improvement Loans
F) Non-occupant Loans on < 5 Family Dwellings (A B C & D)
G) Loans On Manufactured Home Dwelling (A B C & D)
Number
Average Value
Number
Average Value
Number
Average Value
Number
Average Value
Number
Average Value
Number
Average Value
LOANS ORIGINATED
2
$124,825
30
$83,764
42
$112,881
9
$61,391
5
$83,268
5
$32,400
APPLICATIONS APPROVED, NOT ACCEPTED
0
$0
4
$86,085
9
$128,520
2
$34,435
1
$74,350
0
$0
APPLICATIONS DENIED
2
$113,475
2
$18,000
20
$126,155
5
$24,104
0
$0
5
$50,556
APPLICATIONS WITHDRAWN
0
$0
1
$90,780
12
$115,629
0
$0
0
$0
0
$0
FILES CLOSED FOR INCOMPLETENESS
0
$0
1
$32,090
2
$115,825
0
$0
0
$0
0
$0
Aggregated Statistics For Year 2004 (Based on 2 partial tracts)
A) FHA, FSA/RHS & VA Home Purchase Loans
B) Conventional Home Purchase Loans
C) Refinancings
D) Home Improvement Loans
F) Non-occupant Loans on < 5 Family Dwellings (A B C & D)
G) Loans On Manufactured Home Dwelling (A B C & D)
Number
Average Value
Number
Average Value
Number
Average Value
Number
Average Value
Number
Average Value
Number
Average Value
LOANS ORIGINATED
7
$94,471
19
$120,067
43
$122,559
9
$21,391
2
$98,215
2
$41,870
APPLICATIONS APPROVED, NOT ACCEPTED
0
$0
3
$111,650
5
$122,086
2
$47,345
0
$0
0
$0
APPLICATIONS DENIED
0
$0
5
$120,208
21
$93,800
3
$48,783
2
$89,610
0
$0
APPLICATIONS WITHDRAWN
0
$0
1
$78,260
23
$113,579
2
$84,910
0
$0
0
$0
FILES CLOSED FOR INCOMPLETENESS
0
$0
0
$0
11
$122,085
1
$102,520
0
$0
0
$0
Aggregated Statistics For Year 2003 (Based on 2 partial tracts)
A) FHA, FSA/RHS & VA Home Purchase Loans
B) Conventional Home Purchase Loans
C) Refinancings
D) Home Improvement Loans
F) Non-occupant Loans on < 5 Family Dwellings (A B C & D)
Number
Average Value
Number
Average Value
Number
Average Value
Number
Average Value
Number
Average Value
LOANS ORIGINATED
6
$126,260
18
$94,521
101
$97,693
5
$15,966
5
$52,122
APPLICATIONS APPROVED, NOT ACCEPTED
0
$0
1
$79,040
13
$100,775
0
$0
0
$0
APPLICATIONS DENIED
0
$0
7
$81,726
31
$89,418
5
$21,600
1
$74,350
APPLICATIONS WITHDRAWN
0
$0
1
$31,300
16
$100,906
0
$0
0
$0
FILES CLOSED FOR INCOMPLETENESS
0
$0
1
$100,170
3
$120,000
0
$0
1
$100,170
Aggregated Statistics For Year 2002 (Based on 2 partial tracts)
A) FHA, FSA/RHS & VA Home Purchase Loans
B) Conventional Home Purchase Loans
C) Refinancings
D) Home Improvement Loans
F) Non-occupant Loans on < 5 Family Dwellings (A B C & D)
Number
Average Value
Number
Average Value
Number
Average Value
Number
Average Value
Number
Average Value
LOANS ORIGINATED
6
$83,477
24
$82,597
66
$104,868
15
$17,635
3
$139,823
APPLICATIONS APPROVED, NOT ACCEPTED
0
$0
9
$79,999
5
$93,442
0
$0
1
$28,960
APPLICATIONS DENIED
0
$0
6
$57,522
22
$88,967
5
$17,686
3
$47,740
APPLICATIONS WITHDRAWN
1
$107,220
3
$193,040
13
$88,554
0
$0
2
$39,130
FILES CLOSED FOR INCOMPLETENESS
0
$0
1
$39,910
2
$164,735
0
$0
1
$70,430
Aggregated Statistics For Year 2001 (Based on 2 partial tracts)
A) FHA, FSA/RHS & VA Home Purchase Loans
B) Conventional Home Purchase Loans
C) Refinancings
D) Home Improvement Loans
E) Loans on Dwellings For 5+ Families
F) Non-occupant Loans on < 5 Family Dwellings (A B C & D)
Number
Average Value
Number
Average Value
Number
Average Value
Number
Average Value
Number
Average Value
Number
Average Value
LOANS ORIGINATED
7
$92,011
36
$86,043
67
$93,176
15
$20,139
1
$44,610
2
$81,780
APPLICATIONS APPROVED, NOT ACCEPTED
1
$61,830
11
$63,746
5
$89,842
2
$24,260
0
$0
0
$0
APPLICATIONS DENIED
1
$97,040
12
$53,217
20
$84,990
4
$12,912
0
$0
2
$134,605
APPLICATIONS WITHDRAWN
2
$70,045
2
$66,910
16
$109,418
0
$0
0
$0
0
$0
FILES CLOSED FOR INCOMPLETENESS
0
$0
1
$58,700
3
$78,260
0
$0
0
$0
0
$0
Aggregated Statistics For Year 2000 (Based on 2 partial tracts)
A) FHA, FSA/RHS & VA Home Purchase Loans
B) Conventional Home Purchase Loans
C) Refinancings
D) Home Improvement Loans
F) Non-occupant Loans on < 5 Family Dwellings (A B C & D)
Number
Average Value
Number
Average Value
Number
Average Value
Number
Average Value
Number
Average Value
LOANS ORIGINATED
13
$85,364
32
$80,657
27
$68,753
13
$14,147
2
$55,565
APPLICATIONS APPROVED, NOT ACCEPTED
1
$104,090
5
$52,590
5
$38,034
2
$7,435
0
$0
APPLICATIONS DENIED
1
$62,610
13
$42,080
16
$55,711
5
$15,496
2
$23,870
APPLICATIONS WITHDRAWN
1
$100,960
2
$80,215
4
$89,020
1
$39,130
0
$0
FILES CLOSED FOR INCOMPLETENESS
0
$0
0
$0
2
$54,390
0
$0
0
$0
Aggregated Statistics For Year 1999 (Based on 1 partial tract)
A) FHA, FSA/RHS & VA Home Purchase Loans
B) Conventional Home Purchase Loans
C) Refinancings
D) Home Improvement Loans
F) Non-occupant Loans on < 5 Family Dwellings (A B C & D)
Detailed PMIC statistics for the following Tracts:0102.00
2002 - 2017 National Fire Incident Reporting System (NFIRS) incidents
Based on the data from the years 2002 - 2017 the average number of fire incidents per year is 9. The highest number of fires - 24 took place in 2010, and the least - 0 in 2013. The data has a growing trend.
When looking into fire subcategories, the most incidents belonged to: Outside Fires (51.3%), and Structure Fires (29.3%).
Fire incident types reported to NFIRS in Zip Code 57018


+$2,349
-$429
(% of AGI for various income ranges: 5.0% for AGIs below $10k, 1.7% for AGIs $10k-25k, 3.7% for AGIs $25k-50k, 0.0% for AGIs $50k-75k, -1.6% for AGIs over 100k) Nearest zip codes: 57016, 57041, 57033, 57035, 57020, 57075.


 Based on the data from the years 2002 - 2017 the average number of fire incidents per year is 9. The highest number of fires - 24 took place in 2010, and the least - 0 in 2013. The data has a growing trend.
 When looking into fire subcategories, the most incidents belonged to: Outside Fires (51.3%), and Structure Fires (29.3%).