Estimated zip code population in 2022: 1,570 Zip code population in 2010: 1,378 Zip code population in 2000: 1,564
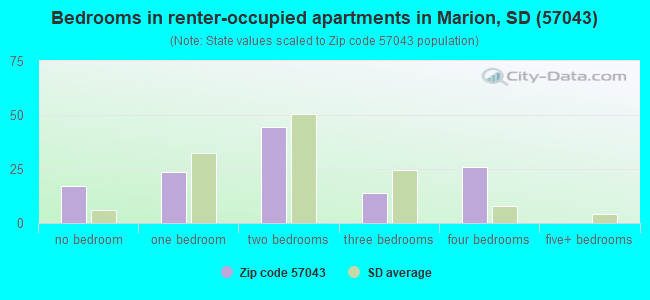
Houses and condos: 700 Renter-occupied apartments: 127
% of renters here:
19%
State:
30%
March 2022 cost of living index in zip code 57043: 77.6 (low, U.S. average is 100)
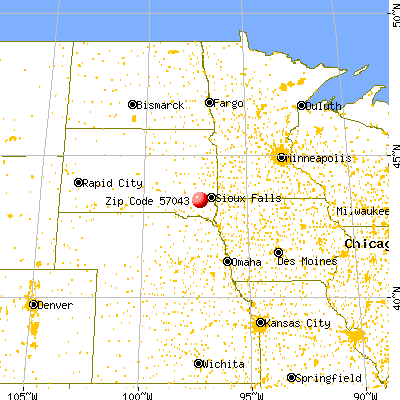
Land area: 109.2 sq. mi. Water area: 0.0 sq. mi.
Population density: 14 people per square mile
(very low).
OSM Map
General Map
Google Map
MSN Map
OSM Map
General Map
Google Map
MSN Map
OSM Map
General Map
Google Map
MSN Map
OSM Map
General Map
Google Map
MSN Map
Please wait while loading the map...
Real estate property taxes paid for housing units in 2022:
This zip code:
0.9% ($1,836)
South Dakota:
1.0% ($2,481)
Median real estate property taxes paid for housing units with mortgages in 2022: $1,790 (0.8%) Median real estate property taxes paid for housing units with no mortgage in 2022: $1,922 (1.0%)
Business Search- 14 Million verified businesses
Males: 789
(50.3%)
Females: 781
(49.7%)
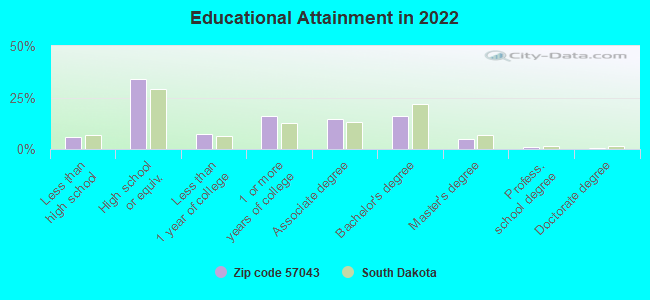
For population 25 years and over in 57043:
High school or higher: 93.2%
Bachelor's degree or higher: 22.2%
Graduate or professional degree: 6.4%
Unemployed: 1.2%
Mean travel time to work (commute): 25.4 minutes
For population 15 years and over in 57043:
Never married: 18.6%
Now married: 59.5%
Separated: 0.0%
Widowed: 12.9%
Divorced: 9.0%
Zip code 57043 compared to state average:
Unemployed percentage below state average.
Black race population percentage significantly below state average.
Hispanic race population percentage significantly below state average.
Median age significantly above state average.
Foreign-born population percentage significantly below state average.
Estimated median house/condo value in 2022: $207,497
57043:
$207,497
South Dakota:
$245,000
According to our research of South Dakota and other state lists, there was 1 registered sex offender living in 57043 zip code as of May 28, 2024. The ratio of all residents to sex offenders in zip code 57043 is 1,439 to 1. The ratio of registered sex offenders to all residents in this zip code is much lower than the state average.
Median resident age:
This zip code:
51.9 years
South Dakota median age:
38.5 years
Average household size:
This zip code:
2.3 people
South Dakota:
2.4 people
Averages for the 2020 tax year for zip code 57043, filed in 2021:
Average Adjusted Gross Income (AGI) in 2020: $67,016 (Individual Income Tax Returns)
Here:
$67,016
State:
$75,230
Salary/wage: $48,871 (reported on 82.5% of returns)
Here:
$48,871
State:
$54,824
(% of AGI for various income ranges: 1464.0% for AGIs below $25k, 3539.2% for AGIs $25k-50k, 6128.6% for AGIs $50k-75k, 9878.3% for AGIs $75k-100k, 23712.5% for AGIs $100k-200k)
Taxable interest for individuals: $1,624 (reported on 39.7% of returns)
This zip code:
$1,624
South Dakota:
$2,207
(% of AGI for various income ranges: 22.0% for AGIs below $25k, 58.3% for AGIs $25k-50k, 38.6% for AGIs $50k-75k, 145.0% for AGIs $75k-100k, 437.5% for AGIs $100k-200k)
Ordinary dividends: $4,421 (reported on 22.2% of returns)
Here:
$4,421
State:
$6,303
(% of AGI for various income ranges: 18.0% for AGIs below $25k, 31.7% for AGIs $25k-50k, 62.9% for AGIs $50k-75k, 130.0% for AGIs $75k-100k, 1102.5% for AGIs $100k-200k)
Net capital gain/loss in AGI: +$12,200 (reported on 22.2% of returns)
Here:
+$12,200
State:
+$27,098
(% of AGI for various income ranges: 62.0% for AGIs below $25k, 105.7% for AGIs $50k-75k, 355.0% for AGIs $75k-100k, 3397.5% for AGIs $100k-200k)
Profit/loss from business: +$9,850 (reported on 15.9% of returns)
Here:
+$9,850
State:
+$13,092
(% of AGI for various income ranges: 210.0% for AGIs below $25k, 707.1% for AGIs $50k-75k, 700.0% for AGIs $100k-200k)
Taxable individual retirement arrangement distribution: $8,388 (reported on 12.7% of returns)
57043:
$8,388
South Dakota:
$17,605
(% of AGI for various income ranges: 329.2% for AGIs $25k-50k, 460.0% for AGIs $75k-100k)
Total itemized deductions: $42,233 (reported on 4.8% of returns)
Here:
$42,233
State:
$43,941
(% of AGI for various income ranges: 1810.0% for AGIs $50k-75k)
Charity contributions: $10,950 (reported on 3.2% of returns)
Here:
$10,950
State:
$21,682
(% of AGI for various income ranges: 219.0% for AGIs below $25k)
Taxes paid: $3,267 (reported on 4.8% of returns)
57043:
$3,267
State:
$6,525
(% of AGI for various income ranges: 140.0% for AGIs $50k-75k)
Earned income credit: $1,886 (reported on 11.1% of returns)
Here:
$1,886
State:
$2,165
(% of AGI for various income ranges: 67.0% for AGIs below $25k, 54.2% for AGIs $25k-50k)
Percentage of individuals using paid preparers for their 2020 taxes: 96.8%
Here:
97%
State:
95%
(% for various income ranges: 94.1% for AGIs below $25k, 100.0% for AGIs $25k-50k, 90.9% for AGIs $50k-75k, 100.0% for AGIs $75k-100k, 100.0% for AGIs $100k-200k, 100.0% for AGIs over 200k)
Averages for the 2012 tax year for zip code 57043, filed in 2013:
Average Adjusted Gross Income (AGI) in 2012: $52,801 (Individual Income Tax Returns)
Here:
$52,801
State:
$58,425
Salary/wage: $38,498 (reported on 77.9% of returns)
Here:
$38,498
State:
$41,676
(% of AGI for various income ranges: 65.9% for AGIs below $25k, 72.8% for AGIs $25k-50k, 65.2% for AGIs $50k-75k, 70.5% for AGIs $75k-100k, 37.5% for AGIs $100k-200k)
Taxable interest for individuals: $1,487 (reported on 45.6% of returns)
This zip code:
$1,487
South Dakota:
$2,148
(% of AGI for various income ranges: 3.7% for AGIs below $25k, 1.2% for AGIs $25k-50k, 0.6% for AGIs $50k-75k, 0.6% for AGIs $75k-100k, 1.5% for AGIs $100k-200k)
Ordinary dividends: $2,982 (reported on 25.0% of returns)
Here:
$2,982
State:
$6,197
(% of AGI for various income ranges: 1.9% for AGIs below $25k, 2.4% for AGIs $25k-50k, 0.5% for AGIs $50k-75k, 0.5% for AGIs $75k-100k, 1.8% for AGIs $100k-200k)
Net capital gain/loss in AGI: +$16,565 (reported on 25.0% of returns)
Here:
+$16,565
State:
+$21,273
(% of AGI for various income ranges: 1.3% for AGIs $25k-50k, 3.4% for AGIs $50k-75k, 0.5% for AGIs $75k-100k, 18.1% for AGIs $100k-200k)
Profit/loss from business: +$7,307 (reported on 20.6% of returns)
Here:
+$7,307
State:
+$11,552
(% of AGI for various income ranges: 8.1% for AGIs below $25k, 2.2% for AGIs $25k-50k, 5.9% for AGIs $50k-75k, 3.7% for AGIs $75k-100k)
Taxable individual retirement arrangement distribution: $7,467 (reported on 13.2% of returns)
57043:
$7,467
South Dakota:
$12,416
(% of AGI for various income ranges: 8.7% for AGIs below $25k, 2.5% for AGIs $50k-75k, 4.0% for AGIs $75k-100k)
Total itemized deductions: $19,623 (24% of AGI, reported on 19.1% of returns)
Here:
$19,623
State:
$21,763
Here:
24.2% of AGI
State:
16.0% of AGI
(% of AGI for various income ranges: 18.6% for AGIs below $25k, 10.7% for AGIs $25k-50k, 12.9% for AGIs $50k-75k, 3.3% for AGIs $100k-200k)
Charity contributions: $5,100 (reported on 14.7% of returns)
Here:
$5,100
State:
$5,927
(% of AGI for various income ranges: 2.2% for AGIs $25k-50k, 2.5% for AGIs $50k-75k, 1.4% for AGIs $100k-200k)
Taxes paid: $2,685 (reported on 19.1% of returns)
57043:
$2,685
State:
$5,214
(% of AGI for various income ranges: 2.1% for AGIs below $25k, 0.7% for AGIs $25k-50k, 1.9% for AGIs $50k-75k, 0.8% for AGIs $100k-200k)
Earned income credit: $1,957 (reported on 10.3% of returns)
Here:
$1,957
State:
$2,081
(% of AGI for various income ranges: 3.2% for AGIs below $25k, 0.8% for AGIs $25k-50k)
Percentage of individuals using paid preparers for their 2012 taxes: 67.6%
Here:
68%
State:
55%
(% for various income ranges: 60.0% for AGIs below $25k, 62.5% for AGIs $25k-50k, 66.7% for AGIs $50k-75k, 85.7% for AGIs $75k-100k, 87.5% for AGIs $100k-200k)
Averages for the 2004 tax year for zip code 57043, filed in 2005:
Average Adjusted Gross Income (AGI) in 2004: $32,219 (Individual Income Tax Returns)
Here:
$32,219
State:
$41,242
Salary/wage: $28,649 (reported on 79.5% of returns)
Here:
$28,649
State:
$32,969
(% of AGI for various income ranges: 164.6% for AGIs below $10k, 56.8% for AGIs $10k-25k, 73.6% for AGIs $25k-50k, 76.3% for AGIs $50k-75k, 59.5% for AGIs $75k-100k, 66.6% for AGIs over 100k)
Taxable interest for individuals: $1,618 (reported on 58.4% of returns)
This zip code:
$1,618
South Dakota:
$2,098
(% of AGI for various income ranges: 18.2% for AGIs below $10k, 5.6% for AGIs $10k-25k, 2.6% for AGIs $25k-50k, 2.4% for AGIs $50k-75k, 2.3% for AGIs $75k-100k, 0.5% for AGIs over 100k)
Taxable dividends: $1,310 (reported on 29.0% of returns)
Here:
$1,310
State:
$2,577
(% of AGI for various income ranges: 6.1% for AGIs below $10k, 2.5% for AGIs $10k-25k, 1.5% for AGIs $25k-50k, 0.6% for AGIs $50k-75k, 0.4% for AGIs $75k-100k, 0.2% for AGIs over 100k)
Net capital gain/loss: +$3,450 (reported on 27.0% of returns)
Here:
+$3,450
State:
+$11,418
(% of AGI for various income ranges: -4.0% for AGIs below $10k, 1.0% for AGIs $10k-25k, 3.7% for AGIs $25k-50k, 3.0% for AGIs $50k-75k, 3.5% for AGIs $75k-100k, 2.9% for AGIs over 100k)
Profit/loss from business: +$7,931 (reported on 18.7% of returns)
Here:
+$7,931
State:
+$9,138
(% of AGI for various income ranges: 4.7% for AGIs below $10k, 8.1% for AGIs $10k-25k, 4.8% for AGIs $25k-50k, 1.6% for AGIs $50k-75k, 10.2% for AGIs $75k-100k)
Profit/loss from farming: +$4,939 (reported on 18.9% of returns)
Here:
+$4,939
State:
-$429
(% of AGI for various income ranges: 17.9% for AGIs below $10k, 2.7% for AGIs $10k-25k, 0.3% for AGIs $25k-50k, 2.9% for AGIs $50k-75k, 8.7% for AGIs $75k-100k)
IRA payment deduction: $3,545 (reported on 3.1% of returns)
57043:
$3,545
South Dakota:
$3,029
Total itemized deductions: $16,394 (34% of AGI, reported on 13.4% of returns)
Here:
$16,394
State:
$17,139
Here:
33.8% of AGI
State:
19.0% of AGI
(% of AGI for various income ranges: 17.4% for AGIs $10k-25k, 5.8% for AGIs $25k-50k, 6.6% for AGIs $50k-75k, 8.2% for AGIs over 100k)
Charity contributions deductions: $3,257 (6% of AGI, reported on 10.6% of returns)
Here:
$3,257
State:
$4,114
Here:
6.3% of AGI
State:
4.2% of AGI
(% of AGI for various income ranges: 1.8% for AGIs $10k-25k, 0.9% for AGIs $25k-50k, 0.9% for AGIs $50k-75k, 2.5% for AGIs over 100k)
Total tax: $3,837 (reported on 76.3% of returns)
57043:
$3,837
State:
$6,372
(% of AGI for various income ranges: 11.1% for AGIs below $10k, 5.5% for AGIs $10k-25k, 6.7% for AGIs $25k-50k, 8.4% for AGIs $50k-75k, 11.8% for AGIs $75k-100k, 16.3% for AGIs over 100k)
Earned income credit: $1,915 (reported on 8.4% of returns)
Here:
$1,915
State:
$1,607
Percentage of individuals using paid preparers for their 2004 taxes: 69.5%
Here:
70%
State:
63%
(% for various income ranges: 60.5% for AGIs below $10k, 73.3% for AGIs $10k-25k, 70.4% for AGIs $25k-50k, 69.7% for AGIs $50k-75k, 80.5% for AGIs $75k-100k, 85.0% for AGIs over 100k)
Household received Food Stamps/SNAP in the past 12 months: 16 Household did not receive Food Stamps/SNAP in the past 12 months: 640
Women who had a birth in the past 12 months: 22 (5 now married, 19 unmarried) Women who did not have a birth in the past 12 months: 181 (125 now married, 58 unmarried)
Housing units in zip code 57043 with a mortgage: 226 (11 second mortgage, 12 both second mortgage and home equity loan) Median monthly owner costs for units with a mortgage: $1,331 Median monthly owner costs for units without a mortgage: $593
Residents with income below the poverty level in 2022:
This zip code:
9.3%
Whole state:
12.5%
Residents with income below 50% of the poverty level in 2022:
This zip code:
7.4%
Whole state:
6.8%
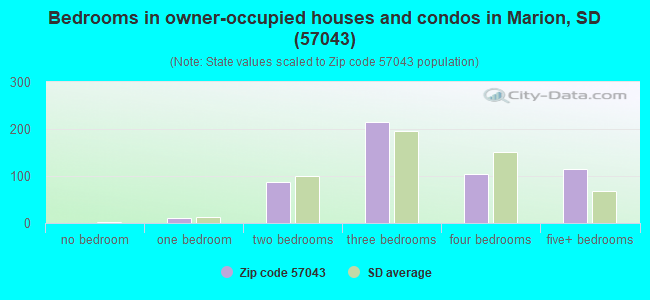
Median number of rooms in houses and condos:
Here:
7.1
State:
7.0
Median number of rooms in apartments:
Here:
4.2
State:
4.1
Notable locations in this zip code not listed on our city pages
Notable locations in zip code 57043: Marion Fire Department (A), Marion City Office (B), Marion Community Ambulance Service (C). Display/hide their locations on the map
Cemeteries: West Vermillion Cemetery (1), Tieszen Cemetery (2), Dicks Cemetery (3), Greenwood Cemetery (4), Schartner Cemetery (5), Salem Cemetery (6), Saint Marys Cemetery (7). Display/hide their locations on the map
In group quarters: 73 (-1 institutionalized population)
Size of family households: 194 2-persons, 85 3-persons, 72 4-persons, 31 5-persons, 17 6-persons, 4 7-or-more-persons
Size of nonfamily households: 216 1-person, 16 2-persons, 10 4-persons
274 married couples with children.
56 single-parent households (36 men, 20 women).
96.8% of residents of 57043 zip code speak English at home.
0.3% of residents speak Spanish at home (100% very well).
3.3% of residents speak other Indo-European language at home (90% very well, 10% well).
0.1% of residents speak other language at home (100% very well).
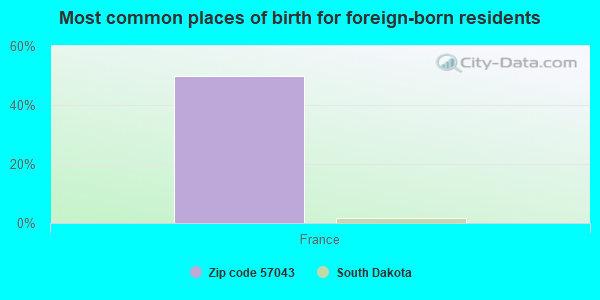
Foreign born population: 2 (0.1%) (100.0% of them are naturalized citizens)
This zip code:
0.1%
Whole state:
3.5%
50%France
64%German
11%American
7%Norwegian
6%Irish
2%Dutch
2%Czech
1%Danish
Year of entry for the foreign-born population
22010 or later
32000 to 2009
21990 to 1999
5Before 1990
Facilities with environmental interests located in this zip code:
MARION ELEM (100 S CEDAR in MARION, SD)
(National Center for Education Statistics) - STATE ID-2 Organizations: MARION SCHOOL DISTRICT 60-3 (SCHOOL DISTRICT)
MARION HI SCH (100 S CEDAR in MARION, SD)
(National Center for Education Statistics) - STATE ID-1 Organizations: MARION SCHOOL DISTRICT 60-3 (SCHOOL DISTRICT)
MARION JR HI (100 S CEDAR in MARION, SD)
(National Center for Education Statistics) - STATE ID-3 Organizations: MARION SCHOOL DISTRICT 60-3 (SCHOOL DISTRICT)
MARION - CITY OF (NW1/4,SEC.33,T100N,R54W. in MARION, SD)
National Pollutant Discharge Elimination System NON-MAJOR (Tracking pollutant discharge elimination systems) - permit Business SIC classification: SEWERAGE SYSTEMS
MARION SCHOOL DISTRICT 60-3 (175 SOUTH CEDAR STREET in MARION, SD)
COMPLIANCE ACTIVITY (Tracking inspections of insecticide, fungicide, and rodenticide, and toxic substances) Alternative names: MARION SCHOOL DIST 60-3
MILLENNIUM ETHANOL (PO BOX 357 in MARION, SD)
AIR SYNTHETIC MINOR (AIRS/AFS) Business SIC classification: INDUSTRIAL ORGANIC CHEMICALS
WIEMAN MACHINERY AUCTION (44628 SD HIGHWAY 44 in MARION, SD)
ENFORCEMENT/COMPLIANCE ACTIVITY (Integrated Compliance Information System)
Housing units lacking complete plumbing facilities: 3.2% Housing units lacking complete kitchen facilities: 4.1%
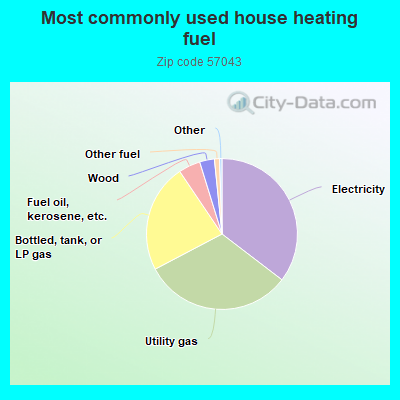
35.6%Electricity
32.1%Utility gas
23.4%Bottled, tank, or LP gas
4.7%Fuel oil, kerosene, etc.
3.2%Wood
1.1%Other fuel
Population in 1990: 1,377. Population change in the 1990s: +187 (+13.6%).
Place of birth for U.S.-born residents:
This state: 1,165
Northeast: 12
Midwest: 174
South: 75
West: 128
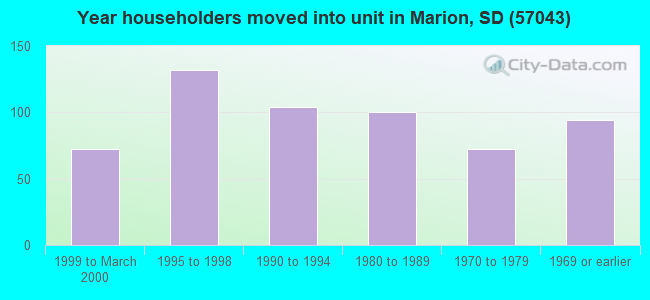
65% of the 57043 zip code residents lived in the same house 5 years ago. Out of people who lived in different houses, 47% lived in this county. Out of people who lived in different counties, 50% lived in South Dakota.
90% of the 57043 zip code residents lived in the same house 1 year ago. Out of people who lived in different houses, 21% moved from this county. Out of people who lived in different houses, 50% moved from different county within same state. Out of people who lived in different houses, 24% moved from different state.
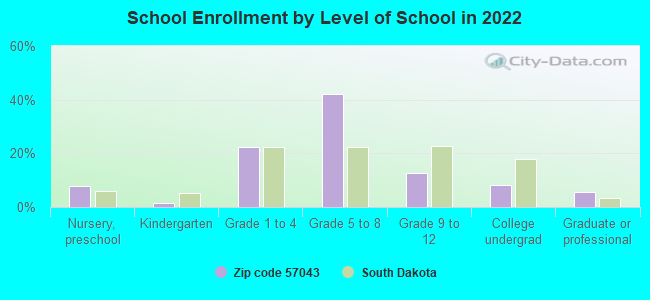
Private vs. public school enrollment:
Students in private schools in grades 1 to 8 (elementary and middle school): 13
Here:
7.1%
South Dakota:
11.9%
Students in private schools in grades 9 to 12 (high school): 2
Here:
6.5%
South Dakota:
7.2%
Students in private undergraduate colleges: 1
Here:
7.0%
South Dakota:
10.2%
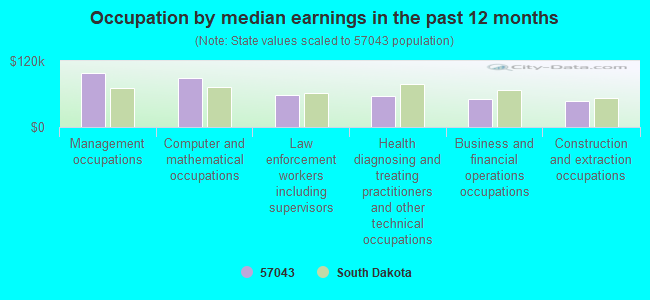
Occupation by median earnings in the past 12 months ($)
99,061Management occupations
89,367Computer and mathematical occupations
57,813Law enforcement workers including supervisors
57,193Health diagnosing and treating practitioners and other technical occupations
51,443Business and financial operations occupations
47,910Construction and extraction occupations
Top industries in this zip code by the number of employees in 2005:
Health Care and Social Assistance: Nursing Care Facilities (100-249 employees: 1 establishment)
Utilities: Electric Power Distribution (10-19: 1, 1-4: 2)
Finance and Insurance: Commercial Banking (10-19: 1)
Real Estate and Rental and Leasing: Offices of Real Estate Agents and Brokers (10-19: 1)
Administrative and Support and Waste Management and Remediation Services: Professional Employer Organizations (10-19: 1)
Other Services (except Public Administration): Religious Organizations (1-4: 6)
People in group quarters in 2010:
51 people in nursing facilities/skilled-nursing facilities
People in group quarters in 2000:
57 people in nursing homes
Fatal accident statistics in 2014:
Fatal accident count: 1
Vehicles involved in fatal accidents: 1
Fatal accidents caused by drunken drivers: 0
Fatalities: 2
Persons involved in fatal accidents: 2
Pedestrians involved in fatal accidents: 0
2002 - 2018 National Fire Incident Reporting System (NFIRS) incidents
Based on the data from the years 2002 - 2018 the average number of fire incidents per year is 7. The highest number of fires - 15 took place in 2017, and the least - 0 in 2003. The data has a growing trend.
When looking into fire subcategories, the most reports belonged to: Outside Fires (54.3%), and Structure Fires (24.1%).
Fire incident types reported to NFIRS in Zip Code 57043


+$4,939
-$429
(% of AGI for various income ranges: 17.9% for AGIs below $10k, 2.7% for AGIs $10k-25k, 0.3% for AGIs $25k-50k, 2.9% for AGIs $50k-75k, 8.7% for AGIs $75k-100k)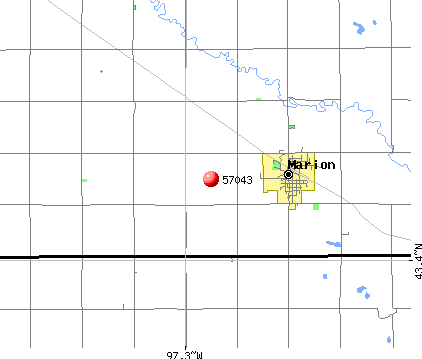 Nearest zip codes: 57047, 57053, 57012, 57029, 57319, 57036.


 Based on the data from the years 2002 - 2018 the average number of fire incidents per year is 7. The highest number of fires - 15 took place in 2017, and the least - 0 in 2003. The data has a growing trend.
 When looking into fire subcategories, the most reports belonged to: Outside Fires (54.3%), and Structure Fires (24.1%).