Estimated zip code population in 2022: 2,129 Zip code population in 2010: 2,062 Zip code population in 2000: 2,002
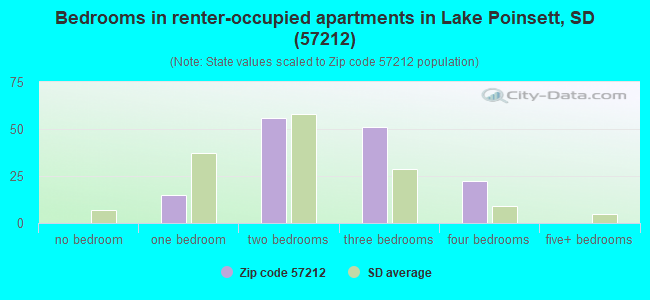
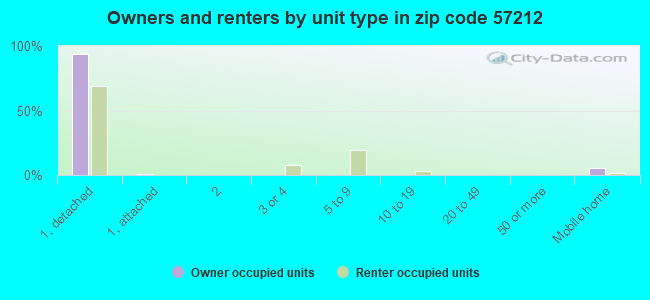
Houses and condos: 1,086 Renter-occupied apartments: 148
% of renters here:
18%
State:
30%
March 2022 cost of living index in zip code 57212: 77.9 (low, U.S. average is 100)
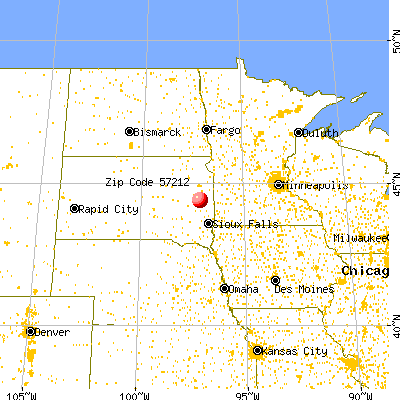
Land area: 228.0 sq. mi. Water area: 10.5 sq. mi.
Population density: 9 people per square mile
(very low).
OSM Map
General Map
Google Map
MSN Map
OSM Map
General Map
Google Map
MSN Map
OSM Map
General Map
Google Map
MSN Map
OSM Map
General Map
Google Map
MSN Map
Please wait while loading the map...
Real estate property taxes paid for housing units in 2022:
This zip code:
0.8% ($2,068)
South Dakota:
1.0% ($2,481)
Median real estate property taxes paid for housing units with mortgages in 2022: $1,969 (0.7%) Median real estate property taxes paid for housing units with no mortgage in 2022: $2,158 (0.9%)
Business Search- 14 Million verified businesses
Males: 1,054
(49.5%)
Females: 1,074
(50.5%)
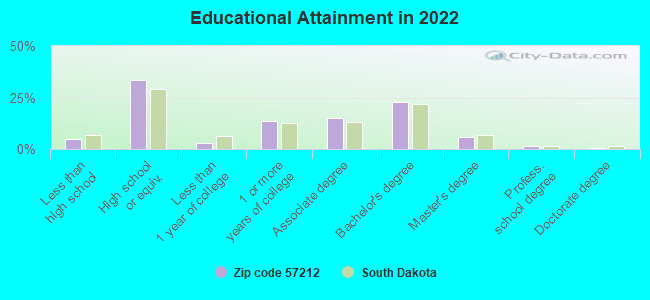
For population 25 years and over in 57212:
High school or higher: 95.1%
Bachelor's degree or higher: 30.5%
Graduate or professional degree: 7.9%
Unemployed: 2.1%
Mean travel time to work (commute): 23.6 minutes
For population 15 years and over in 57212:
Never married: 16.3%
Now married: 68.6%
Separated: 2.4%
Widowed: 4.8%
Divorced: 7.9%
Zip code 57212 compared to state average:
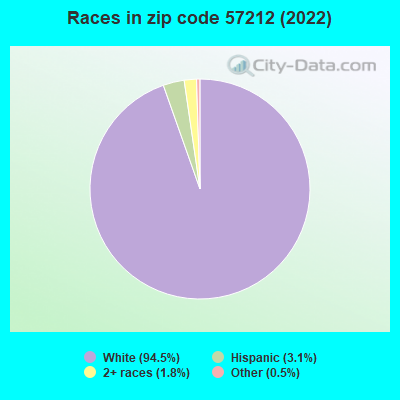
Black race population percentage significantly below state average.
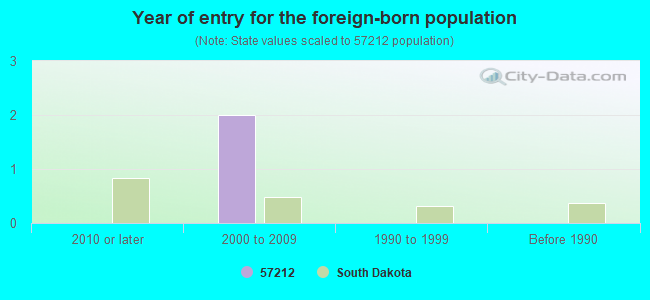
Foreign-born population percentage significantly below state average.
Renting percentage below state average.
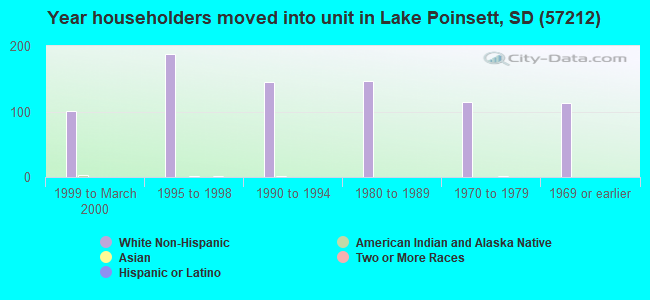
Length of stay since moving in significantly above state average.
Estimated median house/condo value in 2022: $262,859
57212:
$262,859
South Dakota:
$245,000
According to our research of South Dakota and other state lists, there were 3 registered sex offenders living in 57212 zip code as of May 28, 2024. The ratio of all residents to sex offenders in zip code 57212 is 631 to 1. The ratio of registered sex offenders to all residents in this zip code is much lower than the state average.
Median resident age:
This zip code:
41.7 years
South Dakota median age:
38.5 years
Average household size:
This zip code:
2.4 people
South Dakota:
2.4 people
Averages for the 2020 tax year for zip code 57212, filed in 2021:
Average Adjusted Gross Income (AGI) in 2020: $71,278 (Individual Income Tax Returns)
Here:
$71,278
State:
$75,230
Salary/wage: $51,785 (reported on 82.1% of returns)
Here:
$51,785
State:
$54,824
(% of AGI for various income ranges: 1522.6% for AGIs below $25k, 4030.5% for AGIs $25k-50k, 6309.2% for AGIs $50k-75k, 8932.5% for AGIs $75k-100k, 15295.5% for AGIs $100k-200k)
Taxable interest for individuals: $2,107 (reported on 37.5% of returns)
This zip code:
$2,107
South Dakota:
$2,207
(% of AGI for various income ranges: 13.2% for AGIs below $25k, 20.5% for AGIs $25k-50k, 45.8% for AGIs $50k-75k, 155.0% for AGIs $75k-100k, 260.9% for AGIs $100k-200k)
Ordinary dividends: $3,761 (reported on 25.0% of returns)
Here:
$3,761
State:
$6,303
(% of AGI for various income ranges: 7.9% for AGIs below $25k, 15.0% for AGIs $25k-50k, 56.7% for AGIs $50k-75k, 173.8% for AGIs $75k-100k, 243.6% for AGIs $100k-200k)
Net capital gain/loss in AGI: +$17,712 (reported on 21.4% of returns)
Here:
+$17,712
State:
+$27,098
(% of AGI for various income ranges: 11.1% for AGIs below $25k, 19.1% for AGIs $25k-50k, 77.5% for AGIs $50k-75k, 228.8% for AGIs $75k-100k, 672.7% for AGIs $100k-200k)
Profit/loss from business: +$8,450 (reported on 16.1% of returns)
Here:
+$8,450
State:
+$13,092
(% of AGI for various income ranges: 96.8% for AGIs below $25k, 129.1% for AGIs $25k-50k, 328.3% for AGIs $50k-75k, 230.0% for AGIs $75k-100k, 431.8% for AGIs $100k-200k)
Taxable individual retirement arrangement distribution: $12,340 (reported on 8.9% of returns)
57212:
$12,340
South Dakota:
$17,605
(% of AGI for various income ranges: 125.9% for AGIs $25k-50k, 454.2% for AGIs $50k-75k, 374.5% for AGIs $100k-200k)
Total itemized deductions: $31,433 (reported on 2.7% of returns)
Here:
$31,433
State:
$43,941
(% of AGI for various income ranges: 1178.8% for AGIs $75k-100k)
Taxes paid: $4,700 (reported on 2.7% of returns)
57212:
$4,700
State:
$6,525
(% of AGI for various income ranges: 176.2% for AGIs $75k-100k)
Earned income credit: $1,460 (reported on 8.9% of returns)
Here:
$1,460
State:
$2,165
(% of AGI for various income ranges: 37.9% for AGIs below $25k, 33.6% for AGIs $25k-50k)
Percentage of individuals using paid preparers for their 2020 taxes: 92.0%
Here:
92%
State:
95%
(% for various income ranges: 87.1% for AGIs below $25k, 92.9% for AGIs $25k-50k, 94.1% for AGIs $50k-75k, 92.3% for AGIs $75k-100k, 94.7% for AGIs $100k-200k, 100.0% for AGIs over 200k)
Averages for the 2012 tax year for zip code 57212, filed in 2013:
Average Adjusted Gross Income (AGI) in 2012: $61,425 (Individual Income Tax Returns)
Here:
$61,425
State:
$58,425
Salary/wage: $36,867 (reported on 83.3% of returns)
Here:
$36,867
State:
$41,676
(% of AGI for various income ranges: 74.3% for AGIs below $25k, 76.2% for AGIs $25k-50k, 73.8% for AGIs $50k-75k, 63.4% for AGIs $75k-100k, 63.5% for AGIs $100k-200k)
Taxable interest for individuals: $3,050 (reported on 39.2% of returns)
This zip code:
$3,050
South Dakota:
$2,148
(% of AGI for various income ranges: 2.2% for AGIs below $25k, 1.3% for AGIs $25k-50k, 1.9% for AGIs $50k-75k, 1.2% for AGIs $75k-100k, 3.8% for AGIs $100k-200k, 1.4% for AGIs over 200k)
Ordinary dividends: $3,050 (reported on 25.5% of returns)
Here:
$3,050
State:
$6,197
(% of AGI for various income ranges: 4.7% for AGIs below $25k, 1.5% for AGIs $25k-50k, 0.9% for AGIs $50k-75k, 1.6% for AGIs $75k-100k, 1.7% for AGIs $100k-200k)
Net capital gain/loss in AGI: +$26,940 (reported on 19.6% of returns)
Here:
+$26,940
State:
+$21,273
(% of AGI for various income ranges: 2.2% for AGIs below $25k, 1.2% for AGIs $50k-75k, 1.4% for AGIs $75k-100k, 5.5% for AGIs $100k-200k, 25.1% for AGIs over 200k)
Profit/loss from business: +$8,510 (reported on 19.6% of returns)
Here:
+$8,510
State:
+$11,552
(% of AGI for various income ranges: 6.1% for AGIs below $25k, 4.5% for AGIs $25k-50k, 3.8% for AGIs $50k-75k, 1.8% for AGIs $75k-100k, 4.0% for AGIs $100k-200k)
Taxable individual retirement arrangement distribution: $9,091 (reported on 10.8% of returns)
57212:
$9,091
South Dakota:
$12,416
(% of AGI for various income ranges: 2.3% for AGIs below $25k, 1.7% for AGIs $25k-50k, 2.3% for AGIs $50k-75k, 5.0% for AGIs $75k-100k)
Total itemized deductions: $18,188 (16% of AGI, reported on 16.7% of returns)
Here:
$18,188
State:
$21,763
Here:
15.8% of AGI
State:
16.0% of AGI
(% of AGI for various income ranges: 7.2% for AGIs below $25k, 6.2% for AGIs $25k-50k, 5.9% for AGIs $50k-75k, 3.9% for AGIs $75k-100k, 10.8% for AGIs $100k-200k)
Charity contributions: $2,755 (reported on 10.8% of returns)
Here:
$2,755
State:
$5,927
(% of AGI for various income ranges: 0.9% for AGIs below $25k, 0.8% for AGIs $50k-75k, 1.6% for AGIs $100k-200k)
Taxes paid: $4,000 (reported on 15.7% of returns)
57212:
$4,000
State:
$5,214
(% of AGI for various income ranges: 0.9% for AGIs below $25k, 1.4% for AGIs $25k-50k, 1.1% for AGIs $50k-75k, 0.7% for AGIs $75k-100k, 2.6% for AGIs $100k-200k)
Earned income credit: $2,167 (reported on 11.8% of returns)
Here:
$2,167
State:
$2,081
(% of AGI for various income ranges: 3.7% for AGIs below $25k, 0.9% for AGIs $25k-50k)
Percentage of individuals using paid preparers for their 2012 taxes: 71.6%
Here:
72%
State:
55%
(% for various income ranges: 60.5% for AGIs below $25k, 70.8% for AGIs $25k-50k, 76.5% for AGIs $50k-75k, 83.3% for AGIs $75k-100k, 87.5% for AGIs $100k-200k, 100.0% for AGIs over 200k)
Averages for the 2004 tax year for zip code 57212, filed in 2005:
Average Adjusted Gross Income (AGI) in 2004: $36,323 (Individual Income Tax Returns)
Here:
$36,323
State:
$41,242
Salary/wage: $29,415 (reported on 80.6% of returns)
Here:
$29,415
State:
$32,969
(% of AGI for various income ranges: 104.4% for AGIs below $10k, 74.7% for AGIs $10k-25k, 75.4% for AGIs $25k-50k, 76.5% for AGIs $50k-75k, 65.4% for AGIs $75k-100k, 24.4% for AGIs over 100k)
Taxable interest for individuals: $2,151 (reported on 51.4% of returns)
This zip code:
$2,151
South Dakota:
$2,098
(% of AGI for various income ranges: 10.2% for AGIs below $10k, 5.7% for AGIs $10k-25k, 2.7% for AGIs $25k-50k, 2.2% for AGIs $50k-75k, 0.7% for AGIs $75k-100k, 3.8% for AGIs over 100k)
Taxable dividends: $1,076 (reported on 24.8% of returns)
Here:
$1,076
State:
$2,577
(% of AGI for various income ranges: 3.0% for AGIs below $10k, 1.7% for AGIs $10k-25k, 0.8% for AGIs $25k-50k, 0.4% for AGIs $50k-75k, 0.5% for AGIs $75k-100k, 0.2% for AGIs over 100k)
Net capital gain/loss: +$9,584 (reported on 25.1% of returns)
Here:
+$9,584
State:
+$11,418
(% of AGI for various income ranges: -3.7% for AGIs below $10k, 1.1% for AGIs $10k-25k, 1.7% for AGIs $25k-50k, 3.5% for AGIs $50k-75k, 3.4% for AGIs $75k-100k, 25.6% for AGIs over 100k)
Profit/loss from business: +$4,982 (reported on 18.2% of returns)
Here:
+$4,982
State:
+$9,138
(% of AGI for various income ranges: 4.1% for AGIs below $10k, 2.0% for AGIs $10k-25k, 5.2% for AGIs $25k-50k, 2.3% for AGIs $50k-75k, 1.3% for AGIs $75k-100k, -0.6% for AGIs over 100k)
Profit/loss from farming: +$4,877 (reported on 19.9% of returns)
Here:
+$4,877
State:
-$429
(% of AGI for various income ranges: -15.8% for AGIs below $10k, -0.3% for AGIs $10k-25k, 0.8% for AGIs $25k-50k, 1.8% for AGIs $50k-75k, 3.4% for AGIs $75k-100k, 10.3% for AGIs over 100k)
IRA payment deduction: $3,735 (reported on 3.8% of returns)
57212:
$3,735
South Dakota:
$3,029
Total itemized deductions: $16,670 (26% of AGI, reported on 10.1% of returns)
Here:
$16,670
State:
$17,139
Here:
26.5% of AGI
State:
19.0% of AGI
(% of AGI for various income ranges: 6.5% for AGIs $10k-25k, 5.6% for AGIs $25k-50k, 2.1% for AGIs $50k-75k, 6.8% for AGIs $75k-100k, 3.9% for AGIs over 100k)
Charity contributions deductions: $2,323 (3% of AGI, reported on 6.9% of returns)
Here:
$2,323
State:
$4,114
Here:
3.4% of AGI
State:
4.2% of AGI
(% of AGI for various income ranges: 0.4% for AGIs $10k-25k, 0.3% for AGIs $25k-50k, 1.3% for AGIs $75k-100k, 0.7% for AGIs over 100k)
Total tax: $4,759 (reported on 76.7% of returns)
57212:
$4,759
State:
$6,372
(% of AGI for various income ranges: 3.2% for AGIs below $10k, 4.5% for AGIs $10k-25k, 7.7% for AGIs $25k-50k, 8.0% for AGIs $50k-75k, 11.5% for AGIs $75k-100k, 19.6% for AGIs over 100k)
Earned income credit: $1,400 (reported on 10.0% of returns)
Here:
$1,400
State:
$1,607
Percentage of individuals using paid preparers for their 2004 taxes: 71.9%
Here:
72%
State:
63%
(% for various income ranges: 66.1% for AGIs below $10k, 66.1% for AGIs $10k-25k, 75.8% for AGIs $25k-50k, 70.0% for AGIs $50k-75k, 83.3% for AGIs $75k-100k, 97.3% for AGIs over 100k)
Household received Food Stamps/SNAP in the past 12 months: 20 Household did not receive Food Stamps/SNAP in the past 12 months: 818
Women who had a birth in the past 12 months: 56 (52 now married, 0 unmarried) Women who did not have a birth in the past 12 months: 338 (212 now married, 129 unmarried)
Housing units in zip code 57212 with a mortgage: 317 (68 second mortgage, 37 home equity loan, 24 both second mortgage and home equity loan) Median monthly owner costs for units with a mortgage: $1,528 Median monthly owner costs for units without a mortgage: $632
Residents with income below the poverty level in 2022:
This zip code:
7.2%
Whole state:
12.5%
Residents with income below 50% of the poverty level in 2022:
This zip code:
4.3%
Whole state:
6.8%
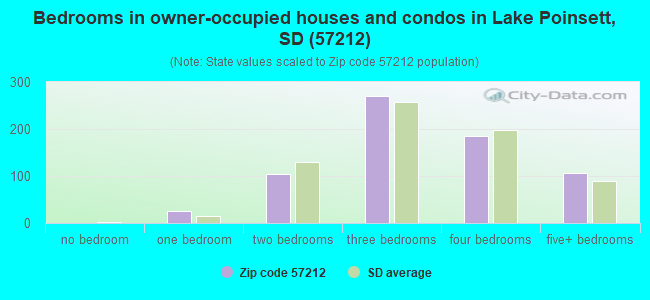
Median number of rooms in houses and condos:
Here:
7.2
State:
7.0
Median number of rooms in apartments:
Here:
5.5
State:
4.1
Notable locations in this zip code not listed on our city pages
Notable locations in zip code 57212: Arlington Fire Department (A), Badger Volunteer Fire Department (B), Arlington City Hall (C), Arlington Community Library (D), Arlington Ambulance Service (E). Display/hide their locations on the map
Cemeteries: Arlington Cemetery (1), Bangor Cemetery (2), Trasta Cemetery (3), Bethel Cemetery (4), United Cemetery (5), Nielsen Cemetery (6), Hetland Cemetery (7). Display/hide their locations on the map
Lakes: Lake Mitchell (A), Lake Sinai (B), Lake Albert (C), Twin Lakes (D), Lake Badger (E), Brush Lake (F), Lake Thisted (G). Display/hide their locations on the map
CITY OF ARLINGTON (1/2 MILE EAST OF CITY in ARLINGTON, SD)
National Pollutant Discharge Elimination System NON-MAJOR (Tracking pollutant discharge elimination systems) - permit Business SIC classification: SEWERAGE SYSTEMS Alternative names: ARLINGTON - CITY OF, ARLINGTON WWT FACILITY, CITY OF ALINGTON
LAKE POINSETT SANITARY DIST (ARLINGTON BEACH; STONE BRIDGE; in ARLINGTON, SD)
National Pollutant Discharge Elimination System NON-MAJOR (Tracking pollutant discharge elimination systems) - permit Business SIC classification: SEWERAGE SYSTEMS
ARLINGTON SCHOOL DISTRICT 38-1 (306 SOUTH MAIN STREET in ARLINGTON, SD)
ENFORCEMENT/COMPLIANCE ACTIVITY (Integrated Compliance Information System) COMPLIANCE ACTIVITY (Tracking inspections of insecticide, fungicide, and rodenticide, and toxic substances) Alternative names: ARLINGTON SCHOOL DISTRICT # 38-1
TRIANGLE TEXACO (HWY 81 & N. MAIN in ARLINGTON, SD)
Small Quantity Generators, between 100 kg and 1000 kg of hazardous waste/month (Resource Conservation and Recovery Act (tracking hazardous waste)) - notification Organizations: REX AND MARION PARKER (CONTACT/OWNER)
Housing units lacking complete plumbing facilities: 2.6% Housing units lacking complete kitchen facilities: 3.4%
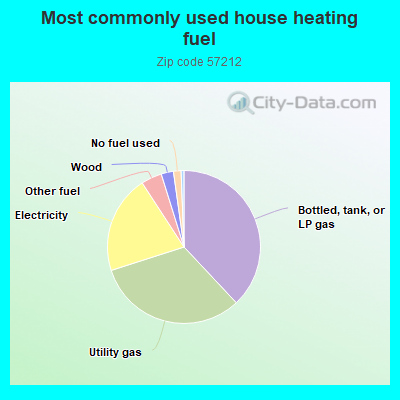
38.1%Bottled, tank, or LP gas
32.1%Utility gas
20.8%Electricity
4.4%Other fuel
2.6%Wood
1.6%No fuel used
0.6%Fuel oil, kerosene, etc.
Population in 1990: 358. Population change in the 1990s: +1,644 (+459.2%).
Place of birth for U.S.-born residents:
This state: 1,441
Northeast: 8
Midwest: 483
South: 31
West: 158
64% of the 57212 zip code residents lived in the same house 5 years ago. Out of people who lived in different houses, 44% lived in this county. Out of people who lived in different counties, 50% lived in South Dakota.
91% of the 57212 zip code residents lived in the same house 1 year ago. Out of people who lived in different houses, 47% moved from this county. Out of people who lived in different houses, 34% moved from different county within same state. Out of people who lived in different houses, 13% moved from different state. Out of people who lived in different houses, 4% moved from abroad.
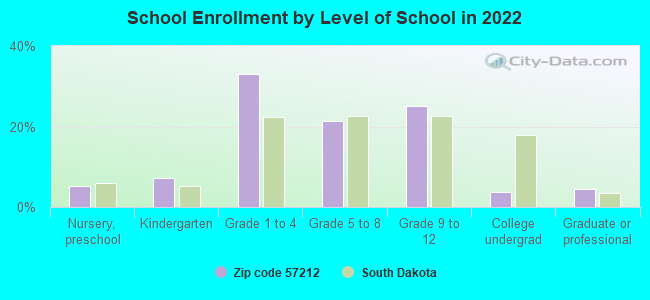
Private vs. public school enrollment:
Students in private schools in grades 1 to 8 (elementary and middle school): 9
Here:
3.8%
South Dakota:
11.9%
Students in private schools in grades 9 to 12 (high school):
Here:
0.0%
South Dakota:
7.2%
Students in private undergraduate colleges:
Here:
0.0%
South Dakota:
10.2%
Occupation by median earnings in the past 12 months ($)
105,800Management occupations
94,311Farming, fishing, and forestry occupations
64,741Architecture and engineering occupations
62,042Transportation occupations
59,691Construction and extraction occupations
58,027Health diagnosing and treating practitioners and other technical occupations
Top industries in this zip code by the number of employees in 2005:
Health Care and Social Assistance: Nursing Care Facilities (50-99 employees: 1 establishment)
Finance and Insurance: Commercial Banking (20-49: 1, 1-4: 1)
Accommodation and Food Services: Full-Service Restaurants (5-9: 2, 1-4: 2)
Wholesale Trade: Grain and Field Bean Merchant Wholesalers (10-19: 1)
Other Services (except Public Administration): Automotive Body, Paint, and Interior Repair and Maintenance (10-19: 1)
Utilities: Water Supply and Irrigation Systems (10-19: 1)
People in group quarters in 2010:
115 people in other noninstitutional facilities
37 people in nursing facilities/skilled-nursing facilities
People in group quarters in 2000:
48 people in nursing homes
10 people in other group homes
Fatal accident statistics in 2014:
Fatal accident count: 1
Vehicles involved in fatal accidents: 1
Fatal accidents caused by drunken drivers: 1
Fatalities: 1
Persons involved in fatal accidents: 1
Pedestrians involved in fatal accidents: 0
Fatal accident statistics in 2013:
Fatal accident count: 2
Vehicles involved in fatal accidents: 4
Fatal accidents caused by drunken drivers: 1
Fatalities: 2
Persons involved in fatal accidents: 28
Pedestrians involved in fatal accidents: 0
2002 - 2018 National Fire Incident Reporting System (NFIRS) incidents
According to the data from the years 2002 - 2018 the average number of fires per year is 7. The highest number of fire incidents - 20 took place in 2006, and the least - 0 in 2013. The data has an increasing trend.
When looking into fire subcategories, the most incidents belonged to: Outside Fires (42.0%), and Structure Fires (32.1%).
Fire incident types reported to NFIRS in Zip Code 57212


+$4,877
-$429
(% of AGI for various income ranges: -15.8% for AGIs below $10k, -0.3% for AGIs $10k-25k, 0.8% for AGIs $25k-50k, 1.8% for AGIs $50k-75k, 3.4% for AGIs $75k-100k, 10.3% for AGIs over 100k) Nearest zip codes: 57214, 57061, 57071, 57248, 57249, 57220.
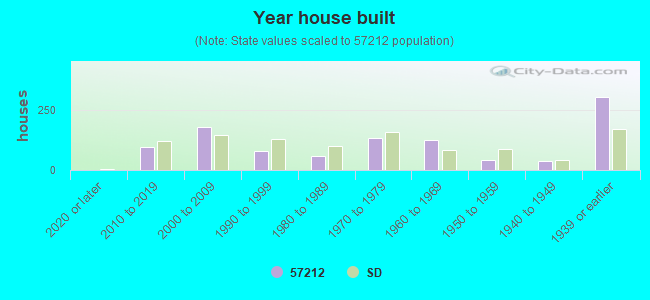


 According to the data from the years 2002 - 2018 the average number of fires per year is 7. The highest number of fire incidents - 20 took place in 2006, and the least - 0 in 2013. The data has an increasing trend.
 When looking into fire subcategories, the most incidents belonged to: Outside Fires (42.0%), and Structure Fires (32.1%).