Estimated zip code population in 2022: 648 Zip code population in 2010: 689 Zip code population in 2000: 816
Houses and condos: 397 Renter-occupied apartments: 46
% of renters here:
17%
State:
30%
March 2022 cost of living index in zip code 57568: 77.1 (low, U.S. average is 100)
Land area: 367.7 sq. mi. Water area: 1.4 sq. mi.
Population density: 2 people per square mile
(very low).
OSM Map
General Map
Google Map
MSN Map
OSM Map
General Map
Google Map
MSN Map
OSM Map
General Map
Google Map
MSN Map
OSM Map
General Map
Google Map
MSN Map
Please wait while loading the map...
Real estate property taxes paid for housing units in 2022:
This zip code:
0.9% ($1,755)
South Dakota:
1.0% ($2,481)
Median real estate property taxes paid for housing units with mortgages in 2022: $2,075 (1.1%) Median real estate property taxes paid for housing units with no mortgage in 2022: $1,554 (1.3%)
Business Search- 14 Million verified businesses
Males: 349
(53.8%)
Females: 299
(46.2%)
For population 25 years and over in 57568:
High school or higher: 97.5%
Bachelor's degree or higher: 39.2%
Graduate or professional degree: 6.4%
Unemployed: 0.9%
Mean travel time to work (commute): 22.1 minutes
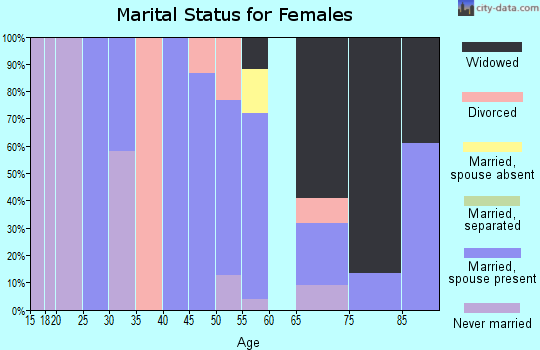
For population 15 years and over in 57568:
Never married: 24.1%
Now married: 56.7%
Separated: 0.0%
Widowed: 4.4%
Divorced: 14.8%
Zip code 57568 compared to state average:
Unemployed percentage significantly below state average.
Black race population percentage significantly below state average.
Hispanic race population percentage significantly below state average.
Median age significantly above state average.
Foreign-born population percentage significantly below state average.
Renting percentage below state average.
Length of stay since moving in significantly above state average.
House age above state average.
Number of college students significantly below state average.
Estimated median house/condo value in 2022: $185,396
57568:
$185,396
South Dakota:
$245,000
According to our research of South Dakota and other state lists, there was 1 registered sex offender living in 57568 zip code as of May 28, 2024. The ratio of all residents to sex offenders in zip code 57568 is 670 to 1. The ratio of registered sex offenders to all residents in this zip code is much lower than the state average.
Median resident age:
This zip code:
52.4 years
South Dakota median age:
38.5 years
Average household size:
This zip code:
2.4 people
South Dakota:
2.4 people
Averages for the 2020 tax year for zip code 57568, filed in 2021:
Average Adjusted Gross Income (AGI) in 2020: $65,406 (Individual Income Tax Returns)
Here:
$65,406
State:
$75,230
Salary/wage: $41,033 (reported on 77.1% of returns)
Here:
$41,033
State:
$54,824
(% of AGI for various income ranges: 1531.7% for AGIs below $25k, 4060.0% for AGIs $25k-50k, 7840.0% for AGIs $50k-75k, 6280.0% for AGIs $75k-100k)
Taxable interest for individuals: $1,492 (reported on 34.3% of returns)
This zip code:
$1,492
South Dakota:
$2,207
(% of AGI for various income ranges: 10.0% for AGIs below $25k, 83.3% for AGIs $25k-50k, 33.3% for AGIs $50k-75k)
Ordinary dividends: $1,550 (reported on 22.9% of returns)
Here:
$1,550
State:
$6,303
(% of AGI for various income ranges: 28.3% for AGIs below $25k, 93.3% for AGIs $50k-75k)
Net capital gain/loss in AGI: +$13,227 (reported on 31.4% of returns)
Here:
+$13,227
State:
+$27,098
(% of AGI for various income ranges: 205.0% for AGIs $25k-50k, 1686.7% for AGIs $50k-75k)
Profit/loss from business: +$4,117 (reported on 17.1% of returns)
Here:
+$4,117
State:
+$13,092
(% of AGI for various income ranges: 240.0% for AGIs below $25k, 343.3% for AGIs $50k-75k)
Taxable individual retirement arrangement distribution: $4,633 (reported on 8.6% of returns)
57568:
$4,633
South Dakota:
$17,605
(% of AGI for various income ranges: 231.7% for AGIs $25k-50k)
Earned income credit: $2,000 (reported on 11.4% of returns)
Here:
$2,000
State:
$2,165
(% of AGI for various income ranges: 133.3% for AGIs below $25k)
Percentage of individuals using paid preparers for their 2020 taxes: 94.3%
Here:
94%
State:
95%
(% for various income ranges: 100.0% for AGIs below $25k, 88.9% for AGIs $25k-50k, 83.3% for AGIs $50k-75k, 100.0% for AGIs $75k-100k, 100.0% for AGIs $100k-200k)
Averages for the 2012 tax year for zip code 57568, filed in 2013:
Average Adjusted Gross Income (AGI) in 2012: $49,057 (Individual Income Tax Returns)
Here:
$49,057
State:
$58,425
Salary/wage: $30,114 (reported on 75.7% of returns)
Here:
$30,114
State:
$41,676
(% of AGI for various income ranges: 68.4% for AGIs below $25k, 68.3% for AGIs $25k-50k, 91.0% for AGIs $50k-75k, 24.8% for AGIs $100k-200k)
Taxable interest for individuals: $1,593 (reported on 37.8% of returns)
This zip code:
$1,593
South Dakota:
$2,148
(% of AGI for various income ranges: 3.4% for AGIs below $25k, 0.7% for AGIs $25k-50k, 1.3% for AGIs $50k-75k, 1.3% for AGIs $100k-200k)
Ordinary dividends: $1,425 (reported on 21.6% of returns)
Here:
$1,425
State:
$6,197
(% of AGI for various income ranges: 2.6% for AGIs below $25k, 0.9% for AGIs $50k-75k, 0.5% for AGIs $100k-200k)
Net capital gain/loss in AGI: +$18,845 (reported on 29.7% of returns)
Here:
+$18,845
State:
+$21,273
(% of AGI for various income ranges: 1.1% for AGIs below $25k, 7.4% for AGIs $25k-50k, 8.6% for AGIs $50k-75k, 20.3% for AGIs $100k-200k)
Profit/loss from business: +$3,214 (reported on 18.9% of returns)
Here:
+$3,214
State:
+$11,552
(% of AGI for various income ranges: 6.6% for AGIs below $25k, 2.2% for AGIs $25k-50k, 0.9% for AGIs $50k-75k)
Taxable individual retirement arrangement distribution: $5,367 (reported on 8.1% of returns)
57568:
$5,367
South Dakota:
$12,416
Total itemized deductions: $15,350 (27% of AGI, reported on 10.8% of returns)
Here:
$15,350
State:
$21,763
Here:
26.9% of AGI
State:
16.0% of AGI
Taxes paid: $1,375 (reported on 10.8% of returns)
57568:
$1,375
State:
$5,214
Earned income credit: $2,000 (reported on 13.5% of returns)
Here:
$2,000
State:
$2,081
(% of AGI for various income ranges: 3.9% for AGIs below $25k, 0.9% for AGIs $25k-50k)
Percentage of individuals using paid preparers for their 2012 taxes: 64.9%
Here:
65%
State:
55%
(% for various income ranges: 53.3% for AGIs below $25k, 70.0% for AGIs $25k-50k, 120.0% for AGIs $50k-75k, 75.0% for AGIs $100k-200k)
Averages for the 2004 tax year for zip code 57568, filed in 2005:
Average Adjusted Gross Income (AGI) in 2004: $33,336 (Individual Income Tax Returns)
Here:
$33,336
State:
$41,242
Salary/wage: $24,504 (reported on 71.4% of returns)
Here:
$24,504
State:
$32,969
(% of AGI for various income ranges: 136.7% for AGIs below $10k, 64.3% for AGIs $10k-25k, 62.7% for AGIs $25k-50k, 57.5% for AGIs $50k-75k, 48.8% for AGIs $75k-100k, 27.1% for AGIs over 100k)
Taxable interest for individuals: $2,995 (reported on 54.8% of returns)
This zip code:
$2,995
South Dakota:
$2,098
(% of AGI for various income ranges: 35.3% for AGIs below $10k, 4.7% for AGIs $10k-25k, 9.0% for AGIs $25k-50k, 2.1% for AGIs $50k-75k, 0.3% for AGIs $75k-100k, 4.0% for AGIs over 100k)
Taxable dividends: $1,776 (reported on 28.3% of returns)
Here:
$1,776
State:
$2,577
(% of AGI for various income ranges: 9.1% for AGIs below $10k, 1.0% for AGIs $10k-25k, 2.2% for AGIs $25k-50k, 0.8% for AGIs $50k-75k, 2.0% for AGIs over 100k)
Net capital gain/loss: +$6,156 (reported on 32.3% of returns)
Here:
+$6,156
State:
+$11,418
(% of AGI for various income ranges: -4.2% for AGIs below $10k, 2.6% for AGIs $10k-25k, 5.2% for AGIs $25k-50k, 5.4% for AGIs $50k-75k, 13.1% for AGIs over 100k)
Profit/loss from business: +$2,593 (reported on 15.6% of returns)
Here:
+$2,593
State:
+$9,138
(% of AGI for various income ranges: 3.5% for AGIs below $10k, 0.9% for AGIs $10k-25k, 2.2% for AGIs $25k-50k, 2.3% for AGIs $50k-75k)
Profit/loss from farming: +$2,311 (reported on 27.2% of returns)
Here:
+$2,311
State:
-$429
(% of AGI for various income ranges: -25.2% for AGIs below $10k, -4.1% for AGIs $10k-25k, 0.8% for AGIs $25k-50k, -6.7% for AGIs $50k-75k, 17.7% for AGIs over 100k)
Total itemized deductions: $15,516 (40% of AGI, reported on 8.2% of returns)
Here:
$15,516
State:
$17,139
Here:
40.3% of AGI
State:
19.0% of AGI
Charity contributions deductions: $1,083 (3% of AGI, reported on 6.3% of returns)
Here:
$1,083
State:
$4,114
Here:
2.9% of AGI
State:
4.2% of AGI
Total tax: $4,719 (reported on 75.4% of returns)
57568:
$4,719
State:
$6,372
(% of AGI for various income ranges: 6.6% for AGIs below $10k, 5.3% for AGIs $10k-25k, 6.7% for AGIs $25k-50k, 8.0% for AGIs $50k-75k, 14.1% for AGIs $75k-100k, 18.0% for AGIs over 100k)
Earned income credit: $1,500 (reported on 12.7% of returns)
Here:
$1,500
State:
$1,607
Percentage of individuals using paid preparers for their 2004 taxes: 78.3%
Here:
78%
State:
63%
(% for various income ranges: 74.6% for AGIs below $10k, 75.8% for AGIs $10k-25k, 77.9% for AGIs $25k-50k, 81.6% for AGIs $50k-75k, 90.0% for AGIs $75k-100k, 94.7% for AGIs over 100k)
Household received Food Stamps/SNAP in the past 12 months: 6 Household did not receive Food Stamps/SNAP in the past 12 months: 263
Women who had a birth in the past 12 months: 40 (36 now married, 0 unmarried) Women who did not have a birth in the past 12 months: 78 (26 now married, 51 unmarried)
Housing units in zip code 57568 with a mortgage: 48 Residents with income below the poverty level in 2022:
This zip code:
3.4%
Whole state:
12.5%
Residents with income below 50% of the poverty level in 2022:
This zip code:
2.5%
Whole state:
6.8%
Median number of rooms in houses and condos:
Here:
7.0
State:
7.0
Median number of rooms in apartments:
Here:
4.6
State:
4.1
Notable locations in this zip code not listed on our city pages
Notable locations in zip code 57568: Christensen Ranch (A), Presho Fire Department (B), Presho City Hall (C), Presho Public Library (D), Lyman County Ambulance Service Presho (E). Display/hide their locations on the map
Parks in zip code 57568 include: Fate Dam State Public Shooting Area (1), Brakke Dam State Public Shooting Area (2). Display/hide their locations on the map
In group quarters: 1 (-1 institutionalized population)
Size of family households: 89 2-persons, 43 3-persons, 18 4-persons, 20 5-persons
Size of nonfamily households: 66 1-person, 28 2-persons
99 married couples with children.
0 single-parent households ().
94.3% of residents of 57568 zip code speak English at home.
5.2% of residents speak Spanish at home (100% not well).
Foreign born population: 0 (0.0%)
:
0.0%
Whole state:
3.5%
35%German
18%American
18%Irish
13%Czech
7%Norwegian
5%English
2%Swiss
Facilities with environmental interests located in this zip code:
LYMAN HI SCH (201 SOUTH BIRCH AVE in PRESHO, SD)
(National Center for Education Statistics) - STATE ID-1 Organizations: LYMAN SCHOOL DISTRICT 42-1 (SCHOOL DISTRICT)
PRESHO ELEM (201 SOUTH BIRCH AVE in PRESHO, SD)
(National Center for Education Statistics) - STATE ID-3 Organizations: LYMAN SCHOOL DISTRICT 42-1 (SCHOOL DISTRICT)
CONAGRA INC (103 N MAIN ST in PRESHO, SD) . Tribal Land
(Integrated Compliance Information System) - ICIS-08-1999-0185, FORMAL ENFORCEMENT ACTION Business SIC classification: GRAIN AND FIELD BEANS; FARM SUPPLIES
(Integrated Compliance Information System) - ICIS-08-1989-0109, FORMAL ENFORCEMENT ACTION, ICIS-08-1989-0072, Business SIC classification: SEWERAGE SYSTEMS
LYMAN SCHOOL DISTRICT 42 (410 BIRCH AVENUE in PRESHO, SD)
COMPLIANCE ACTIVITY (Tracking inspections of insecticide, fungicide, and rodenticide, and toxic substances) Alternative names: LYMAN SCH DIST 421, LYMAN SCHOOL DISTRICT 42-1
PRESHO - CITY OF (SW1/4,SW1/4,SEC.11,NW1/4,NW1/4 in PRESHO, SD)
National Pollutant Discharge Elimination System NON-MAJOR (Tracking pollutant discharge elimination systems) - permit Business SIC classification: SEWERAGE SYSTEMS
Housing units lacking complete plumbing facilities: 1.9% Housing units lacking complete kitchen facilities: 3.1%
33.9%Electricity
32.3%Bottled, tank, or LP gas
14.2%Utility gas
11.0%Fuel oil, kerosene, etc.
9.5%Wood
Population in 1990: 897.
Place of birth for U.S.-born residents:
This state: 460
Northeast: 3
Midwest: 151
South: 4
West: 24
72% of the 57568 zip code residents lived in the same house 5 years ago. Out of people who lived in different houses, 66% lived in this county. Out of people who lived in different counties, 50% lived in South Dakota.
99% of the 57568 zip code residents lived in the same house 1 year ago. Out of people who lived in different houses, 100% moved from this county. Out of people who lived in different houses, 75% moved from different state.
Private vs. public school enrollment:
Students in private schools in grades 1 to 8 (elementary and middle school):
Here:
0.0%
South Dakota:
11.9%
Students in private schools in grades 9 to 12 (high school):
Here:
0.0%
South Dakota:
7.2%
Occupation by median earnings in the past 12 months ($)
80,963Management occupations
61,273Arts, design, entertainment, sports, and media occupations
37,023Farming, fishing, and forestry occupations
20,976Office and administrative support occupations
17,873Sales and related occupations
17,252Education, training, and library occupations
Top industries in this zip code by the number of employees in 2005:
Accommodation and Food Services: Hotels (except Casino Hotels) and Motels (20-49 employees: 1 establishment, 1-4 employees: 2 establishments)
Wholesale Trade: Wholesale Trade Agents and Brokers (20-49: 1)
Utilities: Electric Power Distribution (5-9: 1)
Accommodation and Food Services: Drinking Places (Alcoholic Beverages) (5-9: 1)
Finance and Insurance: Commercial Banking (5-9: 1)
Other Services (except Public Administration): Religious Organizations (1-4: 2)
Wholesale Trade: Grain and Field Bean Merchant Wholesalers (1-4: 1)
People in group quarters in 2000:
10 people in nursing homes
Fatal accident statistics in 2013:
Fatal accident count: 1
Vehicles involved in fatal accidents: 1
Fatal accidents caused by drunken drivers: 0
Fatalities: 1
Persons involved in fatal accidents: 1
Pedestrians involved in fatal accidents: 0
Fatal accident statistics in 2011:
Fatal accident count: 1
Vehicles involved in fatal accidents: 1
Fatal accidents caused by drunken drivers: 0
Fatalities: 1
Persons involved in fatal accidents: 2
Pedestrians involved in fatal accidents: 0
2003 - 2018 National Fire Incident Reporting System (NFIRS) incidents
Based on the data from the years 2003 - 2018 the average number of fires per year is 7. The highest number of reported fire incidents - 14 took place in 2018, and the least - 0 in 2007. The data has an increasing trend.
When looking into fire subcategories, the most reports belonged to: Outside Fires (59.3%), and Mobile Property/Vehicle Fires (18.5%).
Fire incident types reported to NFIRS in Zip Code 57568


+$2,311
-$429
(% of AGI for various income ranges: -25.2% for AGIs below $10k, -4.1% for AGIs $10k-25k, 0.8% for AGIs $25k-50k, -6.7% for AGIs $50k-75k, 17.7% for AGIs over 100k) Nearest zip codes: 57544, 57576, 57541, 57584, 57531, 57548.


 Based on the data from the years 2003 - 2018 the average number of fires per year is 7. The highest number of reported fire incidents - 14 took place in 2018, and the least - 0 in 2007. The data has an increasing trend.
 When looking into fire subcategories, the most reports belonged to: Outside Fires (59.3%), and Mobile Property/Vehicle Fires (18.5%).