Estimated zip code population in 2022: 509 Zip code population in 2010: 427 Zip code population in 2000: 504
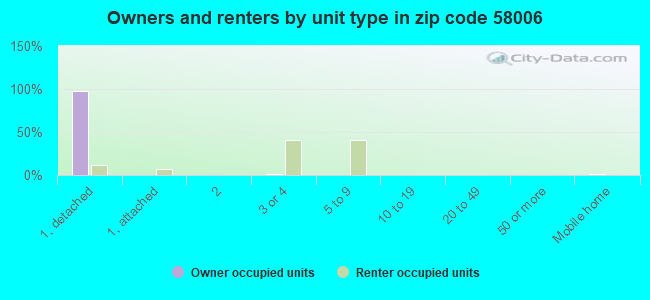
Houses and condos: 195 Renter-occupied apartments: 26
% of renters here:
14%
State:
35%
March 2022 cost of living index in zip code 58006: 79.7 (low, U.S. average is 100)
Land area: 61.8 sq. mi. Water area: 0.0 sq. mi.
Population density: 8 people per square mile
(very low).
OSM Map
General Map
Google Map
MSN Map
OSM Map
General Map
Google Map
MSN Map
OSM Map
General Map
Google Map
MSN Map
OSM Map
General Map
Google Map
MSN Map
Please wait while loading the map...
Real estate property taxes paid for housing units in 2022:
This zip code:
0.6% ($1,631)
North Dakota:
1.0% ($2,347)
Median real estate property taxes paid for housing units with mortgages in 2022: $1,796 (0.6%) Median real estate property taxes paid for housing units with no mortgage in 2022: $1,311 (0.8%)
Business Search- 14 Million verified businesses
Males: 270
(53.1%)
Females: 238
(46.9%)
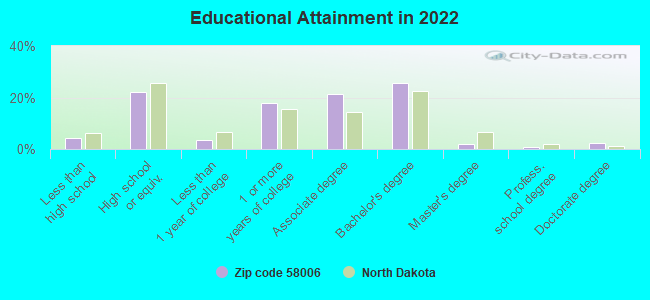
For population 25 years and over in 58006:
High school or higher: 95.4%
Bachelor's degree or higher: 31.1%
Graduate or professional degree: 5.7%
Unemployed: 2.5%
Mean travel time to work (commute): 35.5 minutes
For population 15 years and over in 58006:
Never married: 24.6%
Now married: 68.3%
Separated: 0.4%
Widowed: 3.3%
Divorced: 3.3%
Zip code 58006 compared to state average:
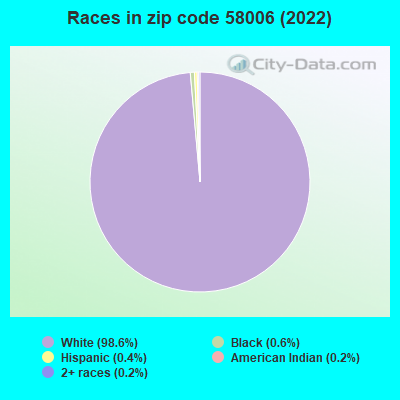
Black race population percentage significantly below state average.
Hispanic race population percentage significantly below state average.
Median age above state average.
Foreign-born population percentage significantly below state average.
Renting percentage significantly below state average.
Length of stay since moving in above state average.
Estimated median house/condo value in 2022: $251,778
58006:
$251,778
North Dakota:
$243,100
Median resident age:
This zip code:
41.4 years
North Dakota median age:
36.2 years
Average household size:
This zip code:
2.6 people
North Dakota:
2.3 people
Averages for the 2020 tax year for zip code 58006, filed in 2021:
Average Adjusted Gross Income (AGI) in 2020: $136,820 (Individual Income Tax Returns)
Here:
$136,820
State:
$77,891
Salary/wage: $61,494 (reported on 85.0% of returns)
Here:
$61,494
State:
$59,202
(% of AGI for various income ranges: 1165.0% for AGIs below $25k, 4406.7% for AGIs $25k-50k, 3997.5% for AGIs $50k-75k, 17886.7% for AGIs $100k-200k)
Taxable interest for individuals: $18,567 (reported on 45.0% of returns)
This zip code:
$18,567
North Dakota:
$2,112
(% of AGI for various income ranges: 116.7% for AGIs $25k-50k, 5453.3% for AGIs $100k-200k)
Ordinary dividends: $54,225 (reported on 20.0% of returns)
Here:
$54,225
State:
$5,239
(% of AGI for various income ranges: 5422.5% for AGIs $50k-75k)
Net capital gain/loss in AGI: +$14,400 (reported on 20.0% of returns)
Here:
+$14,400
State:
+$17,618
(% of AGI for various income ranges: 1920.0% for AGIs $100k-200k)
Profit/loss from business: +$13,567 (reported on 15.0% of returns)
Here:
+$13,567
State:
+$12,375
(% of AGI for various income ranges: 1017.5% for AGIs $50k-75k)
Percentage of individuals using paid preparers for their 2020 taxes: 100.0%
Here:
100%
State:
95%
(% for various income ranges: 100.0% for AGIs below $25k, 100.0% for AGIs $25k-50k, 100.0% for AGIs $50k-75k, 100.0% for AGIs $75k-100k, 100.0% for AGIs $100k-200k)
Averages for the 2012 tax year for zip code 58006, filed in 2013:
Average Adjusted Gross Income (AGI) in 2012: $122,143 (Individual Income Tax Returns)
Here:
$122,143
State:
$70,683
Salary/wage: $43,921 (reported on 82.6% of returns)
Here:
$43,921
State:
$48,615
(% of AGI for various income ranges: 71.1% for AGIs below $25k, 72.3% for AGIs $25k-50k, 60.2% for AGIs $50k-75k, 18.5% for AGIs $100k-200k)
Taxable interest for individuals: $1,200 (reported on 43.5% of returns)
This zip code:
$1,200
North Dakota:
$1,659
(% of AGI for various income ranges: 3.5% for AGIs below $25k, 0.7% for AGIs $50k-75k, 0.3% for AGIs $100k-200k)
Ordinary dividends: $22,120 (reported on 21.7% of returns)
Here:
$22,120
State:
$4,855
Net capital gain/loss in AGI: +$162,880 (reported on 21.7% of returns)
Here:
+$162,880
State:
+$26,078
Profit/loss from business: +$7,867 (reported on 13.0% of returns)
Here:
+$7,867
State:
+$14,112
Total itemized deductions: $34,900 (7% of AGI, reported on 17.4% of returns)
Here:
$34,900
State:
$22,515
Here:
7.5% of AGI
State:
13.2% of AGI
Charity contributions: $6,333 (reported on 13.0% of returns)
Here:
$6,333
State:
$5,593
Taxes paid: $5,275 (reported on 17.4% of returns)
58006:
$5,275
State:
$6,844
Earned income credit: $2,000 (reported on 8.7% of returns)
Here:
$2,000
State:
$1,989
(% of AGI for various income ranges: 4.2% for AGIs below $25k)
Percentage of individuals using paid preparers for their 2012 taxes: 78.3%
Here:
78%
State:
59%
(% for various income ranges: 75.0% for AGIs below $25k, 80.0% for AGIs $25k-50k, 80.0% for AGIs $50k-75k, 80.0% for AGIs $100k-200k)
Averages for the 2004 tax year for zip code 58006, filed in 2005:
Average Adjusted Gross Income (AGI) in 2004: $171,815 (Individual Income Tax Returns)
Here:
$171,815
State:
$40,108
Salary/wage: $32,452 (reported on 82.0% of returns)
Here:
$32,452
State:
$33,868
(% of AGI for various income ranges: 107.5% for AGIs below $10k, 54.5% for AGIs $10k-25k, 67.5% for AGIs $25k-50k, 88.0% for AGIs $50k-75k, 3.5% for AGIs over 100k)
Taxable interest for individuals: $4,604 (reported on 54.1% of returns)
This zip code:
$4,604
North Dakota:
$1,652
(% of AGI for various income ranges: 3.7% for AGIs below $10k, 8.6% for AGIs $10k-25k, 2.1% for AGIs $25k-50k, 1.0% for AGIs $50k-75k, 1.3% for AGIs over 100k)
Taxable dividends: $165,157 (reported on 24.9% of returns)
Here:
$165,157
State:
$2,207
Net capital gain/loss: +$314,058 (reported on 25.4% of returns)
Here:
+$314,058
State:
+$6,573
Profit/loss from business: +$5,031 (reported on 15.6% of returns)
Here:
+$5,031
State:
+$8,636
Total itemized deductions: $26,811 (3% of AGI, reported on 18.0% of returns)
Here:
$26,811
State:
$16,683
Here:
3.4% of AGI
State:
18.6% of AGI
Charity contributions deductions: $20,618 (2% of AGI, reported on 16.6% of returns)
Here:
$20,618
State:
$3,523
Here:
2.4% of AGI
State:
3.6% of AGI
Total tax: $33,101 (reported on 77.1% of returns)
58006:
$33,101
State:
$5,748
(% of AGI for various income ranges: 1.2% for AGIs below $10k, 3.3% for AGIs $10k-25k, 6.2% for AGIs $25k-50k, 8.5% for AGIs $50k-75k, 11.5% for AGIs $75k-100k, 16.6% for AGIs over 100k)
Earned income credit: $765 (reported on 8.3% of returns)
Here:
$765
State:
$1,558
Percentage of individuals using paid preparers for their 2004 taxes: 78.5%
Here:
79%
State:
63%
(% for various income ranges: 67.6% for AGIs below $10k, 80.0% for AGIs $10k-25k, 76.2% for AGIs $25k-50k, 106.8% for AGIs $50k-75k, 81.2% for AGIs over 100k)
Household received Food Stamps/SNAP in the past 12 months: 6 Household did not receive Food Stamps/SNAP in the past 12 months: 180
Women who did not have a birth in the past 12 months: 110 (60 now married, 49 unmarried)
Housing units in zip code 58006 with a mortgage: 107 (1 second mortgage, 1 both second mortgage and home equity loan) Median monthly owner costs for units with a mortgage: $1,481 Median monthly owner costs for units without a mortgage: $670
Residents with income below the poverty level in 2022:
This zip code:
0.7%
Whole state:
11.5%
Median number of rooms in houses and condos:
Here:
8.3
State:
7.0
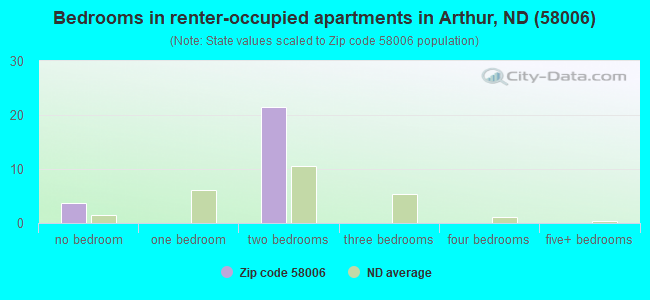
Median number of rooms in apartments:
Here:
3.5
State:
4.0
Notable locations in this zip code not listed on our city pages
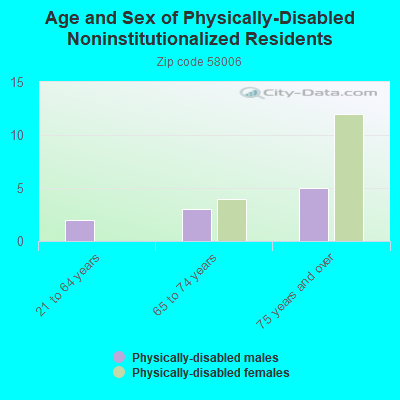
In group quarters: 29 (-1 institutionalized population)
Size of family households: 62 2-persons, 23 3-persons, 18 4-persons, 28 5-persons, 1 6-persons, 1 7-or-more-persons
Size of nonfamily households: 42 1-person, 7 2-persons
143 married couples with children.
3 single-parent households (3 women).
97.9% of residents of 58006 zip code speak English at home.
0.2% of residents speak Spanish at home (100% very well).
1.9% of residents speak other Indo-European language at home (100% very well).
Foreign born population: 0 (0.0%)
:
0.0%
Whole state:
4.9%
41%German
30%Norwegian
7%American
7%English
4%Danish
3%Swedish
2%Dutch
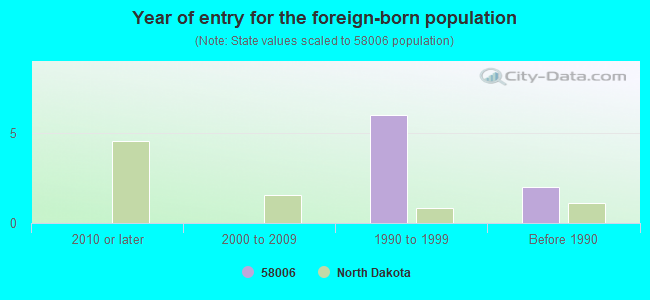
Year of entry for the foreign-born population
02010 or later
02000 to 2009
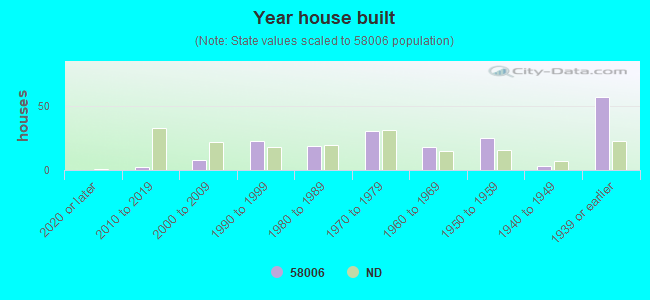
61990 to 1999
2Before 1990
Facilities with environmental interests located in this zip code:
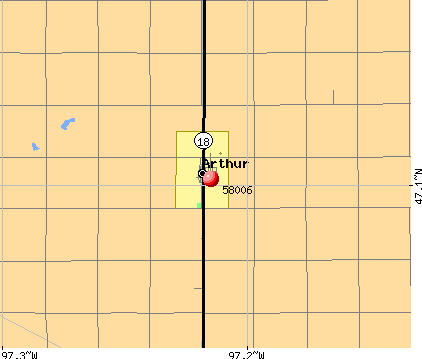
ARTHUR, CITY OF (UNKNOWN in ARTHUR, ND)
National Pollutant Discharge Elimination System NON-MAJOR (Tracking pollutant discharge elimination systems) - permit Business SIC classification: SEWERAGE SYSTEMS
ARTHUR MERCANTILE CO (410 MAIN ST in ARTHUR, ND)
Conditionally Exempt Small Quantity Generators, less than 100 kg/month of hazardous waste (Resource Conservation and Recovery Act (tracking hazardous waste)) - notification Business NAICS classification: GENERAL AUTOMOTIVE REPAIR. Organizations: JIM WILLIAMS (CONTACT/OWNER)
Housing units lacking complete kitchen facilities: 3.6%
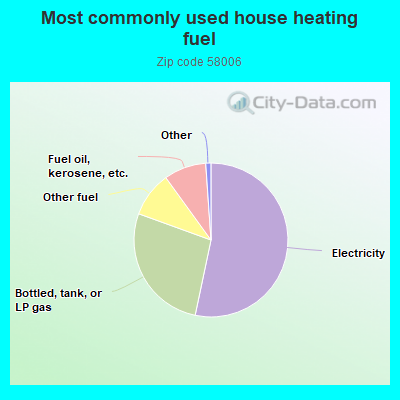
54.0%Electricity
27.6%Bottled, tank, or LP gas
9.6%Other fuel
9.0%Fuel oil, kerosene, etc.
0.6%Utility gas
0.6%No fuel used
Population in 1990: 543.
Place of birth for U.S.-born residents:
This state: 370
Midwest: 118
South: 6
West: 3
48% of the 58006 zip code residents lived in the same house 5 years ago. Out of people who lived in different houses, 72% lived in this county. Out of people who lived in different counties, 50% lived in North Dakota.
96% of the 58006 zip code residents lived in the same house 1 year ago. Out of people who lived in different houses, 58% moved from this county. Out of people who lived in different houses, 8% moved from different county within same state. Out of people who lived in different houses, 58% moved from different state.
Private vs. public school enrollment:
Students in private schools in grades 1 to 8 (elementary and middle school): 18
Here:
26.8%
North Dakota:
8.4%
Students in private schools in grades 9 to 12 (high school): 19
Here:
48.0%
North Dakota:
8.2%
Students in private undergraduate colleges: 6
Here:
100.0%
North Dakota:
14.3%
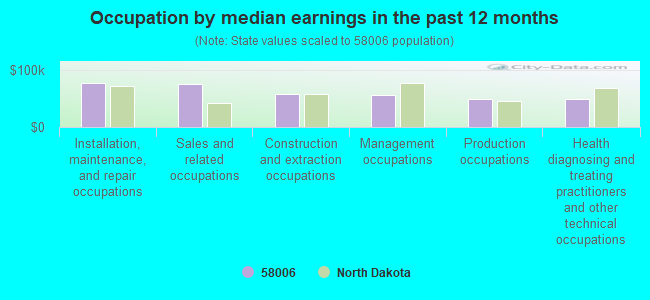
Occupation by median earnings in the past 12 months ($)
77,465Installation, maintenance, and repair occupations
74,990Sales and related occupations
57,586Construction and extraction occupations
56,033Management occupations
49,726Production occupations
49,404Health diagnosing and treating practitioners and other technical occupations
Companies with federal contracts located in this zip code:
LAKO DRILLING, INC (325 COUNTY ROAD 34 in ARTHUR, ND; small business) : $2,590,298 in 12 contractsfrom 2000 to 2006
Contracts for Construction of Structures and Facilities -- Other Non-Building Facilities, Pipe, Tube and Rigid Tubing, Maintenance, Repair or Alteration of Real Property -- Sewage and Waste Facilities by Air Force, Geological Survey, U.S. Fish and Wildlife Service Signed by year:2000: $19,000; 2001: $0; 2002: $0; 2003: $0; 2004: $655,000; 2005: $1,852,298; 2006: $64,000.
Biggest contracts:
$646,000 with Air Force for Construction of Structures and Facilities -- Other Non-Building Facilities. Taking place in MT. Signed on 2005-09-29. Completion date: 2006-09-30.
$360,000, same as above.Signed on 2005-06-10. Completion date: 2006-11-01.
$359,999, same as above.Signed on 2005-06-17. Completion date: 2006-11-01.
$339,928, same as above.Signed on 2004-09-30. Completion date: 2005-09-27.
Top industries in this zip code by the number of employees in 2005:
Health Care and Social Assistance: Nursing Care Facilities (50-99 employees: 1 establishment)
Wholesale Trade: Grain and Field Bean Merchant Wholesalers (20-49: 1)
Wholesale Trade: Farm and Garden Machinery and Equipment Merchant Wholesalers (10-19: 1)
Finance and Insurance: Commercial Banking (10-19: 1)
Accommodation and Food Services: Full-Service Restaurants (5-9: 1)
Mining: Drilling Oil and Gas Wells (5-9: 1)
Real Estate and Rental and Leasing: Lessors of Nonresidential Buildings (except Miniwarehouses) (1-4: 2)
Other Services (except Public Administration): Religious Organizations (1-4: 2)
Utilities: Electric Power Distribution (1-4: 1)
People in group quarters in 2010:
31 people in nursing facilities/skilled-nursing facilities
People in group quarters in 2000:
72 people in nursing homes
Home Mortgage Disclosure Act Aggregated Statistics For Year 2009 (Based on 2 partial tracts)
A) FHA, FSA/RHS & VA Home Purchase Loans
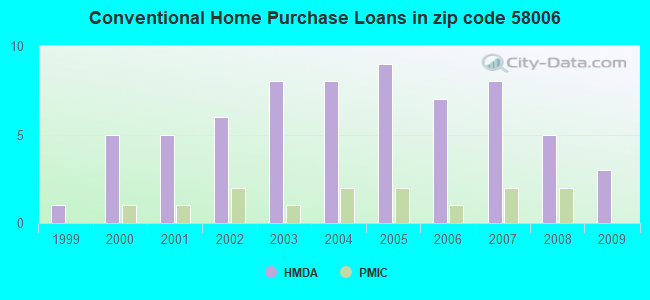
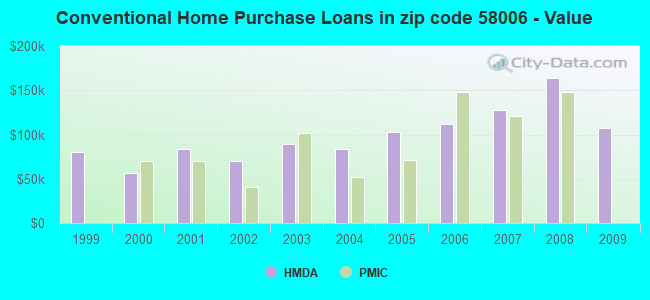
B) Conventional Home Purchase Loans
C) Refinancings
D) Home Improvement Loans
G) Loans On Manufactured Home Dwelling (A B C & D)
Number
Average Value
Number
Average Value
Number
Average Value
Number
Average Value
Number
Average Value
LOANS ORIGINATED
3
$131,157
3
$107,507
17
$132,437
1
$57,410
1
$42,520
APPLICATIONS APPROVED, NOT ACCEPTED
0
$0
1
$74,200
2
$192,270
0
$0
0
$0
APPLICATIONS DENIED
0
$0
0
$0
6
$148,263
0
$0
0
$0
APPLICATIONS WITHDRAWN
1
$115,900
1
$24,910
4
$190,035
1
$75,280
0
$0
FILES CLOSED FOR INCOMPLETENESS
0
$0
0
$0
0
$0
0
$0
0
$0
Aggregated Statistics For Year 2008 (Based on 2 partial tracts)
A) FHA, FSA/RHS & VA Home Purchase Loans
B) Conventional Home Purchase Loans
C) Refinancings
D) Home Improvement Loans
F) Non-occupant Loans on < 5 Family Dwellings (A B C & D)
G) Loans On Manufactured Home Dwelling (A B C & D)
Number
Average Value
Number
Average Value
Number
Average Value
Number
Average Value
Number
Average Value
Number
Average Value
LOANS ORIGINATED
2
$183,465
5
$163,888
15
$108,609
5
$20,148
2
$33,580
1
$165,190
APPLICATIONS APPROVED, NOT ACCEPTED
0
$0
0
$0
4
$112,922
0
$0
0
$0
1
$40,080
APPLICATIONS DENIED
0
$0
1
$31,410
6
$113,827
1
$15,710
0
$0
2
$69,190
APPLICATIONS WITHDRAWN
0
$0
1
$125,110
4
$113,802
1
$18,960
0
$0
0
$0
FILES CLOSED FOR INCOMPLETENESS
0
$0
0
$0
1
$84,220
0
$0
0
$0
0
$0
Aggregated Statistics For Year 2007 (Based on 2 partial tracts)
A) FHA, FSA/RHS & VA Home Purchase Loans
B) Conventional Home Purchase Loans
C) Refinancings
D) Home Improvement Loans
G) Loans On Manufactured Home Dwelling (A B C & D)
Number
Average Value
Number
Average Value
Number
Average Value
Number
Average Value
Number
Average Value
LOANS ORIGINATED
1
$99,110
8
$127,750
13
$111,424
3
$17,693
1
$112,920
APPLICATIONS APPROVED, NOT ACCEPTED
0
$0
0
$0
2
$118,070
1
$15,710
0
$0
APPLICATIONS DENIED
0
$0
1
$87,470
5
$106,100
2
$10,830
1
$17,330
APPLICATIONS WITHDRAWN
0
$0
1
$192,000
2
$120,100
1
$35,470
0
$0
FILES CLOSED FOR INCOMPLETENESS
0
$0
0
$0
1
$58,490
0
$0
0
$0
Aggregated Statistics For Year 2006 (Based on 2 partial tracts)
A) FHA, FSA/RHS & VA Home Purchase Loans
B) Conventional Home Purchase Loans
C) Refinancings
D) Home Improvement Loans
G) Loans On Manufactured Home Dwelling (A B C & D)
Number
Average Value
Number
Average Value
Number
Average Value
Number
Average Value
Number
Average Value
LOANS ORIGINATED
1
$129,170
7
$112,304
12
$90,086
5
$36,234
2
$68,650
APPLICATIONS APPROVED, NOT ACCEPTED
0
$0
0
$0
2
$72,170
0
$0
1
$37,910
APPLICATIONS DENIED
0
$0
2
$67,295
7
$93,310
1
$40,350
1
$59,850
APPLICATIONS WITHDRAWN
0
$0
1
$182,250
3
$130,437
1
$2,440
1
$45,770
FILES CLOSED FOR INCOMPLETENESS
0
$0
0
$0
2
$81,105
0
$0
0
$0
Aggregated Statistics For Year 2005 (Based on 2 partial tracts)
A) FHA, FSA/RHS & VA Home Purchase Loans
B) Conventional Home Purchase Loans
C) Refinancings
D) Home Improvement Loans
F) Non-occupant Loans on < 5 Family Dwellings (A B C & D)
G) Loans On Manufactured Home Dwelling (A B C & D)
Number
Average Value
Number
Average Value
Number
Average Value
Number
Average Value
Number
Average Value
Number
Average Value
LOANS ORIGINATED
2
$96,270
9
$102,603
11
$86,139
4
$30,668
1
$25,730
1
$61,470
APPLICATIONS APPROVED, NOT ACCEPTED
0
$0
2
$91,125
2
$111,165
0
$0
0
$0
1
$47,660
APPLICATIONS DENIED
0
$0
1
$69,870
6
$70,950
2
$33,040
0
$0
1
$33,040
APPLICATIONS WITHDRAWN
0
$0
1
$100,470
3
$92,793
1
$31,140
0
$0
0
$0
FILES CLOSED FOR INCOMPLETENESS
0
$0
0
$0
2
$98,570
0
$0
0
$0
0
$0
Aggregated Statistics For Year 2004 (Based on 2 partial tracts)
A) FHA, FSA/RHS & VA Home Purchase Loans
B) Conventional Home Purchase Loans
C) Refinancings
D) Home Improvement Loans
G) Loans On Manufactured Home Dwelling (A B C & D)
Number
Average Value
Number
Average Value
Number
Average Value
Number
Average Value
Number
Average Value
LOANS ORIGINATED
2
$73,930
8
$84,016
11
$76,883
4
$27,892
2
$66,345
APPLICATIONS APPROVED, NOT ACCEPTED
0
$0
1
$46,580
2
$48,340
1
$17,600
0
$0
APPLICATIONS DENIED
1
$60,120
2
$66,750
3
$58,223
2
$18,550
1
$30,330
APPLICATIONS WITHDRAWN
0
$0
1
$114,550
2
$101,550
0
$0
0
$0
FILES CLOSED FOR INCOMPLETENESS
0
$0
0
$0
2
$134,995
0
$0
0
$0
Aggregated Statistics For Year 2003 (Based on 2 partial tracts)
A) FHA, FSA/RHS & VA Home Purchase Loans
B) Conventional Home Purchase Loans
C) Refinancings
D) Home Improvement Loans
F) Non-occupant Loans on < 5 Family Dwellings (A B C & D)
Number
Average Value
Number
Average Value
Number
Average Value
Number
Average Value
Number
Average Value
LOANS ORIGINATED
3
$77,900
8
$88,822
21
$85,289
3
$12,007
1
$44,140
APPLICATIONS APPROVED, NOT ACCEPTED
0
$0
0
$0
2
$105,475
0
$0
0
$0
APPLICATIONS DENIED
1
$36,020
1
$73,390
6
$62,103
1
$13,540
0
$0
APPLICATIONS WITHDRAWN
0
$0
1
$151,110
2
$65,805
0
$0
0
$0
FILES CLOSED FOR INCOMPLETENESS
0
$0
0
$0
0
$0
0
$0
0
$0
Aggregated Statistics For Year 2002 (Based on 2 partial tracts)
A) FHA, FSA/RHS & VA Home Purchase Loans
B) Conventional Home Purchase Loans
C) Refinancings
D) Home Improvement Loans
Number
Average Value
Number
Average Value
Number
Average Value
Number
Average Value
LOANS ORIGINATED
2
$97,625
6
$69,687
11
$73,461
2
$43,055
APPLICATIONS APPROVED, NOT ACCEPTED
0
$0
0
$0
2
$84,085
0
$0
APPLICATIONS DENIED
0
$0
1
$43,600
5
$57,734
1
$15,160
APPLICATIONS WITHDRAWN
0
$0
1
$70,410
1
$52,810
0
$0
FILES CLOSED FOR INCOMPLETENESS
0
$0
0
$0
0
$0
0
$0
Aggregated Statistics For Year 2001 (Based on 2 partial tracts)
A) FHA, FSA/RHS & VA Home Purchase Loans
B) Conventional Home Purchase Loans
C) Refinancings
D) Home Improvement Loans
Number
Average Value
Number
Average Value
Number
Average Value
Number
Average Value
LOANS ORIGINATED
3
$62,647
5
$84,002
11
$61,767
2
$30,600
APPLICATIONS APPROVED, NOT ACCEPTED
0
$0
1
$30,870
1
$10,830
0
$0
APPLICATIONS DENIED
0
$0
2
$38,590
4
$57,410
1
$18,960
APPLICATIONS WITHDRAWN
0
$0
1
$66,620
3
$57,320
0
$0
FILES CLOSED FOR INCOMPLETENESS
0
$0
1
$18,140
0
$0
1
$23,020
Aggregated Statistics For Year 2000 (Based on 2 partial tracts)
A) FHA, FSA/RHS & VA Home Purchase Loans
B) Conventional Home Purchase Loans
C) Refinancings
D) Home Improvement Loans
F) Non-occupant Loans on < 5 Family Dwellings (A B C & D)
Number
Average Value
Number
Average Value
Number
Average Value
Number
Average Value
Number
Average Value
LOANS ORIGINATED
1
$83,410
5
$56,434
6
$55,830
2
$36,285
1
$11,370
APPLICATIONS APPROVED, NOT ACCEPTED
0
$0
1
$11,640
1
$19,500
0
$0
0
$0
APPLICATIONS DENIED
0
$0
1
$24,370
4
$40,755
1
$14,350
0
$0
APPLICATIONS WITHDRAWN
0
$0
1
$27,080
1
$47,390
0
$0
0
$0
FILES CLOSED FOR INCOMPLETENESS
0
$0
0
$0
0
$0
0
$0
0
$0
Aggregated Statistics For Year 1999 (Based on 1 partial tract)

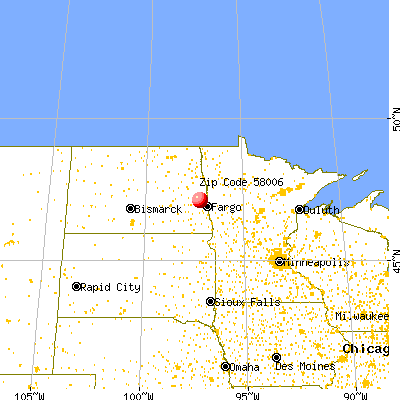


 Nearest zip codes: 58004, 58048, 58012, 58029, 58002, 58009.