Estimated zip code population in 2022: 1,454 Zip code population in 2010: 1,391 Zip code population in 2000: 1,492
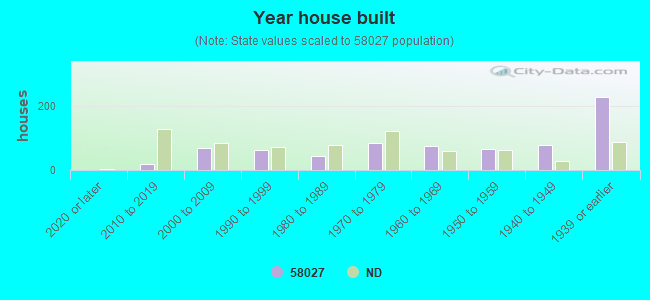
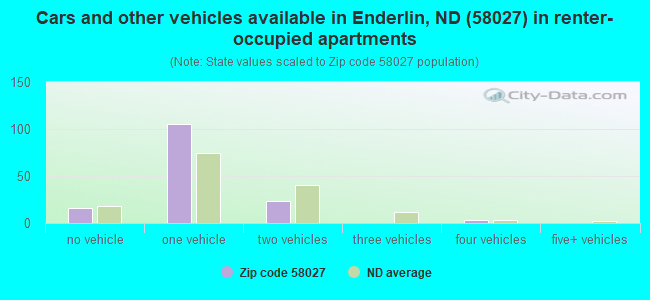
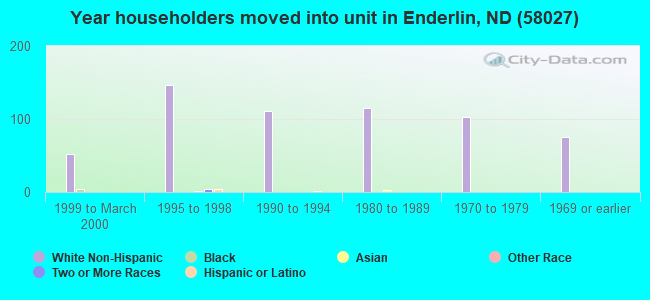
Houses and condos: 748 Renter-occupied apartments: 144
% of renters here:
20%
State:
35%
March 2022 cost of living index in zip code 58027: 80.0 (low, U.S. average is 100)
Land area: 182.6 sq. mi. Water area: 1.2 sq. mi.
Population density: 8 people per square mile
(very low).
OSM Map
General Map
Google Map
MSN Map
OSM Map
General Map
Google Map
MSN Map
OSM Map
General Map
Google Map
MSN Map
OSM Map
General Map
Google Map
MSN Map
Please wait while loading the map...
Real estate property taxes paid for housing units in 2022:
This zip code:
1.3% ($1,693)
North Dakota:
1.0% ($2,347)
Median real estate property taxes paid for housing units with mortgages in 2022: $2,256 (1.4%) Median real estate property taxes paid for housing units with no mortgage in 2022: $1,229 (1.2%)
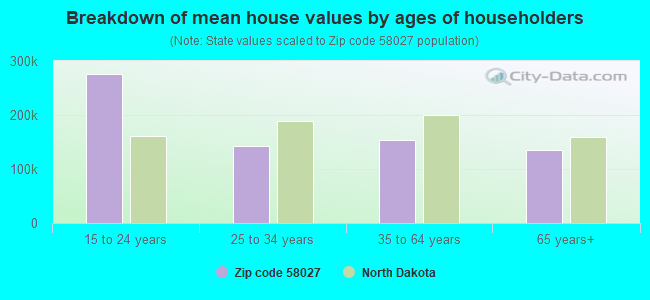
Estimated median house/condo value in 2022: $129,340
58027:
$129,340
North Dakota:
$243,100
Median resident age:
This zip code:
51.1 years
North Dakota median age:
36.2 years
Average household size:
This zip code:
2.0 people
North Dakota:
2.3 people
Averages for the 2020 tax year for zip code 58027, filed in 2021:
Average Adjusted Gross Income (AGI) in 2020: $66,738 (Individual Income Tax Returns)
Here:
$66,738
State:
$77,891
Salary/wage: $50,727 (reported on 81.2% of returns)
Here:
$50,727
State:
$59,202
(% of AGI for various income ranges: 1354.5% for AGIs below $25k, 4094.4% for AGIs $25k-50k, 6340.0% for AGIs $50k-75k, 10920.0% for AGIs $75k-100k, 23526.0% for AGIs $100k-200k)
Taxable interest for individuals: $1,452 (reported on 42.2% of returns)
This zip code:
$1,452
North Dakota:
$2,112
(% of AGI for various income ranges: 20.0% for AGIs below $25k, 65.6% for AGIs $25k-50k, 55.0% for AGIs $50k-75k, 260.0% for AGIs $75k-100k, 326.0% for AGIs $100k-200k)
Ordinary dividends: $1,882 (reported on 17.2% of returns)
Here:
$1,882
State:
$5,239
(% of AGI for various income ranges: 38.2% for AGIs below $25k, 100.0% for AGIs $50k-75k, 170.0% for AGIs $100k-200k)
Net capital gain/loss in AGI: +$8,133 (reported on 18.8% of returns)
Here:
+$8,133
State:
+$17,618
(% of AGI for various income ranges: 19.1% for AGIs below $25k, 282.5% for AGIs $50k-75k, 1458.0% for AGIs $100k-200k)
Profit/loss from business: +$4,988 (reported on 12.5% of returns)
Here:
+$4,988
State:
+$12,375
(% of AGI for various income ranges: 197.8% for AGIs $25k-50k, 142.5% for AGIs $50k-75k, 214.0% for AGIs $100k-200k)
Taxable individual retirement arrangement distribution: $10,933 (reported on 9.4% of returns)
58027:
$10,933
North Dakota:
$19,361
(% of AGI for various income ranges: 311.2% for AGIs $50k-75k, 814.0% for AGIs $100k-200k)
Earned income credit: $2,683 (reported on 9.4% of returns)
Here:
$2,683
State:
$2,120
(% of AGI for various income ranges: 87.3% for AGIs below $25k, 72.2% for AGIs $25k-50k)
Percentage of individuals using paid preparers for their 2020 taxes: 93.8%
Here:
94%
State:
95%
(% for various income ranges: 88.9% for AGIs below $25k, 100.0% for AGIs $25k-50k, 91.7% for AGIs $50k-75k, 100.0% for AGIs $75k-100k, 108.3% for AGIs $100k-200k, 0.0% for AGIs over 200k)
Averages for the 2012 tax year for zip code 58027, filed in 2013:
Average Adjusted Gross Income (AGI) in 2012: $55,822 (Individual Income Tax Returns)
Here:
$55,822
State:
$70,683
Salary/wage: $40,590 (reported on 85.3% of returns)
Here:
$40,590
State:
$48,615
(% of AGI for various income ranges: 78.5% for AGIs below $25k, 73.0% for AGIs $25k-50k, 74.2% for AGIs $50k-75k, 71.1% for AGIs $75k-100k, 43.1% for AGIs $100k-200k)
Taxable interest for individuals: $1,537 (reported on 39.7% of returns)
This zip code:
$1,537
North Dakota:
$1,659
(% of AGI for various income ranges: 1.7% for AGIs below $25k, 1.7% for AGIs $25k-50k, 1.0% for AGIs $50k-75k, 0.7% for AGIs $75k-100k, 1.0% for AGIs $100k-200k)
Ordinary dividends: $850 (reported on 20.6% of returns)
Here:
$850
State:
$4,855
(% of AGI for various income ranges: 0.8% for AGIs $25k-50k, 0.4% for AGIs $50k-75k, 0.1% for AGIs $75k-100k, 0.2% for AGIs $100k-200k)
Net capital gain/loss in AGI: +$8,154 (reported on 19.1% of returns)
Here:
+$8,154
State:
+$26,078
(% of AGI for various income ranges: 2.3% for AGIs $50k-75k, 2.5% for AGIs $75k-100k, 4.9% for AGIs $100k-200k)
Profit/loss from business: +$6,533 (reported on 13.2% of returns)
Here:
+$6,533
State:
+$14,112
(% of AGI for various income ranges: 9.4% for AGIs below $25k, 0.8% for AGIs $50k-75k, 3.6% for AGIs $75k-100k)
Taxable individual retirement arrangement distribution: $5,357 (reported on 10.3% of returns)
58027:
$5,357
North Dakota:
$12,079
Total itemized deductions: $15,620 (17% of AGI, reported on 14.7% of returns)
Here:
$15,620
State:
$22,515
Here:
16.7% of AGI
State:
13.2% of AGI
(% of AGI for various income ranges: 7.2% for AGIs $25k-50k, 7.9% for AGIs $50k-75k, 3.9% for AGIs $100k-200k)
Charity contributions: $3,500 (reported on 8.8% of returns)
Here:
$3,500
State:
$5,593
Taxes paid: $3,020 (reported on 14.7% of returns)
58027:
$3,020
State:
$6,844
(% of AGI for various income ranges: 0.6% for AGIs $25k-50k, 1.1% for AGIs $50k-75k, 1.3% for AGIs $100k-200k)
Earned income credit: $2,100 (reported on 13.2% of returns)
Here:
$2,100
State:
$1,989
(% of AGI for various income ranges: 4.9% for AGIs below $25k, 1.0% for AGIs $25k-50k)
Percentage of individuals using paid preparers for their 2012 taxes: 67.6%
Here:
68%
State:
59%
(% for various income ranges: 59.1% for AGIs below $25k, 62.5% for AGIs $25k-50k, 75.0% for AGIs $50k-75k, 77.8% for AGIs $75k-100k, 77.8% for AGIs $100k-200k)
Averages for the 2004 tax year for zip code 58027, filed in 2005:
Average Adjusted Gross Income (AGI) in 2004: $35,915 (Individual Income Tax Returns)
Here:
$35,915
State:
$40,108
Salary/wage: $32,100 (reported on 83.0% of returns)
Here:
$32,100
State:
$33,868
(% of AGI for various income ranges: 127.7% for AGIs below $10k, 66.3% for AGIs $10k-25k, 71.7% for AGIs $25k-50k, 75.2% for AGIs $50k-75k, 77.7% for AGIs $75k-100k, 74.1% for AGIs over 100k)
Taxable interest for individuals: $1,419 (reported on 58.3% of returns)
This zip code:
$1,419
North Dakota:
$1,652
(% of AGI for various income ranges: 7.6% for AGIs below $10k, 5.1% for AGIs $10k-25k, 2.2% for AGIs $25k-50k, 2.4% for AGIs $50k-75k, 0.9% for AGIs $75k-100k, 1.1% for AGIs over 100k)
Taxable dividends: $945 (reported on 24.1% of returns)
Here:
$945
State:
$2,207
(% of AGI for various income ranges: 3.8% for AGIs below $10k, 1.6% for AGIs $10k-25k, 0.7% for AGIs $25k-50k, 0.2% for AGIs $50k-75k, 0.0% for AGIs $75k-100k, 0.6% for AGIs over 100k)
Net capital gain/loss: +$4,331 (reported on 23.8% of returns)
Here:
+$4,331
State:
+$6,573
(% of AGI for various income ranges: 4.6% for AGIs below $10k, 2.1% for AGIs $10k-25k, 1.0% for AGIs $25k-50k, 3.1% for AGIs $50k-75k, 2.3% for AGIs $75k-100k, 7.1% for AGIs over 100k)
Profit/loss from business: +$4,168 (reported on 13.9% of returns)
Here:
+$4,168
State:
+$8,636
(% of AGI for various income ranges: 8.4% for AGIs below $10k, 3.7% for AGIs $10k-25k, 4.0% for AGIs $25k-50k, -0.6% for AGIs $50k-75k, 0.3% for AGIs $75k-100k)
Profit/loss from farming: +$1,485 (reported on 14.5% of returns)
Here:
+$1,485
State:
+$1,979
(% of AGI for various income ranges: -30.5% for AGIs below $10k, 1.0% for AGIs $10k-25k, 1.8% for AGIs $25k-50k, 3.9% for AGIs $50k-75k, -2.7% for AGIs $75k-100k)
IRA payment deduction: $2,125 (reported on 4.7% of returns)
58027:
$2,125
North Dakota:
$2,969
Total itemized deductions: $16,230 (27% of AGI, reported on 10.8% of returns)
Here:
$16,230
State:
$16,683
Here:
26.9% of AGI
State:
18.6% of AGI
(% of AGI for various income ranges: 8.8% for AGIs $10k-25k, 4.2% for AGIs $25k-50k, 4.9% for AGIs $50k-75k, 7.8% for AGIs $75k-100k)
Charity contributions deductions: $1,603 (3% of AGI, reported on 9.2% of returns)
Here:
$1,603
State:
$3,523
Here:
3.0% of AGI
State:
3.6% of AGI
(% of AGI for various income ranges: 0.7% for AGIs $10k-25k, 0.7% for AGIs $25k-50k, 0.2% for AGIs $50k-75k, 0.5% for AGIs $75k-100k)
Total tax: $4,627 (reported on 77.2% of returns)
58027:
$4,627
State:
$5,748
(% of AGI for various income ranges: 4.8% for AGIs below $10k, 5.0% for AGIs $10k-25k, 8.0% for AGIs $25k-50k, 9.2% for AGIs $50k-75k, 12.2% for AGIs $75k-100k, 16.7% for AGIs over 100k)
Earned income credit: $1,468 (reported on 11.5% of returns)
Here:
$1,468
State:
$1,558
Percentage of individuals using paid preparers for their 2004 taxes: 72.5%
Here:
73%
State:
63%
(% for various income ranges: 56.4% for AGIs below $10k, 74.1% for AGIs $10k-25k, 76.0% for AGIs $25k-50k, 79.0% for AGIs $50k-75k, 78.8% for AGIs $75k-100k, 81.5% for AGIs over 100k)
Household received Food Stamps/SNAP in the past 12 months: 53 Household did not receive Food Stamps/SNAP in the past 12 months: 643
Women who had a birth in the past 12 months: 27 (17 now married, 8 unmarried) Women who did not have a birth in the past 12 months: 181 (89 now married, 91 unmarried)
Housing units in zip code 58027 with a mortgage: 252 (25 second mortgage, 19 both second mortgage and home equity loan) Median monthly owner costs for units with a mortgage: $1,394 Median monthly owner costs for units without a mortgage: $482
Residents with income below the poverty level in 2022:
This zip code:
7.1%
Whole state:
11.5%
Residents with income below 50% of the poverty level in 2022:
This zip code:
5.1%
Whole state:
5.9%
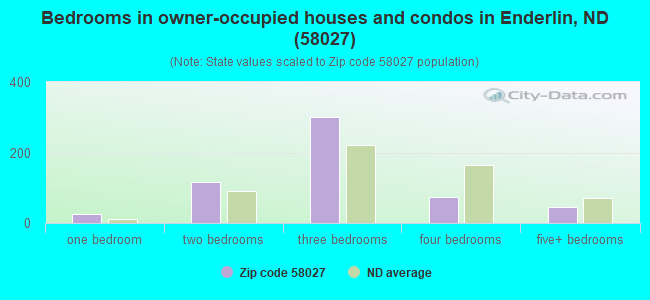
Median number of rooms in houses and condos:
Here:
6.5
State:
7.0
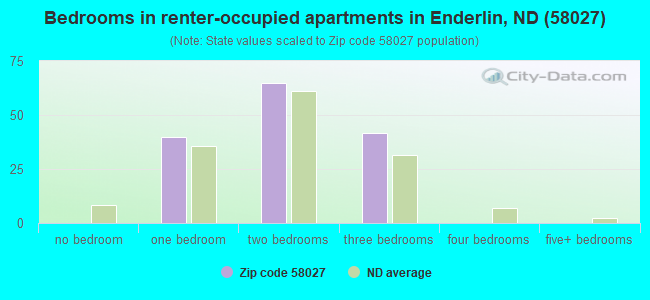
Median number of rooms in apartments:
Here:
4.1
State:
4.0
Notable locations in this zip code not listed on our city pages
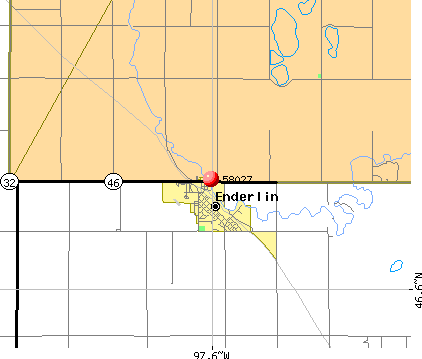
Notable locations in zip code 58027: Liberty Town Hall (A), Moore Town Hall (B), Enderlin Fire Protection District Station (C), Pontiac Town Hall (D), Raritan Town Hall (E). Display/hide their locations on the map
In group quarters: 83 (-1 institutionalized population)
Size of family households: 221 2-persons, 44 3-persons, 48 4-persons, 49 5-persons, 12 6-persons
Size of nonfamily households: 271 1-person, 44 2-persons
156 married couples with children.
62 single-parent households (6 men, 56 women).
95.6% of residents of 58027 zip code speak English at home.
0.5% of residents speak Spanish at home (100% very well).
2.9% of residents speak other Indo-European language at home (57% very well, 25% well, 18% not well).
0.6% of residents speak Asian or Pacific Island language at home (100% very well).
0.1% of residents speak other language at home (100% very well).
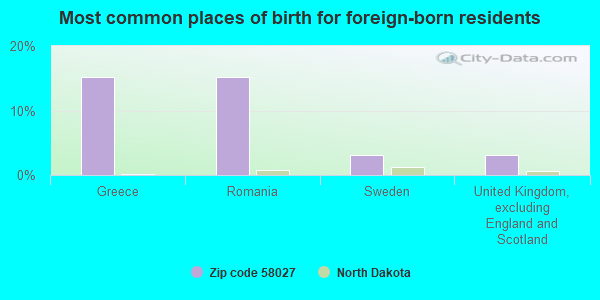
Foreign born population: 34 (2.4%) (75.2% of them are naturalized citizens)
This zip code:
2.4%
Whole state:
4.9%
15%Greece
15%Romania
3%Sweden
3%United Kingdom, excluding England and Scotland
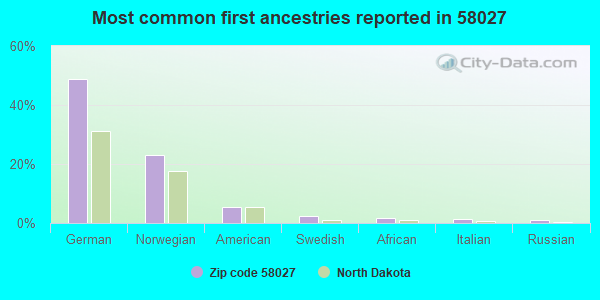
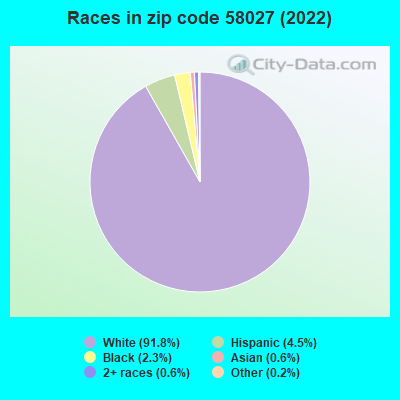
49%German
23%Norwegian
6%American
2%Swedish
2%African
1%Italian
1%Russian
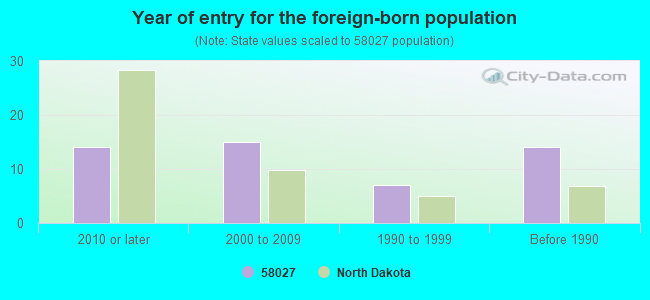
Year of entry for the foreign-born population
142010 or later
152000 to 2009
71990 to 1999
14Before 1990
Facilities with environmental interests located in this zip code:
NORTHERN SUN DIVISION (5525 136TH AVENUE SOUTHEAST in ENDERLIN, ND)
AIR MAJOR (AIRS/AFS) (Integrated Compliance Information System) - ICIS-08-2002-0045, FORMAL ENFORCEMENT ACTION ENFORCEMENT/COMPLIANCE ACTIVITY (Integrated Compliance Information System) CRITERIA AND HAZARDOUS AIR POLLUTANT INVENTORY (Inventory of air pollution sources) Small Quantity Generators, between 100 kg and 1000 kg of hazardous waste/month (Resource Conservation and Recovery Act (tracking hazardous waste)) - notification TRI REPORTER (Tracking of toxic chemicals releasing facilities) Business SIC classification: VEGETABLE OIL MILLS, EXCEPT CORN, COTTONSEED, AND SOYBEAN; ELECTRIC SERVICES Business NAICS classification: SOYBEAN PROCESSING.; OTHER OILSEED PROCESSING.; DRIED AND DEHYDRATED FOOD MANUFACTURING. Organizations: ARCHER DANIELS MIDLAND (CONTACT/OPERATOR)
Alternative names: ADM NORTHERN SUN DIV., ARCHER DANIELS MIDLAND, ARCHER DANIELS MIDLAND NORTHERN SUN DIVISION, NORTHERN SUN, A DIVISION OF ADM, NORTHERN SUN/ADM, NORTHERN SUN (DIVISION OF ADM), NORTHERN SUN (DIV. OF ADM) OIL SEED PRO, NORTHERN SUN INDUSTRIES
ENDERLIN ELEMENTARY SCHOOL (410 BLUFF ST in ENDERLIN, ND)
(National Center for Education Statistics) - STATE ID-23871 Organizations: ENDERLIN 22 (SCHOOL DISTRICT)
ENDERLIN HIGH SCHOOL (410 BLUFF ST in ENDERLIN, ND)
(National Center for Education Statistics) - STATE ID-23873 Organizations: ENDERLIN 22 (SCHOOL DISTRICT)
ENDERLIN MIDDLE SCHOOL (410 BLUFF ST in ENDERLIN, ND)
(National Center for Education Statistics) - STATE ID-23872 Organizations: ENDERLIN 22 (SCHOOL DISTRICT)
AT&T CORPORATION - ENDERLIN (4 MILES WEST in ENDERLIN, ND)
(Resource Conservation and Recovery Act (tracking hazardous waste)) Organizations: AMERICAN TEL & TEL CO LONG LIN (CONTACT/OWNER)
ENDERLIN, CITY OF (211 4TH AVENUE in ENDERLIN, ND)
National Pollutant Discharge Elimination System NON-MAJOR (Tracking pollutant discharge elimination systems) - permit Business SIC classification: SEWERAGE SYSTEMS
ENDERLIN SCHOOL DISTRICT # 22 (410 BLUFF STREET in ENDERLIN, ND)
ENFORCEMENT/COMPLIANCE ACTIVITY (Integrated Compliance Information System) COMPLIANCE ACTIVITY (Tracking inspections of insecticide, fungicide, and rodenticide, and toxic substances)
NATIONAL SUN INDUSTRIES, INCORPORATED (FEENEY DRIVE in ENDERLIN, ND)
COMPLIANCE ACTIVITY (Tracking inspections of insecticide, fungicide, and rodenticide, and toxic substances)
Housing units lacking complete plumbing facilities: 4.7% Housing units lacking complete kitchen facilities: 4.1%
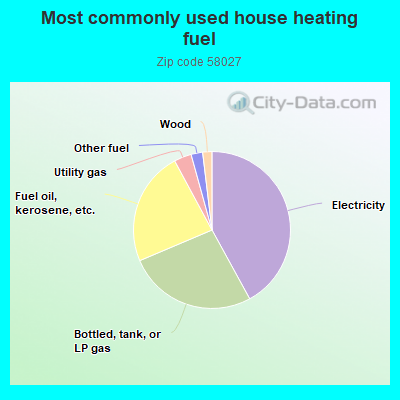
42.2%Electricity
26.7%Bottled, tank, or LP gas
23.6%Fuel oil, kerosene, etc.
3.6%Utility gas
2.4%Other fuel
1.9%Wood
Population in 1990: 1,732.
Place of birth for U.S.-born residents:
This state: 952
Northeast: 28
Midwest: 317
South: 49
West: 49
69% of the 58027 zip code residents lived in the same house 5 years ago. Out of people who lived in different houses, 36% lived in this county. Out of people who lived in different counties, 50% lived in North Dakota.
95% of the 58027 zip code residents lived in the same house 1 year ago. Out of people who lived in different houses, 51% moved from this county. Out of people who lived in different houses, 12% moved from different county within same state. Out of people who lived in different houses, 49% moved from different state. Out of people who lived in different houses, 6% moved from abroad.
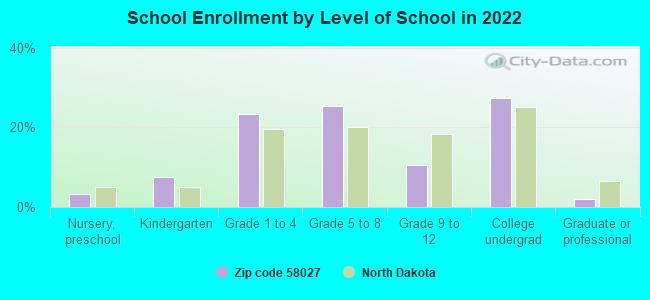
Private vs. public school enrollment:
Students in private schools in grades 1 to 8 (elementary and middle school): 4
Here:
4.2%
North Dakota:
8.4%
Students in private schools in grades 9 to 12 (high school):
Here:
0.0%
North Dakota:
8.2%
Students in private undergraduate colleges:
Here:
0.0%
North Dakota:
14.3%
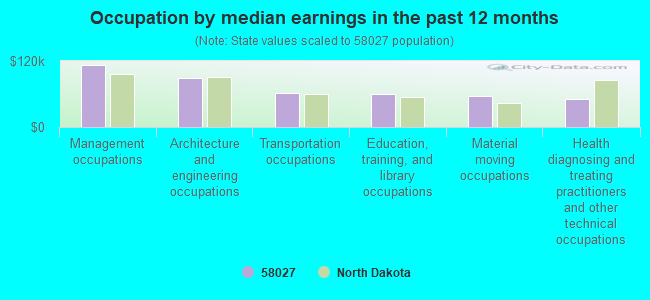
Occupation by median earnings in the past 12 months ($)
112,394Management occupations
89,933Architecture and engineering occupations
62,121Transportation occupations
60,856Education, training, and library occupations
55,897Material moving occupations
51,156Health diagnosing and treating practitioners and other technical occupations
Top industries in this zip code by the number of employees in 2005:
Health Care and Social Assistance: Nursing Care Facilities (50-99 employees: 1 establishment)
Other Services (except Public Administration): Civic and Social Organizations (20-49: 1, 1-4: 2)
Construction: Plumbing, Heating, and Air-Conditioning Contractors (20-49: 1, 1-4: 2)
Wholesale Trade: Grain and Field Bean Merchant Wholesalers (20-49: 1)
Other Services (except Public Administration): Religious Organizations (5-9: 2, 1-4: 2)
Finance and Insurance: Commercial Banking (10-19: 1)
People in group quarters in 2010:
54 people in nursing facilities/skilled-nursing facilities
People in group quarters in 2000:
52 people in nursing homes
Home Mortgage Disclosure Act Aggregated Statistics For Year 2009 (Based on 2 partial tracts)
A) FHA, FSA/RHS & VA Home Purchase Loans
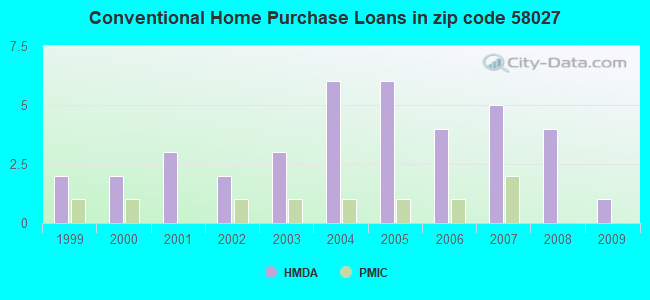
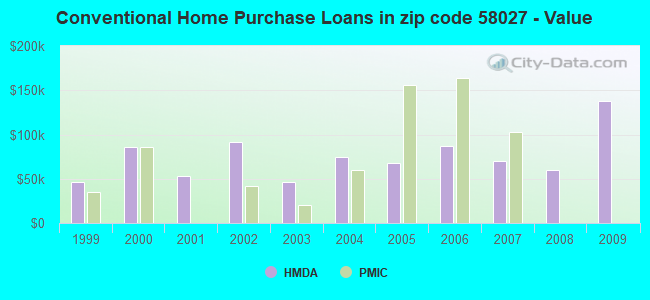
B) Conventional Home Purchase Loans
C) Refinancings
D) Home Improvement Loans
F) Non-occupant Loans on < 5 Family Dwellings (A B C & D)
Number
Average Value
Number
Average Value
Number
Average Value
Number
Average Value
Number
Average Value
LOANS ORIGINATED
3
$100,187
1
$137,450
9
$101,078
1
$67,340
1
$33,950
APPLICATIONS APPROVED, NOT ACCEPTED
0
$0
0
$0
1
$25,390
0
$0
0
$0
APPLICATIONS DENIED
0
$0
1
$83,900
2
$108,330
0
$0
0
$0
APPLICATIONS WITHDRAWN
0
$0
0
$0
1
$116,470
0
$0
0
$0
FILES CLOSED FOR INCOMPLETENESS
0
$0
0
$0
1
$130,550
0
$0
0
$0
Aggregated Statistics For Year 2008 (Based on 2 partial tracts)
A) FHA, FSA/RHS & VA Home Purchase Loans
B) Conventional Home Purchase Loans
C) Refinancings
D) Home Improvement Loans
F) Non-occupant Loans on < 5 Family Dwellings (A B C & D)
G) Loans On Manufactured Home Dwelling (A B C & D)
Number
Average Value
Number
Average Value
Number
Average Value
Number
Average Value
Number
Average Value
Number
Average Value
LOANS ORIGINATED
3
$95,403
4
$59,340
7
$90,016
1
$73,690
2
$81,835
1
$61,000
APPLICATIONS APPROVED, NOT ACCEPTED
0
$0
0
$0
2
$39,470
0
$0
0
$0
0
$0
APPLICATIONS DENIED
0
$0
1
$105,980
2
$66,790
1
$40,570
0
$0
0
$0
APPLICATIONS WITHDRAWN
0
$0
1
$54,100
1
$24,010
0
$0
0
$0
1
$6,070
FILES CLOSED FOR INCOMPLETENESS
0
$0
0
$0
0
$0
0
$0
0
$0
0
$0
Aggregated Statistics For Year 2007 (Based on 2 partial tracts)
A) FHA, FSA/RHS & VA Home Purchase Loans
B) Conventional Home Purchase Loans
C) Refinancings
D) Home Improvement Loans
F) Non-occupant Loans on < 5 Family Dwellings (A B C & D)
G) Loans On Manufactured Home Dwelling (A B C & D)
Number
Average Value
Number
Average Value
Number
Average Value
Number
Average Value
Number
Average Value
Number
Average Value
LOANS ORIGINATED
1
$97,430
5
$70,600
6
$79,672
2
$69,275
0
$0
1
$33,950
APPLICATIONS APPROVED, NOT ACCEPTED
0
$0
0
$0
1
$40,300
0
$0
0
$0
0
$0
APPLICATIONS DENIED
1
$87,490
1
$109,020
3
$70,197
2
$57,820
0
$0
0
$0
APPLICATIONS WITHDRAWN
0
$0
0
$0
1
$77,560
1
$87,770
0
$0
0
$0
FILES CLOSED FOR INCOMPLETENESS
0
$0
1
$45,820
1
$89,420
0
$0
1
$24,010
0
$0
Aggregated Statistics For Year 2006 (Based on 2 partial tracts)
A) FHA, FSA/RHS & VA Home Purchase Loans
B) Conventional Home Purchase Loans
C) Refinancings
D) Home Improvement Loans
G) Loans On Manufactured Home Dwelling (A B C & D)
Number
Average Value
Number
Average Value
Number
Average Value
Number
Average Value
Number
Average Value
LOANS ORIGINATED
1
$156,490
4
$86,870
6
$84,687
2
$36,020
1
$41,950
APPLICATIONS APPROVED, NOT ACCEPTED
0
$0
1
$140,480
3
$93,473
0
$0
0
$0
APPLICATIONS DENIED
0
$0
2
$121,165
4
$71,278
1
$58,510
1
$11,040
APPLICATIONS WITHDRAWN
0
$0
0
$0
2
$126,410
0
$0
0
$0
FILES CLOSED FOR INCOMPLETENESS
0
$0
0
$0
1
$52,720
0
$0
0
$0
Aggregated Statistics For Year 2005 (Based on 2 partial tracts)
A) FHA, FSA/RHS & VA Home Purchase Loans
B) Conventional Home Purchase Loans
C) Refinancings
D) Home Improvement Loans
F) Non-occupant Loans on < 5 Family Dwellings (A B C & D)
G) Loans On Manufactured Home Dwelling (A B C & D)
Number
Average Value
Number
Average Value
Number
Average Value
Number
Average Value
Number
Average Value
Number
Average Value
LOANS ORIGINATED
2
$106,120
6
$67,942
7
$56,699
2
$36,985
1
$68,450
1
$10,760
APPLICATIONS APPROVED, NOT ACCEPTED
0
$0
0
$0
1
$84,460
1
$17,660
0
$0
0
$0
APPLICATIONS DENIED
0
$0
1
$54,100
5
$73,692
1
$48,300
0
$0
1
$31,740
APPLICATIONS WITHDRAWN
0
$0
0
$0
2
$101,155
0
$0
0
$0
0
$0
FILES CLOSED FOR INCOMPLETENESS
0
$0
0
$0
2
$62,515
0
$0
0
$0
0
$0
Aggregated Statistics For Year 2004 (Based on 2 partial tracts)
B) Conventional Home Purchase Loans
C) Refinancings
D) Home Improvement Loans
F) Non-occupant Loans on < 5 Family Dwellings (A B C & D)
G) Loans On Manufactured Home Dwelling (A B C & D)
Number
Average Value
Number
Average Value
Number
Average Value
Number
Average Value
Number
Average Value
LOANS ORIGINATED
6
$75,027
8
$57,270
2
$20,425
1
$69,830
0
$0
APPLICATIONS APPROVED, NOT ACCEPTED
1
$72,310
1
$81,420
0
$0
0
$0
0
$0
APPLICATIONS DENIED
1
$28,700
3
$94,667
1
$53,270
0
$0
1
$9,380
APPLICATIONS WITHDRAWN
1
$98,530
2
$82,250
0
$0
0
$0
0
$0
FILES CLOSED FOR INCOMPLETENESS
0
$0
2
$70,105
0
$0
0
$0
0
$0
Aggregated Statistics For Year 2003 (Based on 2 partial tracts)
A) FHA, FSA/RHS & VA Home Purchase Loans
B) Conventional Home Purchase Loans
C) Refinancings
D) Home Improvement Loans
Number
Average Value
Number
Average Value
Number
Average Value
Number
Average Value
LOANS ORIGINATED
1
$67,620
3
$46,460
15
$70,417
1
$26,500
APPLICATIONS APPROVED, NOT ACCEPTED
0
$0
1
$40,020
1
$84,180
0
$0
APPLICATIONS DENIED
0
$0
1
$7,730
6
$68,587
1
$11,590
APPLICATIONS WITHDRAWN
0
$0
1
$97,430
2
$69,690
0
$0
FILES CLOSED FOR INCOMPLETENESS
0
$0
0
$0
0
$0
0
$0
Aggregated Statistics For Year 2002 (Based on 2 partial tracts)
A) FHA, FSA/RHS & VA Home Purchase Loans
B) Conventional Home Purchase Loans
C) Refinancings
D) Home Improvement Loans
F) Non-occupant Loans on < 5 Family Dwellings (A B C & D)
Number
Average Value
Number
Average Value
Number
Average Value
Number
Average Value
Number
Average Value
LOANS ORIGINATED
2
$66,380
2
$91,495
12
$67,758
2
$28,015
1
$47,470
APPLICATIONS APPROVED, NOT ACCEPTED
0
$0
0
$0
1
$68,170
0
$0
0
$0
APPLICATIONS DENIED
0
$0
0
$0
2
$106,535
1
$29,810
0
$0
APPLICATIONS WITHDRAWN
0
$0
0
$0
1
$103,780
0
$0
0
$0
FILES CLOSED FOR INCOMPLETENESS
0
$0
0
$0
0
$0
0
$0
0
$0
Aggregated Statistics For Year 2001 (Based on 2 partial tracts)
A) FHA, FSA/RHS & VA Home Purchase Loans
B) Conventional Home Purchase Loans
C) Refinancings
D) Home Improvement Loans
F) Non-occupant Loans on < 5 Family Dwellings (A B C & D)
Number
Average Value
Number
Average Value
Number
Average Value
Number
Average Value
Number
Average Value
LOANS ORIGINATED
1
$64,860
3
$53,083
8
$60,375
1
$31,190
1
$15,460
APPLICATIONS APPROVED, NOT ACCEPTED
0
$0
0
$0
2
$52,300
1
$19,600
0
$0
APPLICATIONS DENIED
0
$0
1
$18,490
1
$64,860
1
$21,250
0
$0
APPLICATIONS WITHDRAWN
0
$0
0
$0
2
$47,610
0
$0
0
$0
FILES CLOSED FOR INCOMPLETENESS
0
$0
0
$0
0
$0
0
$0
0
$0
Aggregated Statistics For Year 2000 (Based on 2 partial tracts)
A) FHA, FSA/RHS & VA Home Purchase Loans
B) Conventional Home Purchase Loans
C) Refinancings
D) Home Improvement Loans
Number
Average Value
Number
Average Value
Number
Average Value
Number
Average Value
LOANS ORIGINATED
2
$52,025
2
$85,700
4
$55,408
3
$12,053
APPLICATIONS APPROVED, NOT ACCEPTED
0
$0
0
$0
1
$30,910
0
$0
APPLICATIONS DENIED
0
$0
2
$24,290
1
$27,600
0
$0
APPLICATIONS WITHDRAWN
0
$0
0
$0
1
$22,080
0
$0
FILES CLOSED FOR INCOMPLETENESS
0
$0
0
$0
0
$0
0
$0
Aggregated Statistics For Year 1999 (Based on 1 partial tract)

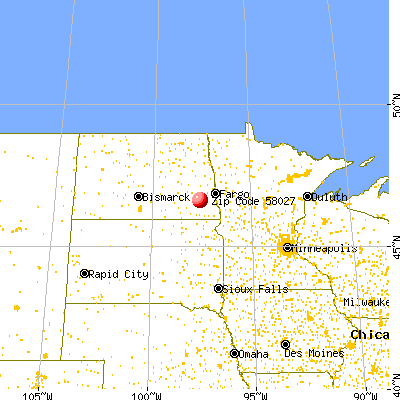


 Nearest zip codes: 58031, 58062, 58054, 58068, 58011, 58071.