Estimated zip code population in 2022: 464 Zip code population in 2010: 450 Zip code population in 2000: 531
Houses and condos: 249 Renter-occupied apartments: 44
% of renters here:
22%
State:
35%
March 2022 cost of living index in zip code 58064: 79.8 (low, U.S. average is 100)
Land area: 157.7 sq. mi. Water area: 0.1 sq. mi.
Population density: 3 people per square mile
(very low).
OSM Map
General Map
Google Map
MSN Map
OSM Map
General Map
Google Map
MSN Map
OSM Map
General Map
Google Map
MSN Map
OSM Map
General Map
Google Map
MSN Map
Please wait while loading the map...
Real estate property taxes paid for housing units in 2022:
This zip code:
0.7% ($1,837)
North Dakota:
1.0% ($2,347)
Median real estate property taxes paid for housing units with mortgages in 2022: $1,870 (1.2%) Median real estate property taxes paid for housing units with no mortgage in 2022: $1,812 (0.7%)
Business Search- 14 Million verified businesses
Males: 246
(53.1%)
Females: 217
(46.9%)
For population 25 years and over in 58064:
High school or higher: 95.7%
Bachelor's degree or higher: 26.5%
Graduate or professional degree: 4.7%
Unemployed: 5.3%
Mean travel time to work (commute): 19.0 minutes
For population 15 years and over in 58064:
Never married: 16.3%
Now married: 64.5%
Separated: 0.7%
Widowed: 13.5%
Divorced: 5.0%
Zip code 58064 compared to state average:
Unemployed percentage above state average.
Black race population percentage significantly below state average.
Hispanic race population percentage significantly below state average.
Foreign-born population percentage significantly below state average.
Renting percentage below state average.
Length of stay since moving in significantly above state average.
Number of rooms per house above state average.
House age above state average.
Number of college students significantly below state average.
Estimated median house/condo value in 2022: $262,548
58064:
$262,548
North Dakota:
$243,100
Median resident age:
This zip code:
38.7 years
North Dakota median age:
36.2 years
Average household size:
This zip code:
2.3 people
North Dakota:
2.3 people
Averages for the 2020 tax year for zip code 58064, filed in 2021:
Average Adjusted Gross Income (AGI) in 2020: $95,162 (Individual Income Tax Returns)
Here:
$95,162
State:
$77,891
Salary/wage: $44,781 (reported on 76.2% of returns)
Here:
$44,781
State:
$59,202
(% of AGI for various income ranges: 1306.7% for AGIs below $25k, 5405.0% for AGIs $25k-50k, 4338.0% for AGIs $50k-75k)
Taxable interest for individuals: $1,012 (reported on 38.1% of returns)
This zip code:
$1,012
North Dakota:
$2,112
(% of AGI for various income ranges: 28.0% for AGIs $50k-75k)
Ordinary dividends: $5,750 (reported on 19.0% of returns)
Here:
$5,750
State:
$5,239
(% of AGI for various income ranges: )
Net capital gain/loss in AGI: +$18,740 (reported on 23.8% of returns)
Here:
+$18,740
State:
+$17,618
(% of AGI for various income ranges: )
Profit/loss from business: +$3,400 (reported on 9.5% of returns)
Here:
+$3,400
State:
+$12,375
(% of AGI for various income ranges: 340.0% for AGIs $25k-50k)
Percentage of individuals using paid preparers for their 2020 taxes: 100.0%
Here:
100%
State:
95%
(% for various income ranges: 100.0% for AGIs below $25k, 100.0% for AGIs $25k-50k, 100.0% for AGIs $50k-75k, 140.0% for AGIs $100k-200k, 0.0% for AGIs over 200k)
Averages for the 2012 tax year for zip code 58064, filed in 2013:
Average Adjusted Gross Income (AGI) in 2012: $87,805 (Individual Income Tax Returns)
Here:
$87,805
State:
$70,683
Salary/wage: $33,822 (reported on 85.7% of returns)
Here:
$33,822
State:
$48,615
(% of AGI for various income ranges: 72.5% for AGIs below $25k, 72.3% for AGIs $25k-50k, 96.1% for AGIs $50k-75k, 19.7% for AGIs $100k-200k)
Taxable interest for individuals: $755 (reported on 52.4% of returns)
This zip code:
$755
North Dakota:
$1,659
(% of AGI for various income ranges: 2.0% for AGIs below $25k, 0.2% for AGIs $50k-75k, 0.5% for AGIs $100k-200k)
Ordinary dividends: $7,675 (reported on 19.0% of returns)
Here:
$7,675
State:
$4,855
Net capital gain/loss in AGI: +$7,075 (reported on 19.0% of returns)
Here:
+$7,075
State:
+$26,078
Profit/loss from business: +$2,300 (reported on 9.5% of returns)
Here:
+$2,300
State:
+$14,112
Total itemized deductions: $21,800 (7% of AGI, reported on 9.5% of returns)
Here:
$21,800
State:
$22,515
Here:
6.8% of AGI
State:
13.2% of AGI
(% of AGI for various income ranges: 50.8% for AGIs below $25k)
Taxes paid: $8,300 (reported on 9.5% of returns)
58064:
$8,300
State:
$6,844
Earned income credit: $2,050 (reported on 9.5% of returns)
Here:
$2,050
State:
$1,989
(% of AGI for various income ranges: 4.8% for AGIs below $25k)
Percentage of individuals using paid preparers for their 2012 taxes: 71.4%
Here:
71%
State:
59%
(% for various income ranges: 57.1% for AGIs below $25k, 50.0% for AGIs $25k-50k, 133.3% for AGIs $50k-75k, 100.0% for AGIs $100k-200k)
Averages for the 2004 tax year for zip code 58064, filed in 2005:
Average Adjusted Gross Income (AGI) in 2004: $49,804 (Individual Income Tax Returns)
Here:
$49,804
State:
$40,108
Salary/wage: $26,070 (reported on 77.9% of returns)
Here:
$26,070
State:
$33,868
(% of AGI for various income ranges: 83.9% for AGIs below $10k, 63.1% for AGIs $10k-25k, 58.7% for AGIs $25k-50k, 50.5% for AGIs $50k-75k, 50.7% for AGIs $75k-100k, 16.8% for AGIs over 100k)
Taxable interest for individuals: $1,874 (reported on 62.9% of returns)
This zip code:
$1,874
North Dakota:
$1,652
(% of AGI for various income ranges: 7.6% for AGIs below $10k, 5.6% for AGIs $10k-25k, 0.6% for AGIs $25k-50k, 3.8% for AGIs $50k-75k, 0.4% for AGIs $75k-100k, 2.2% for AGIs over 100k)
Taxable dividends: $1,478 (reported on 27.9% of returns)
Here:
$1,478
State:
$2,207
(% of AGI for various income ranges: 1.1% for AGIs $10k-25k, 0.8% for AGIs $50k-75k, 0.5% for AGIs $75k-100k, 1.4% for AGIs over 100k)
Net capital gain/loss: +$5,016 (reported on 25.8% of returns)
Here:
+$5,016
State:
+$6,573
Profit/loss from business: +$929 (reported on 11.7% of returns)
Here:
+$929
State:
+$8,636
Profit/loss from farming: +$38,780 (reported on 20.8% of returns)
Here:
+$38,780
State:
+$1,979
Total itemized deductions: $16,962 (18% of AGI, reported on 10.8% of returns)
Here:
$16,962
State:
$16,683
Here:
18.1% of AGI
State:
18.6% of AGI
Charity contributions deductions: $3,182 (3% of AGI, reported on 9.2% of returns)
Here:
$3,182
State:
$3,523
Here:
3.1% of AGI
State:
3.6% of AGI
Total tax: $8,438 (reported on 83.8% of returns)
58064:
$8,438
State:
$5,748
(% of AGI for various income ranges: 3.8% for AGIs below $10k, 4.2% for AGIs $10k-25k, 9.5% for AGIs $25k-50k, 11.2% for AGIs $50k-75k, 11.3% for AGIs $75k-100k, 21.6% for AGIs over 100k)
Earned income credit: $1,833 (reported on 5.0% of returns)
Here:
$1,833
State:
$1,558
Percentage of individuals using paid preparers for their 2004 taxes: 75.4%
Here:
75%
State:
63%
(% for various income ranges: 69.8% for AGIs below $10k, 70.9% for AGIs $10k-25k, 76.7% for AGIs $25k-50k, 75.6% for AGIs $50k-75k, 70.6% for AGIs $75k-100k, 95.8% for AGIs over 100k)
Household received Food Stamps/SNAP in the past 12 months: 5 Household did not receive Food Stamps/SNAP in the past 12 months: 192
Women who had a birth in the past 12 months: 6 (2 now married, 3 unmarried) Women who did not have a birth in the past 12 months: 70 (56 now married, 14 unmarried)
Housing units in zip code 58064 with a mortgage: 46 (3 second mortgage, 2 both second mortgage and home equity loan) Houses without a mortgage: 2
Median monthly owner costs for units with a mortgage: $1,393 Median monthly owner costs for units without a mortgage: $811
Residents with income below the poverty level in 2022:
This zip code:
12.1%
Whole state:
11.5%
Residents with income below 50% of the poverty level in 2022:
This zip code:
2.8%
Whole state:
5.9%
Median number of rooms in houses and condos:
Here:
7.2
State:
7.0
Median number of rooms in apartments:
Here:
6.0
State:
4.0
Notable locations in this zip code not listed on our city pages
Notable locations in zip code 58064: Page Ambulance Service (A), Page Fire Protection District (B), Rochester Town Hall (C). Display/hide their locations on the map
Size of family households: 54 2-persons, 17 3-persons, 19 4-persons, 11 5-persons, 1 6-persons, 8 7-or-more-persons
Size of nonfamily households: 68 1-person, 16 2-persons
120 married couples with children.
6 single-parent households (6 women).
91.5% of residents of 58064 zip code speak English at home.
0.2% of residents speak Spanish at home (100% well).
7.6% of residents speak other Indo-European language at home (100% very well).
0.5% of residents speak other language at home (100% very well).
Foreign born population: 3 (0.7%) (100.0% of them are naturalized citizens)
This zip code:
0.7%
Whole state:
4.9%
39%German
24%Norwegian
7%American
4%Scandinavian
3%Irish
2%Scottish
1%Czech
Year of entry for the foreign-born population
02010 or later
02000 to 2009
01990 to 1999
5Before 1990
Facilities with environmental interests located in this zip code:
PAGE ELEMENTARY SCHOOL (630 MAY AVE in PAGE, ND)
(National Center for Education Statistics) - STATE ID-68821 Organizations: PAGE 80 (SCHOOL DISTRICT)
PAGE CITY OF ( in PAGE, ND)
National Pollutant Discharge Elimination System NON-MAJOR (Tracking pollutant discharge elimination systems) - permit Business SIC classification: SEWERAGE SYSTEMS
PAGE CLEANERS (MAIN STREET in PAGE, ND)
Conditionally Exempt Small Quantity Generators, less than 100 kg/month of hazardous waste (Resource Conservation and Recovery Act (tracking hazardous waste)) - notification Organizations: BRAD AND HOLLY SATROM (CONTACT/OWNER)
PAGE SCHOOL DISTRICT 80 (630 MAY AVENUE/P.O. BOX 26 in PAGE, ND)
COMPLIANCE ACTIVITY (Tracking inspections of insecticide, fungicide, and rodenticide, and toxic substances)
Housing units lacking complete plumbing facilities: 1.4% Housing units lacking complete kitchen facilities: 1.3%
61.3%Bottled, tank, or LP gas
26.4%Electricity
10.0%Fuel oil, kerosene, etc.
2.1%Other fuel
0.5%Utility gas
0.5%Wood
Population in 1990: 586.
Place of birth for U.S.-born residents:
This state: 378
Northeast: 2
Midwest: 58
South: 5
West: 13
76% of the 58064 zip code residents lived in the same house 5 years ago. Out of people who lived in different houses, 57% lived in this county. Out of people who lived in different counties, 50% lived in North Dakota.
99% of the 58064 zip code residents lived in the same house 1 year ago. Out of people who lived in different houses, 167% moved from this county. Out of people who lived in different houses, 33% moved from different county within same state.
Private vs. public school enrollment:
Students in private schools in grades 1 to 8 (elementary and middle school): 4
Here:
6.6%
North Dakota:
8.4%
Students in private schools in grades 9 to 12 (high school):
Here:
0.0%
North Dakota:
8.2%
Students in private undergraduate colleges:
Here:
0.0%
North Dakota:
14.3%
Occupation by median earnings in the past 12 months ($)
77,114Transportation occupations
76,448Management occupations
63,363Installation, maintenance, and repair occupations
53,547Health diagnosing and treating practitioners and other technical occupations
53,107Health technologists and technicians
53,011Farming, fishing, and forestry occupations
Top industries in this zip code by the number of employees in 2005:
Accommodation and Food Services: Full-Service Restaurants (10-19 employees: 1 establishment)
Construction: Commercial and Institutional Building Construction (10-19: 1)
Finance and Insurance: Credit Unions (5-9: 1)
Wholesale Trade: Grain and Field Bean Merchant Wholesalers (5-9: 1)
Other Services (except Public Administration): Religious Organizations (1-4: 1)
Accommodation and Food Services: Drinking Places (Alcoholic Beverages) (1-4: 1)
Other Services (except Public Administration): Automotive Body, Paint, and Interior Repair and Maintenance (1-4: 1)
Professional, Scientific, and Technical Services: Offices of Lawyers (1-4: 1)
Fatal accident statistics in 2013:
Fatal accident count: 1
Vehicles involved in fatal accidents: 1
Fatal accidents caused by drunken drivers: 0
Fatalities: 1
Persons involved in fatal accidents: 1
Pedestrians involved in fatal accidents: 0
Home Mortgage Disclosure Act Aggregated Statistics For Year 2009 (Based on 2 partial tracts)
A) FHA, FSA/RHS & VA Home Purchase Loans
B) Conventional Home Purchase Loans
C) Refinancings
D) Home Improvement Loans
F) Non-occupant Loans on < 5 Family Dwellings (A B C & D)
Number
Average Value
Number
Average Value
Number
Average Value
Number
Average Value
Number
Average Value
LOANS ORIGINATED
5
$105,110
1
$240,330
15
$106,043
2
$58,875
2
$29,680
APPLICATIONS APPROVED, NOT ACCEPTED
0
$0
0
$0
1
$44,400
0
$0
0
$0
APPLICATIONS DENIED
0
$0
2
$73,355
4
$94,710
0
$0
0
$0
APPLICATIONS WITHDRAWN
0
$0
0
$0
2
$101,830
0
$0
0
$0
FILES CLOSED FOR INCOMPLETENESS
0
$0
0
$0
1
$228,270
0
$0
0
$0
Aggregated Statistics For Year 2008 (Based on 2 partial tracts)
A) FHA, FSA/RHS & VA Home Purchase Loans
B) Conventional Home Purchase Loans
C) Refinancings
D) Home Improvement Loans
F) Non-occupant Loans on < 5 Family Dwellings (A B C & D)
G) Loans On Manufactured Home Dwelling (A B C & D)
Number
Average Value
Number
Average Value
Number
Average Value
Number
Average Value
Number
Average Value
Number
Average Value
LOANS ORIGINATED
5
$100,092
7
$59,291
12
$91,815
2
$64,425
3
$95,393
2
$53,325
APPLICATIONS APPROVED, NOT ACCEPTED
0
$0
0
$0
3
$46,007
0
$0
0
$0
0
$0
APPLICATIONS DENIED
0
$0
2
$92,660
3
$77,860
2
$35,470
0
$0
0
$0
APPLICATIONS WITHDRAWN
0
$0
2
$47,295
1
$41,990
0
$0
0
$0
1
$10,620
FILES CLOSED FOR INCOMPLETENESS
0
$0
0
$0
0
$0
0
$0
0
$0
0
$0
Aggregated Statistics For Year 2007 (Based on 2 partial tracts)
A) FHA, FSA/RHS & VA Home Purchase Loans
B) Conventional Home Purchase Loans
C) Refinancings
D) Home Improvement Loans
F) Non-occupant Loans on < 5 Family Dwellings (A B C & D)
G) Loans On Manufactured Home Dwelling (A B C & D)
Number
Average Value
Number
Average Value
Number
Average Value
Number
Average Value
Number
Average Value
Number
Average Value
LOANS ORIGINATED
2
$85,180
8
$77,156
10
$83,586
4
$60,568
0
$0
1
$59,360
APPLICATIONS APPROVED, NOT ACCEPTED
0
$0
0
$0
2
$35,230
0
$0
0
$0
0
$0
APPLICATIONS DENIED
1
$152,980
2
$95,315
5
$73,644
3
$67,403
0
$0
0
$0
APPLICATIONS WITHDRAWN
0
$0
0
$0
1
$135,610
1
$153,470
0
$0
0
$0
FILES CLOSED FOR INCOMPLETENESS
0
$0
1
$80,110
2
$78,180
0
$0
1
$41,990
0
$0
Aggregated Statistics For Year 2006 (Based on 2 partial tracts)
A) FHA, FSA/RHS & VA Home Purchase Loans
B) Conventional Home Purchase Loans
C) Refinancings
D) Home Improvement Loans
G) Loans On Manufactured Home Dwelling (A B C & D)
Number
Average Value
Number
Average Value
Number
Average Value
Number
Average Value
Number
Average Value
LOANS ORIGINATED
2
$136,815
6
$101,265
10
$88,847
3
$41,987
1
$73,360
APPLICATIONS APPROVED, NOT ACCEPTED
0
$0
2
$122,820
5
$98,064
0
$0
0
$0
APPLICATIONS DENIED
0
$0
4
$105,930
7
$71,219
2
$51,155
1
$19,300
APPLICATIONS WITHDRAWN
0
$0
0
$0
4
$110,515
0
$0
0
$0
FILES CLOSED FOR INCOMPLETENESS
0
$0
0
$0
1
$92,180
0
$0
0
$0
Aggregated Statistics For Year 2005 (Based on 2 partial tracts)
A) FHA, FSA/RHS & VA Home Purchase Loans
B) Conventional Home Purchase Loans
C) Refinancings
D) Home Improvement Loans
F) Non-occupant Loans on < 5 Family Dwellings (A B C & D)
G) Loans On Manufactured Home Dwelling (A B C & D)
Number
Average Value
Number
Average Value
Number
Average Value
Number
Average Value
Number
Average Value
Number
Average Value
LOANS ORIGINATED
3
$123,707
10
$71,280
13
$53,383
4
$32,335
2
$59,840
1
$18,820
APPLICATIONS APPROVED, NOT ACCEPTED
0
$0
0
$0
2
$73,840
1
$30,890
0
$0
0
$0
APPLICATIONS DENIED
0
$0
2
$47,295
9
$71,586
2
$42,225
0
$0
1
$55,500
APPLICATIONS WITHDRAWN
0
$0
0
$0
4
$88,438
0
$0
0
$0
0
$0
FILES CLOSED FOR INCOMPLETENESS
0
$0
0
$0
3
$72,873
0
$0
0
$0
0
$0
Aggregated Statistics For Year 2004 (Based on 2 partial tracts)
B) Conventional Home Purchase Loans
C) Refinancings
D) Home Improvement Loans
F) Non-occupant Loans on < 5 Family Dwellings (A B C & D)
G) Loans On Manufactured Home Dwelling (A B C & D)
Number
Average Value
Number
Average Value
Number
Average Value
Number
Average Value
Number
Average Value
LOANS ORIGINATED
10
$78,712
14
$57,223
3
$23,807
2
$61,050
0
$0
APPLICATIONS APPROVED, NOT ACCEPTED
1
$126,440
2
$71,185
0
$0
0
$0
0
$0
APPLICATIONS DENIED
1
$50,190
5
$99,320
2
$46,570
0
$0
1
$16,410
APPLICATIONS WITHDRAWN
1
$172,290
4
$71,908
0
$0
0
$0
0
$0
FILES CLOSED FOR INCOMPLETENESS
0
$0
3
$81,720
0
$0
0
$0
0
$0
Aggregated Statistics For Year 2003 (Based on 2 partial tracts)
A) FHA, FSA/RHS & VA Home Purchase Loans
B) Conventional Home Purchase Loans
C) Refinancings
D) Home Improvement Loans
Number
Average Value
Number
Average Value
Number
Average Value
Number
Average Value
LOANS ORIGINATED
1
$118,240
6
$40,618
27
$68,404
1
$46,330
APPLICATIONS APPROVED, NOT ACCEPTED
0
$0
1
$69,980
2
$73,595
0
$0
APPLICATIONS DENIED
0
$0
1
$13,510
11
$65,415
1
$20,270
APPLICATIONS WITHDRAWN
0
$0
2
$85,180
4
$60,928
0
$0
FILES CLOSED FOR INCOMPLETENESS
0
$0
0
$0
0
$0
0
$0
Aggregated Statistics For Year 2002 (Based on 2 partial tracts)
A) FHA, FSA/RHS & VA Home Purchase Loans
B) Conventional Home Purchase Loans
C) Refinancings
D) Home Improvement Loans
F) Non-occupant Loans on < 5 Family Dwellings (A B C & D)
Number
Average Value
Number
Average Value
Number
Average Value
Number
Average Value
Number
Average Value
LOANS ORIGINATED
3
$77,377
3
$106,653
22
$64,625
3
$32,657
1
$83,010
APPLICATIONS APPROVED, NOT ACCEPTED
0
$0
0
$0
2
$59,600
0
$0
0
$0
APPLICATIONS DENIED
0
$0
0
$0
4
$93,142
2
$26,060
0
$0
APPLICATIONS WITHDRAWN
0
$0
0
$0
2
$90,730
0
$0
0
$0
FILES CLOSED FOR INCOMPLETENESS
0
$0
0
$0
0
$0
0
$0
0
$0
Aggregated Statistics For Year 2001 (Based on 2 partial tracts)
A) FHA, FSA/RHS & VA Home Purchase Loans
B) Conventional Home Purchase Loans
C) Refinancings
D) Home Improvement Loans
F) Non-occupant Loans on < 5 Family Dwellings (A B C & D)
Number
Average Value
Number
Average Value
Number
Average Value
Number
Average Value
Number
Average Value
LOANS ORIGINATED
2
$56,705
6
$46,410
14
$60,325
2
$27,265
1
$27,030
APPLICATIONS APPROVED, NOT ACCEPTED
0
$0
0
$0
4
$45,728
1
$34,260
0
$0
APPLICATIONS DENIED
0
$0
1
$32,330
2
$56,705
2
$18,580
0
$0
APPLICATIONS WITHDRAWN
0
$0
0
$0
3
$55,500
0
$0
0
$0
FILES CLOSED FOR INCOMPLETENESS
0
$0
0
$0
0
$0
0
$0
0
$0
Aggregated Statistics For Year 2000 (Based on 2 partial tracts)
A) FHA, FSA/RHS & VA Home Purchase Loans
B) Conventional Home Purchase Loans
C) Refinancings
D) Home Improvement Loans
Number
Average Value
Number
Average Value
Number
Average Value
Number
Average Value
LOANS ORIGINATED
3
$60,647
4
$74,922
6
$64,588
5
$12,644
APPLICATIONS APPROVED, NOT ACCEPTED
0
$0
0
$0
1
$54,050
0
$0
APPLICATIONS DENIED
0
$0
3
$28,313
1
$48,260
0
$0
APPLICATIONS WITHDRAWN
0
$0
0
$0
1
$38,610
0
$0
FILES CLOSED FOR INCOMPLETENESS
0
$0
0
$0
0
$0
0
$0
Aggregated Statistics For Year 1999 (Based on 1 partial tract)

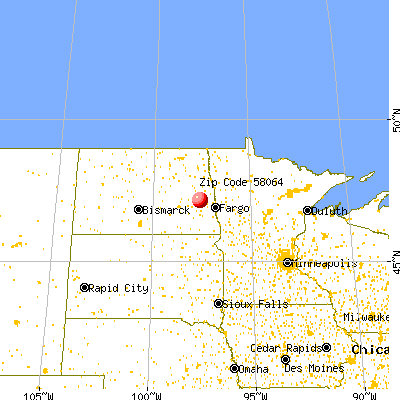


 Nearest zip codes: 58065, 58007, 58071, 58029, 58035, 58046.


