Estimated median house/condo value in 2022: $457,446
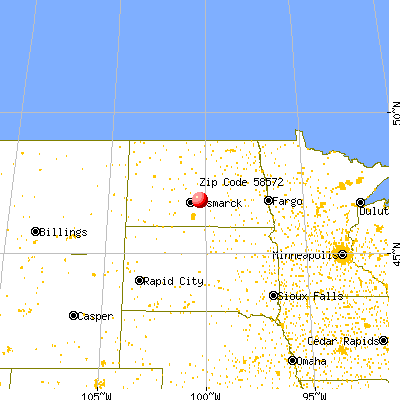
58572:
$457,446
North Dakota:
$243,100
Median resident age:
This zip code:
58.9 years
North Dakota median age:
36.2 years
Average household size:
This zip code:
2.4 people
North Dakota:
2.3 people
Averages for the 2020 tax year for zip code 58572, filed in 2021:
Average Adjusted Gross Income (AGI) in 2020: $70,194 (Individual Income Tax Returns)
Here:
$70,194
State:
$77,891
Salary/wage: $54,425 (reported on 70.6% of returns)
Here:
$54,425
State:
$59,202
(% of AGI for various income ranges: 1683.3% for AGIs $25k-50k, 5573.3% for AGIs $75k-100k)
Taxable interest for individuals: $983 (reported on 35.3% of returns)
This zip code:
$983
North Dakota:
$2,112
(% of AGI for various income ranges: )
Ordinary dividends: $2,067 (reported on 17.6% of returns)
Here:
$2,067
State:
$5,239
(% of AGI for various income ranges: 103.3% for AGIs $25k-50k)
Net capital gain/loss in AGI: +$15,725 (reported on 23.5% of returns)
Here:
+$15,725
State:
+$17,618
(% of AGI for various income ranges: )
Profit/loss from business: +$6,500 (reported on 23.5% of returns)
Here:
+$6,500
State:
+$12,375
(% of AGI for various income ranges: 433.3% for AGIs $25k-50k)
Earned income credit: $2,000 (reported on 11.8% of returns)
Here:
$2,000
State:
$2,120
(% of AGI for various income ranges: )
Percentage of individuals using paid preparers for their 2020 taxes: 100.0%
Here:
100%
State:
95%
(% for various income ranges: 100.0% for AGIs below $25k, 100.0% for AGIs $25k-50k, 100.0% for AGIs $50k-75k, 100.0% for AGIs $75k-100k, 100.0% for AGIs $100k-200k)
Averages for the 2012 tax year for zip code 58572, filed in 2013:
Average Adjusted Gross Income (AGI) in 2012: $61,821 (Individual Income Tax Returns)
Here:
$61,821
State:
$70,683
Salary/wage: $46,279 (reported on 73.7% of returns)
Here:
$46,279
State:
$48,615
(% of AGI for various income ranges: 79.0% for AGIs below $25k, 81.6% for AGIs $25k-50k, 70.8% for AGIs $50k-75k, 78.4% for AGIs $75k-100k, 32.7% for AGIs $100k-200k)
Taxable interest for individuals: $333 (reported on 31.6% of returns)
This zip code:
$333
North Dakota:
$1,659
Ordinary dividends: $325 (reported on 21.1% of returns)
Here:
$325
State:
$4,855
Net capital gain/loss in AGI: +$29,025 (reported on 21.1% of returns)
Here:
+$29,025
State:
+$26,078
Profit/loss from business: +$6,067 (reported on 15.8% of returns)
Here:
+$6,067
State:
+$14,112
Total itemized deductions: $18,800 (18% of AGI, reported on 15.8% of returns)
Here:
$18,800
State:
$22,515
Here:
17.7% of AGI
State:
13.2% of AGI
Taxes paid: $2,233 (reported on 15.8% of returns)
58572:
$2,233
State:
$6,844
Percentage of individuals using paid preparers for their 2012 taxes: 63.2%
Here:
63%
State:
59%
(% for various income ranges: 50.0% for AGIs below $25k, 50.0% for AGIs $25k-50k, 66.7% for AGIs $50k-75k, 66.7% for AGIs $75k-100k, 100.0% for AGIs $100k-200k)
Averages for the 2004 tax year for zip code 58572, filed in 2005:
Average Adjusted Gross Income (AGI) in 2004: $34,162 (Individual Income Tax Returns)
Here:
$34,162
State:
$40,108
Salary/wage: $28,657 (reported on 80.2% of returns)
Here:
$28,657
State:
$33,868
(% of AGI for various income ranges: 338.3% for AGIs below $10k, 61.9% for AGIs $10k-25k, 68.6% for AGIs $25k-50k, 78.5% for AGIs $50k-75k, 43.8% for AGIs $75k-100k)
Taxable interest for individuals: $883 (reported on 46.1% of returns)
This zip code:
$883
North Dakota:
$1,652
Taxable dividends: $727 (reported on 19.8% of returns)
Here:
$727
State:
$2,207
Net capital gain/loss: +$6,429 (reported on 29.3% of returns)
Here:
+$6,429
State:
+$6,573
Profit/loss from business: +$6,962 (reported on 15.6% of returns)
Here:
+$6,962
State:
+$8,636
Total itemized deductions: $10,360 (23% of AGI, reported on 15.0% of returns)
Here:
$10,360
State:
$16,683
Here:
23.0% of AGI
State:
18.6% of AGI
Charity contributions deductions: $1,267 (3% of AGI, reported on 9.0% of returns)
Here:
$1,267
State:
$3,523
Here:
2.6% of AGI
State:
3.6% of AGI
Total tax: $3,921 (reported on 76.0% of returns)
58572:
$3,921
State:
$5,748
(% of AGI for various income ranges: 4.8% for AGIs $10k-25k, 8.1% for AGIs $25k-50k, 9.4% for AGIs $50k-75k, 11.0% for AGIs $75k-100k)
Earned income credit: $1,435 (reported on 13.8% of returns)
Here:
$1,435
State:
$1,558
Percentage of individuals using paid preparers for their 2004 taxes: 75.4%
Here:
75%
State:
63%
(% for various income ranges: 57.1% for AGIs below $10k, 81.8% for AGIs $10k-25k, 76.3% for AGIs $25k-50k, 88.0% for AGIs $50k-75k, 80.0% for AGIs $75k-100k)
Household received Food Stamps/SNAP in the past 12 months: 3 Household did not receive Food Stamps/SNAP in the past 12 months: 134
Women who had a birth in the past 12 months: 3 (4 now married, 0 unmarried) Women who did not have a birth in the past 12 months: 57 (37 now married, 20 unmarried)
Housing units in zip code 58572 with a mortgage: 64 (1 second mortgage, 1 both second mortgage and home equity loan) Median monthly owner costs for units with a mortgage: $1,683 Median monthly owner costs for units without a mortgage: $492
Residents with income below the poverty level in 2022:
This zip code:
28.4%
Whole state:
11.5%
Residents with income below 50% of the poverty level in 2022:
This zip code:
12.1%
Whole state:
5.9%
Median number of rooms in houses and condos:
Here:
7.6
State:
7.0
Median number of rooms in apartments:
Here:
3.9
State:
4.0
Notable locations in this zip code not listed on our city pages
Size of family households: 74 2-persons, 16 3-persons, 14 4-persons, 4 5-persons
Size of nonfamily households: 18 1-person, 7 2-persons
45 married couples with children.
7 single-parent households (2 men, 5 women).
97.8% of residents of 58572 zip code speak English at home.
1.2% of residents speak Spanish at home (100% very well).
Foreign born population: 3 (0.9%) (100.0% of them are naturalized citizens)
This zip code:
0.9%
Whole state:
4.9%
67%Mexico
42%German
34%Norwegian
5%American
5%Irish
2%Italian
1%Finnish
1%French
Year of entry for the foreign-born population
22010 or later
02000 to 2009
01990 to 1999
1Before 1990
Facilities with environmental interests located in this zip code:
STERLING ELEMENTARY SCHOOL (118 MCKENZIE ST in STERLING, ND)
(National Center for Education Statistics) - STATE ID-82361 Organizations: STERLING 35 (SCHOOL DISTRICT)
AMERADA HESS: HUNT (S20-T159N-R94W in BURKE CO., ND)
AIR MINOR (AIRS/AFS) CRITERIA AND HAZARDOUS AIR POLLUTANT INVENTORY (Inventory of air pollution sources) Business SIC and NAICS classification: CRUDE PETROLEUM AND NATURAL GAS
BEAR PAW ENERGY, LLC (S33-T145N-R101W in MCKENZIE, ND)
AIR MINOR (AIRS/AFS) CRITERIA AND HAZARDOUS AIR POLLUTANT INVENTORY (Inventory of air pollution sources) Business SIC and NAICS classification: CRUDE PETROLEUM AND NATURAL GAS Alternative names: BEAR PAW ENERGY, INC.: ROUGH RIDER 1, KOCH HYDROCARBON: ROUGH RIDER 1
BEAR PAW ENERGY, LLC (S15-T147N-R101W in MCKENZIE, ND)
AIR MINOR (AIRS/AFS) CRITERIA AND HAZARDOUS AIR POLLUTANT INVENTORY (Inventory of air pollution sources) Business SIC and NAICS classification: CRUDE PETROLEUM AND NATURAL GAS Alternative names: BEAR PAW ENERGY, INC.: BULL MOOSE #1, KOCH HYDROCARBON: BULL MOOSE #1
BEAR PAW ENERGY, INC.: GRASSLANDS PLANT (36-T148-R105 in MCKENZIE, ND)
AIR MAJOR (AIRS/AFS) ENFORCEMENT/COMPLIANCE ACTIVITY (Integrated Compliance Information System) CRITERIA AND HAZARDOUS AIR POLLUTANT INVENTORY (Inventory of air pollution sources) Business SIC and NAICS classification: CRUDE PETROLEUM AND NATURAL GAS Alternative names: BEAR PAW ENERGY, INC.: MCK
BEAR PAW ENERGY, INC.: POKER JIM (S2-T146N-R103W in MCKENZIE COUNTY, ND)
AIR MINOR (AIRS/AFS) Business SIC classification: CRUDE PETROLEUM AND NATURAL GAS
AMERADA HESS CORPORATION (S1-T152N-R95W in MCKENZIE CO., ND)
AIR MAJOR (AIRS/AFS) CRITERIA AND HAZARDOUS AIR POLLUTANT INVENTORY (Inventory of air pollution sources) Business SIC and NAICS classification: CRUDE PETROLEUM AND NATURAL GAS Alternative names: AMERADA HESS: ANTELOPE #1
STERLING SCHOOL DISTRICT 35 (118 MCKENZIE STREET in STERLING, ND)
ENFORCEMENT/COMPLIANCE ACTIVITY (Integrated Compliance Information System)
Housing units lacking complete plumbing facilities: 3.2% Housing units lacking complete kitchen facilities: 1.9%
60.2%Bottled, tank, or LP gas
21.3%Electricity
14.5%Utility gas
3.8%Wood
1.5%Fuel oil, kerosene, etc.
Population in 1990: 263.
Place of birth for U.S.-born residents:
This state: 270
Midwest: 47
South: 4
West: 11
69% of the 58572 zip code residents lived in the same house 5 years ago. Out of people who lived in different houses, 18% lived in this county. Out of people who lived in different counties, 50% lived in North Dakota.
90% of the 58572 zip code residents lived in the same house 1 year ago. Out of people who lived in different houses, 93% moved from this county.
Private vs. public school enrollment:
Students in private schools in grades 1 to 8 (elementary and middle school): 4
Here:
19.2%
North Dakota:
8.4%
Students in private schools in grades 9 to 12 (high school):
Here:
0.0%
North Dakota:
8.2%
Students in private undergraduate colleges: 3
Here:
39.2%
North Dakota:
14.3%
Occupation by median earnings in the past 12 months ($)
44,298Health diagnosing and treating practitioners and other technical occupations
41,421Farming, fishing, and forestry occupations
36,713Health technologists and technicians
32,553Education, training, and library occupations
27,835Transportation occupations
24,227Office and administrative support occupations
Top industries in this zip code by the number of employees in 2005:
Other Services (except Public Administration): General Automotive Repair (5-9: 1)
Accommodation and Food Services: Hotels (except Casino Hotels) and Motels (1-4: 1)
Administrative and Support and Waste Management and Remediation Services: Other Waste Collection (1-4: 1)
Other Services (except Public Administration): Commercial and Industrial Machinery and Equipment (except Automotive and Electronic) Repair and Maintenance (1-4: 1)
Home Mortgage Disclosure Act Aggregated Statistics For Year 2009 (Based on 2 partial tracts)
A) FHA, FSA/RHS & VA Home Purchase Loans
B) Conventional Home Purchase Loans
C) Refinancings
D) Home Improvement Loans
G) Loans On Manufactured Home Dwelling (A B C & D)
Number
Average Value
Number
Average Value
Number
Average Value
Number
Average Value
Number
Average Value
LOANS ORIGINATED
3
$190,957
6
$152,717
15
$179,690
2
$45,695
2
$76,040
APPLICATIONS APPROVED, NOT ACCEPTED
0
$0
1
$99,010
1
$129,000
0
$0
0
$0
APPLICATIONS DENIED
0
$0
0
$0
5
$168,218
0
$0
1
$52,840
APPLICATIONS WITHDRAWN
0
$0
0
$0
4
$179,452
0
$0
0
$0
FILES CLOSED FOR INCOMPLETENESS
0
$0
0
$0
2
$178,145
0
$0
0
$0
Aggregated Statistics For Year 2008 (Based on 2 partial tracts)
A) FHA, FSA/RHS & VA Home Purchase Loans
B) Conventional Home Purchase Loans
C) Refinancings
D) Home Improvement Loans
F) Non-occupant Loans on < 5 Family Dwellings (A B C & D)
G) Loans On Manufactured Home Dwelling (A B C & D)
Number
Average Value
Number
Average Value
Number
Average Value
Number
Average Value
Number
Average Value
Number
Average Value
LOANS ORIGINATED
2
$143,990
4
$172,430
11
$130,554
2
$54,025
2
$84,610
1
$107,100
APPLICATIONS APPROVED, NOT ACCEPTED
0
$0
0
$0
1
$145,420
0
$0
0
$0
0
$0
APPLICATIONS DENIED
0
$0
1
$51,880
3
$95,437
0
$0
0
$0
2
$70,090
APPLICATIONS WITHDRAWN
0
$0
0
$0
1
$233,720
0
$0
0
$0
0
$0
FILES CLOSED FOR INCOMPLETENESS
0
$0
0
$0
1
$84,250
0
$0
0
$0
0
$0
Aggregated Statistics For Year 2007 (Based on 2 partial tracts)
A) FHA, FSA/RHS & VA Home Purchase Loans
B) Conventional Home Purchase Loans
C) Refinancings
D) Home Improvement Loans
F) Non-occupant Loans on < 5 Family Dwellings (A B C & D)
G) Loans On Manufactured Home Dwelling (A B C & D)
Number
Average Value
Number
Average Value
Number
Average Value
Number
Average Value
Number
Average Value
Number
Average Value
LOANS ORIGINATED
1
$173,030
7
$145,214
8
$111,444
2
$80,800
1
$213,250
2
$89,490
APPLICATIONS APPROVED, NOT ACCEPTED
0
$0
1
$230,620
1
$137,330
1
$9,760
0
$0
0
$0
APPLICATIONS DENIED
0
$0
1
$206,350
3
$93,453
0
$0
1
$111,860
1
$151,370
APPLICATIONS WITHDRAWN
0
$0
0
$0
1
$98,530
0
$0
0
$0
0
$0
FILES CLOSED FOR INCOMPLETENESS
0
$0
0
$0
0
$0
0
$0
0
$0
0
$0
Aggregated Statistics For Year 2006 (Based on 2 partial tracts)
A) FHA, FSA/RHS & VA Home Purchase Loans
B) Conventional Home Purchase Loans
C) Refinancings
D) Home Improvement Loans
F) Non-occupant Loans on < 5 Family Dwellings (A B C & D)
G) Loans On Manufactured Home Dwelling (A B C & D)
Number
Average Value
Number
Average Value
Number
Average Value
Number
Average Value
Number
Average Value
Number
Average Value
LOANS ORIGINATED
1
$125,900
7
$133,246
6
$117,413
2
$45,460
1
$274,180
1
$77,350
APPLICATIONS APPROVED, NOT ACCEPTED
0
$0
1
$186,830
1
$68,540
0
$0
0
$0
0
$0
APPLICATIONS DENIED
0
$0
2
$103,175
3
$125,663
0
$0
0
$0
1
$87,820
APPLICATIONS WITHDRAWN
0
$0
0
$0
1
$161,360
0
$0
0
$0
0
$0
FILES CLOSED FOR INCOMPLETENESS
0
$0
0
$0
2
$130,185
0
$0
0
$0
0
$0
Aggregated Statistics For Year 2005 (Based on 2 partial tracts)
A) FHA, FSA/RHS & VA Home Purchase Loans
B) Conventional Home Purchase Loans
C) Refinancings
D) Home Improvement Loans
F) Non-occupant Loans on < 5 Family Dwellings (A B C & D)
G) Loans On Manufactured Home Dwelling (A B C & D)
Number
Average Value
Number
Average Value
Number
Average Value
Number
Average Value
Number
Average Value
Number
Average Value
LOANS ORIGINATED
1
$111,150
10
$113,716
10
$97,080
2
$34,985
1
$79,490
2
$46,170
APPLICATIONS APPROVED, NOT ACCEPTED
0
$0
1
$91,870
0
$0
0
$0
0
$0
0
$0
APPLICATIONS DENIED
0
$0
2
$71,875
3
$106,387
0
$0
0
$0
1
$29,990
APPLICATIONS WITHDRAWN
0
$0
1
$88,770
2
$122,925
0
$0
0
$0
0
$0
FILES CLOSED FOR INCOMPLETENESS
0
$0
0
$0
2
$97,820
0
$0
0
$0
0
$0
Aggregated Statistics For Year 2004 (Based on 2 partial tracts)
A) FHA, FSA/RHS & VA Home Purchase Loans
B) Conventional Home Purchase Loans
C) Refinancings
D) Home Improvement Loans
G) Loans On Manufactured Home Dwelling (A B C & D)
Number
Average Value
Number
Average Value
Number
Average Value
Number
Average Value
Number
Average Value
LOANS ORIGINATED
2
$98,530
5
$137,850
9
$97,923
1
$82,350
1
$69,260
APPLICATIONS APPROVED, NOT ACCEPTED
0
$0
0
$0
1
$125,190
0
$0
0
$0
APPLICATIONS DENIED
0
$0
0
$0
3
$77,587
0
$0
0
$0
APPLICATIONS WITHDRAWN
0
$0
0
$0
1
$92,580
0
$0
0
$0
FILES CLOSED FOR INCOMPLETENESS
0
$0
0
$0
2
$70,925
0
$0
0
$0
Aggregated Statistics For Year 2003 (Based on 2 partial tracts)
B) Conventional Home Purchase Loans
C) Refinancings
D) Home Improvement Loans
Number
Average Value
Number
Average Value
Number
Average Value
LOANS ORIGINATED
5
$115,096
21
$93,738
1
$12,140
APPLICATIONS APPROVED, NOT ACCEPTED
0
$0
1
$128,760
0
$0
APPLICATIONS DENIED
1
$34,270
2
$91,985
0
$0
APPLICATIONS WITHDRAWN
0
$0
1
$60,210
0
$0
FILES CLOSED FOR INCOMPLETENESS
0
$0
1
$29,040
0
$0
Aggregated Statistics For Year 2002 (Based on 2 partial tracts)
A) FHA, FSA/RHS & VA Home Purchase Loans
B) Conventional Home Purchase Loans
C) Refinancings
Number
Average Value
Number
Average Value
Number
Average Value
LOANS ORIGINATED
1
$97,580
2
$47,600
2
$76,400
APPLICATIONS APPROVED, NOT ACCEPTED
0
$0
0
$0
0
$0
APPLICATIONS DENIED
0
$0
1
$28,080
0
$0
APPLICATIONS WITHDRAWN
0
$0
1
$88,060
0
$0
FILES CLOSED FOR INCOMPLETENESS
0
$0
0
$0
0
$0
Aggregated Statistics For Year 2001 (Based on 2 partial tracts)
B) Conventional Home Purchase Loans
C) Refinancings
Number
Average Value
Number
Average Value
LOANS ORIGINATED
0
$0
2
$55,335
APPLICATIONS APPROVED, NOT ACCEPTED
1
$67,830
0
$0
APPLICATIONS DENIED
0
$0
2
$32,250
APPLICATIONS WITHDRAWN
0
$0
0
$0
FILES CLOSED FOR INCOMPLETENESS
0
$0
0
$0
Aggregated Statistics For Year 2000 (Based on 2 partial tracts)


 Nearest zip codes: 58558, 58560, 58532, 58494, 58544, 58504.


