Estimated zip code population in 2022: 633 Zip code population in 2010: 521 Zip code population in 2000: 576
Houses and condos: 605 Renter-occupied apartments: 28
% of renters here:
8%
State:
31%
March 2022 cost of living index in zip code 59826: 96.0 (near average, U.S. average is 100)
Land area: 437.0 sq. mi. Water area: 8.1 sq. mi.
Population density: 1 people per square mile
(very low).
OSM Map
General Map
Google Map
MSN Map
OSM Map
General Map
Google Map
MSN Map
OSM Map
General Map
Google Map
MSN Map
OSM Map
General Map
Google Map
MSN Map
Please wait while loading the map...
Real estate property taxes paid for housing units in 2022:
This zip code:
0.4% ($2,273)
Montana:
0.7% ($2,498)
Median real estate property taxes paid for housing units with mortgages in 2022: $2,474 (0.4%) Median real estate property taxes paid for housing units with no mortgage in 2022: $2,170 (0.4%)
Business Search- 14 Million verified businesses
Males: 333
(52.7%)
Females: 299
(47.3%)
For population 25 years and over in 59826:
High school or higher: 98.6%
Bachelor's degree or higher: 37.4%
Graduate or professional degree: 16.0%
Unemployed: 2.3%
Mean travel time to work (commute): 19.8 minutes
For population 15 years and over in 59826:
Never married: 9.8%
Now married: 69.8%
Separated: 1.4%
Widowed: 9.9%
Divorced: 9.2%
Zip code 59826 compared to state average:
Median house value above state average.
Black race population percentage significantly below state average.
Hispanic race population percentage below state average.
Median age significantly above state average.
Foreign-born population percentage above state average.
Renting percentage significantly below state average.
Length of stay since moving in significantly above state average.
Number of college students significantly below state average.
Estimated median house/condo value in 2022: $560,926
59826:
$560,926
Montana:
$366,400
Median resident age:
This zip code:
64.7 years
Montana median age:
40.2 years
Average household size:
This zip code:
1.8 people
Montana:
2.4 people
Averages for the 2020 tax year for zip code 59826, filed in 2021:
Average Adjusted Gross Income (AGI) in 2020: $83,320 (Individual Income Tax Returns)
Here:
$83,320
State:
$70,533
Salary/wage: $41,006 (reported on 56.7% of returns)
Here:
$41,006
State:
$52,258
(% of AGI for various income ranges: 934.3% for AGIs below $25k, 3140.0% for AGIs $25k-50k, 6236.7% for AGIs $50k-75k, 15950.0% for AGIs $100k-200k)
Taxable interest for individuals: $1,356 (reported on 53.3% of returns)
This zip code:
$1,356
Montana:
$1,928
(% of AGI for various income ranges: 41.4% for AGIs below $25k, 45.0% for AGIs $25k-50k, 153.3% for AGIs $50k-75k, 250.0% for AGIs $100k-200k)
Ordinary dividends: $10,878 (reported on 30.0% of returns)
Here:
$10,878
State:
$7,554
(% of AGI for various income ranges: 185.7% for AGIs below $25k, 230.0% for AGIs $50k-75k, 3900.0% for AGIs $100k-200k)
Net capital gain/loss in AGI: +$34,640 (reported on 33.3% of returns)
Here:
+$34,640
State:
+$26,730
(% of AGI for various income ranges: 84.3% for AGIs below $25k, 963.3% for AGIs $50k-75k, 15580.0% for AGIs $100k-200k)
Profit/loss from business: +$5,386 (reported on 23.3% of returns)
Here:
+$5,386
State:
+$13,757
(% of AGI for various income ranges: 471.4% for AGIs below $25k, 156.7% for AGIs $50k-75k)
Taxable individual retirement arrangement distribution: $29,000 (reported on 16.7% of returns)
59826:
$29,000
Montana:
$19,575
(% of AGI for various income ranges: 380.0% for AGIs below $25k)
Total itemized deductions: $36,067 (reported on 10.0% of returns)
Here:
$36,067
State:
$33,125
(% of AGI for various income ranges: 3606.7% for AGIs $50k-75k)
Taxes paid: $6,667 (reported on 10.0% of returns)
59826:
$6,667
State:
$7,689
(% of AGI for various income ranges: 666.7% for AGIs $50k-75k)
Earned income credit: $2,300 (reported on 10.0% of returns)
Here:
$2,300
State:
$2,035
(% of AGI for various income ranges: 98.6% for AGIs below $25k)
Percentage of individuals using paid preparers for their 2020 taxes: 83.3%
Here:
83%
State:
94%
(% for various income ranges: 75.0% for AGIs below $25k, 83.3% for AGIs $25k-50k, 75.0% for AGIs $50k-75k, 100.0% for AGIs $75k-100k, 100.0% for AGIs $100k-200k, 100.0% for AGIs over 200k)
Averages for the 2012 tax year for zip code 59826, filed in 2013:
Average Adjusted Gross Income (AGI) in 2012: $58,825 (Individual Income Tax Returns)
Here:
$58,825
State:
$53,401
Salary/wage: $37,413 (reported on 62.5% of returns)
Here:
$37,413
State:
$40,976
(% of AGI for various income ranges: 51.7% for AGIs below $25k, 51.0% for AGIs $25k-50k, 85.5% for AGIs $50k-75k, 34.4% for AGIs $100k-200k)
Taxable interest for individuals: $1,400 (reported on 62.5% of returns)
This zip code:
$1,400
Montana:
$1,689
(% of AGI for various income ranges: 5.1% for AGIs below $25k, 2.7% for AGIs $25k-50k, 2.7% for AGIs $50k-75k, 0.7% for AGIs $100k-200k)
Ordinary dividends: $5,175 (reported on 33.3% of returns)
Here:
$5,175
State:
$5,585
(% of AGI for various income ranges: 6.7% for AGIs below $25k, 6.1% for AGIs $25k-50k, 12.7% for AGIs $75k-100k)
Net capital gain/loss in AGI: +$1,400 (reported on 25.0% of returns)
Here:
+$1,400
State:
+$14,401
Profit/loss from business: +$2,243 (reported on 29.2% of returns)
Here:
+$2,243
State:
+$10,980
Taxable individual retirement arrangement distribution: $16,467 (reported on 12.5% of returns)
59826:
$16,467
Montana:
$13,434
Total itemized deductions: $27,325 (23% of AGI, reported on 33.3% of returns)
Here:
$27,325
State:
$21,750
Here:
23.1% of AGI
State:
20.5% of AGI
(% of AGI for various income ranges: 42.6% for AGIs below $25k, 37.1% for AGIs $50k-75k, 13.3% for AGIs $100k-200k)
Charity contributions: $5,683 (reported on 25.0% of returns)
Here:
$5,683
State:
$3,989
(% of AGI for various income ranges: 2.4% for AGIs below $25k, 6.1% for AGIs $50k-75k, 2.7% for AGIs $100k-200k)
Taxes paid: $7,575 (reported on 33.3% of returns)
59826:
$7,575
State:
$7,640
(% of AGI for various income ranges: 8.4% for AGIs below $25k, 8.1% for AGIs $50k-75k, 4.7% for AGIs $100k-200k)
Earned income credit: $1,925 (reported on 16.7% of returns)
Here:
$1,925
State:
$2,015
(% of AGI for various income ranges: 5.9% for AGIs below $25k)
Percentage of individuals using paid preparers for their 2012 taxes: 66.7%
Here:
67%
State:
57%
(% for various income ranges: 63.6% for AGIs below $25k, 60.0% for AGIs $25k-50k, 100.0% for AGIs $50k-75k, 100.0% for AGIs $100k-200k)
Averages for the 2004 tax year for zip code 59826, filed in 2005:
Average Adjusted Gross Income (AGI) in 2004: $36,532 (Individual Income Tax Returns)
Here:
$36,532
State:
$37,845
Salary/wage: $23,280 (reported on 63.5% of returns)
Here:
$23,280
State:
$31,190
(% of AGI for various income ranges: 61.5% for AGIs below $10k, 56.7% for AGIs $10k-25k, 67.7% for AGIs $25k-50k, 40.4% for AGIs $50k-75k, 67.3% for AGIs $75k-100k)
Taxable interest for individuals: $1,178 (reported on 59.4% of returns)
This zip code:
$1,178
Montana:
$1,879
(% of AGI for various income ranges: 5.9% for AGIs below $10k, 1.7% for AGIs $10k-25k, 2.0% for AGIs $25k-50k, 1.1% for AGIs $50k-75k, 4.1% for AGIs $75k-100k, 1.0% for AGIs over 100k)
Taxable dividends: $3,463 (reported on 28.0% of returns)
Here:
$3,463
State:
$3,070
(% of AGI for various income ranges: 4.6% for AGIs below $10k, 0.4% for AGIs $10k-25k, 1.4% for AGIs $25k-50k, 2.7% for AGIs $50k-75k, 5.3% for AGIs over 100k)
Net capital gain/loss: +$7,059 (reported on 23.2% of returns)
Here:
+$7,059
State:
+$10,237
(% of AGI for various income ranges: -5.4% for AGIs below $10k, 2.7% for AGIs $25k-50k, 1.5% for AGIs $50k-75k, 12.4% for AGIs over 100k)
Profit/loss from business: +$6,055 (reported on 37.5% of returns)
Here:
+$6,055
State:
+$8,849
(% of AGI for various income ranges: 13.6% for AGIs below $10k, 21.9% for AGIs $10k-25k, 6.4% for AGIs $25k-50k, 9.1% for AGIs $50k-75k)
IRA payment deduction: $3,600 (reported on 3.4% of returns)
59826:
$3,600
Montana:
$2,958
Total itemized deductions: $18,345 (29% of AGI, reported on 37.5% of returns)
Here:
$18,345
State:
$17,258
Here:
29.2% of AGI
State:
23.1% of AGI
(% of AGI for various income ranges: 43.3% for AGIs below $10k, 17.9% for AGIs $10k-25k, 14.7% for AGIs $25k-50k, 23.6% for AGIs $50k-75k, 26.7% for AGIs $75k-100k, 13.2% for AGIs over 100k)
Charity contributions deductions: $2,379 (3% of AGI, reported on 32.4% of returns)
Here:
$2,379
State:
$2,921
Here:
3.4% of AGI
State:
3.7% of AGI
(% of AGI for various income ranges: 0.8% for AGIs $10k-25k, 1.2% for AGIs $25k-50k, 3.7% for AGIs $50k-75k, 2.6% for AGIs $75k-100k, 2.4% for AGIs over 100k)
Total tax: $4,903 (reported on 81.2% of returns)
59826:
$4,903
State:
$5,485
(% of AGI for various income ranges: 6.2% for AGIs below $10k, 7.0% for AGIs $10k-25k, 6.8% for AGIs $25k-50k, 8.1% for AGIs $50k-75k, 10.7% for AGIs $75k-100k, 17.9% for AGIs over 100k)
Earned income credit: $1,469 (reported on 16.7% of returns)
Here:
$1,469
State:
$1,604
Percentage of individuals using paid preparers for their 2004 taxes: 72.4%
Here:
72%
State:
63%
(% for various income ranges: 75.9% for AGIs below $10k, 69.9% for AGIs $10k-25k, 72.1% for AGIs $25k-50k, 97.1% for AGIs $50k-75k, 86.7% for AGIs over 100k)
Household received Food Stamps/SNAP in the past 12 months: 11 Household did not receive Food Stamps/SNAP in the past 12 months: 326
Women who had a birth in the past 12 months: 5 (0 now married, 4 unmarried) Women who did not have a birth in the past 12 months: 28 (25 now married, 3 unmarried)
Housing units in zip code 59826 with a mortgage: 104 (10 second mortgage, 11 both second mortgage and home equity loan) Median monthly owner costs for units with a mortgage: $1,677 Median monthly owner costs for units without a mortgage: $413
Residents with income below the poverty level in 2022:
This zip code:
7.8%
Whole state:
12.1%
Residents with income below 50% of the poverty level in 2022:
This zip code:
6.9%
Whole state:
6.3%
Median number of rooms in houses and condos:
Here:
5.0
State:
6.4
Median number of rooms in apartments:
Here:
4.9
State:
4.2
Notable locations in this zip code not listed on our city pages
Notable locations in zip code 59826: Hultman 33 Ranch (A), Gordon Ranch (B), Stroms Store (C), Holland Lake Campground (D), Pendant Guard Station (E), Owl Creek Packer Camp (F), Condon Forest Service Station (G), Swan Valley Emergency Services Station 1 (H), Swan Valley Branch Library (I). Display/hide their locations on the map
Lakes and swamps: Lower Cold Lake (A), The Angels Bathing Pool (B), High Park Lake (C), Lake Marshall (D), Spook Lake (E), Spider Lake (F), Pasture Lake (G), Lake Dinah (H). Display/hide their locations on the map
Creeks: Albino Creek (A), Barber Creek (B), Buck Creek (C), Cataract Creek (D), Cold Creek (E), Cooney Creek (F), Sheep Creek (G), Simpson Creek (H), Smith Creek (I). Display/hide their locations on the map
In group quarters: 16 (-1 institutionalized population)
Size of family households: 154 2-persons, 26 3-persons, 3 4-persons, 6 5-persons
Size of nonfamily households: 140 1-person
19 married couples with children.
5 single-parent households (5 men).
96.5% of residents of 59826 zip code speak English at home.
4.0% of residents speak other Indo-European language at home (100% very well).
0.8% of residents speak Asian or Pacific Island language at home (100% very well).
Foreign born population: 32 (5.1%) (24.6% of them are naturalized citizens)
This zip code:
5.1%
Whole state:
2.3%
31%Austria
24%Germany
10%Uganda
3%Ecuador
17%English
11%German
10%Irish
8%American
4%Scottish
4%Northern European
3%French
Year of entry for the foreign-born population
72010 or later
62000 to 2009
11990 to 1999
23Before 1990
Facilities with environmental interests located in this zip code:
SWAN VALLEY CENTRE (6799 HWY 83 in CONDON, MT)
ENFORCEMENT/COMPLIANCE ACTIVITY (Integrated Compliance Information System) STATE MASTER (Montana air and water quality tracking) - MT-CEDARS-100051, UNDERGROUND STORAGE TANK PROGRAM Organizations: AAA QUALITY SERVICES INCORPORATED (CONTACT/OWNER)
SWAN VALLEY SCHOOL (6423 HIGHWAY 83 in CONDON, MT)
(Geographic Names Information System) (National Center for Education Statistics) - STATE ID-0800 Organizations: SWAN VALLEY ELEM (SCHOOL DISTRICT)
SWAN VALLEY 7-8 (6423 HIGHWAY 83 in CONDON, MT)
(National Center for Education Statistics) - STATE ID-1739 Organizations: SWAN VALLEY ELEM (SCHOOL DISTRICT)
Housing units lacking complete plumbing facilities: 11.8% Housing units lacking complete kitchen facilities: 10.0%
48.5%Wood
31.0%Bottled, tank, or LP gas
18.5%Electricity
1.3%Fuel oil, kerosene, etc.
0.6%Utility gas
0.6%No fuel used
Population in 1990: 534. Population change in the 1990s: +42 (+7.9%).
Place of birth for U.S.-born residents:
This state: 155
Northeast: 73
Midwest: 196
South: 58
West: 117
59% of the 59826 zip code residents lived in the same house 5 years ago. Out of people who lived in different houses, 32% lived in this county. Out of people who lived in different counties, 50% lived in Montana.
97% of the 59826 zip code residents lived in the same house 1 year ago. Out of people who lived in different houses, 17% moved from this county. Out of people who lived in different houses, 83% moved from different county within same state. Out of people who lived in different houses, 11% moved from different state.
Private vs. public school enrollment:
Students in private schools in grades 1 to 8 (elementary and middle school): 11
Here:
50.0%
Montana:
15.3%
Students in private schools in grades 9 to 12 (high school):
Here:
0.0%
Montana:
12.2%
Students in private undergraduate colleges:
Here:
0.0%
Montana:
15.0%
Occupation by median earnings in the past 12 months ($)
54,200Installation, maintenance, and repair occupations
52,309Management occupations
30,559Production occupations
28,962Building and grounds cleaning and maintenance occupations
28,591Education, training, and library occupations
27,341Construction and extraction occupations
Top industries in this zip code by the number of employees in 2005:
Educational Services: Elementary and Secondary Schools (20-49 employees: 1 establishment)
Accommodation and Food Services: Full-Service Restaurants (10-19: 1)
Other Services (except Public Administration): Environment, Conservation and Wildlife Organizations (5-9: 1, 1-4: 1)
Wholesale Trade: Other Electronic Parts and Equipment Merchant Wholesalers (5-9: 1)
Other Services (except Public Administration): Business Associations (5-9: 1)
Accommodation and Food Services: Drinking Places (Alcoholic Beverages) (5-9: 1)
Administrative and Support and Waste Management and Remediation Services: Landscaping Services (1-4: 2)
Home Mortgage Disclosure Act Aggregated Statistics For Year 2009 (Based on 2 partial tracts)
A) FHA, FSA/RHS & VA Home Purchase Loans
B) Conventional Home Purchase Loans
C) Refinancings
D) Home Improvement Loans
F) Non-occupant Loans on < 5 Family Dwellings (A B C & D)
G) Loans On Manufactured Home Dwelling (A B C & D)
Number
Average Value
Number
Average Value
Number
Average Value
Number
Average Value
Number
Average Value
Number
Average Value
LOANS ORIGINATED
10
$184,477
17
$207,246
140
$208,332
10
$108,758
50
$224,078
8
$129,729
APPLICATIONS APPROVED, NOT ACCEPTED
1
$230,110
1
$55,200
17
$241,040
0
$0
3
$237,883
2
$90,180
APPLICATIONS DENIED
1
$85,510
5
$203,056
45
$217,568
5
$103,706
11
$218,803
7
$112,167
APPLICATIONS WITHDRAWN
1
$76,190
3
$685,927
22
$213,891
2
$28,765
4
$541,848
2
$219,615
FILES CLOSED FOR INCOMPLETENESS
1
$115,060
0
$0
9
$235,207
0
$0
4
$275,395
1
$132,160
Aggregated Statistics For Year 2008 (Based on 2 partial tracts)
A) FHA, FSA/RHS & VA Home Purchase Loans
B) Conventional Home Purchase Loans
C) Refinancings
D) Home Improvement Loans
E) Loans on Dwellings For 5+ Families
F) Non-occupant Loans on < 5 Family Dwellings (A B C & D)
G) Loans On Manufactured Home Dwelling (A B C & D)
Number
Average Value
Number
Average Value
Number
Average Value
Number
Average Value
Number
Average Value
Number
Average Value
Number
Average Value
LOANS ORIGINATED
1
$76,190
32
$185,458
63
$193,017
18
$93,072
1
$95,620
35
$230,643
15
$57,320
APPLICATIONS APPROVED, NOT ACCEPTED
2
$144,210
1
$236,330
14
$234,553
1
$97,170
0
$0
5
$309,250
2
$187,740
APPLICATIONS DENIED
2
$144,985
9
$171,460
32
$296,262
4
$31,872
0
$0
7
$577,276
8
$89,888
APPLICATIONS WITHDRAWN
0
$0
3
$225,963
18
$243,024
2
$262,375
0
$0
5
$261,206
2
$118,555
FILES CLOSED FOR INCOMPLETENESS
0
$0
0
$0
6
$234,257
2
$210,675
0
$0
2
$154,315
1
$224,670
Aggregated Statistics For Year 2007 (Based on 2 partial tracts)
A) FHA, FSA/RHS & VA Home Purchase Loans
B) Conventional Home Purchase Loans
C) Refinancings
D) Home Improvement Loans
F) Non-occupant Loans on < 5 Family Dwellings (A B C & D)
G) Loans On Manufactured Home Dwelling (A B C & D)
Number
Average Value
Number
Average Value
Number
Average Value
Number
Average Value
Number
Average Value
Number
Average Value
LOANS ORIGINATED
1
$117,390
40
$207,566
103
$194,893
16
$58,791
49
$256,574
11
$77,245
APPLICATIONS APPROVED, NOT ACCEPTED
1
$108,060
5
$155,790
11
$164,809
0
$0
6
$150,557
1
$77,740
APPLICATIONS DENIED
0
$0
9
$251,532
48
$209,396
7
$112,723
12
$231,471
12
$99,053
APPLICATIONS WITHDRAWN
0
$0
2
$282,195
23
$211,284
4
$93,482
5
$351,230
3
$175,950
FILES CLOSED FOR INCOMPLETENESS
0
$0
2
$411,245
7
$158,479
1
$15,550
1
$139,930
0
$0
Aggregated Statistics For Year 2006 (Based on 2 partial tracts)
A) FHA, FSA/RHS & VA Home Purchase Loans
B) Conventional Home Purchase Loans
C) Refinancings
D) Home Improvement Loans
F) Non-occupant Loans on < 5 Family Dwellings (A B C & D)
G) Loans On Manufactured Home Dwelling (A B C & D)
Number
Average Value
Number
Average Value
Number
Average Value
Number
Average Value
Number
Average Value
Number
Average Value
LOANS ORIGINATED
2
$159,755
82
$177,143
83
$189,105
18
$59,860
52
$228,002
16
$99,750
APPLICATIONS APPROVED, NOT ACCEPTED
0
$0
4
$197,848
13
$135,088
2
$28,375
2
$229,335
0
$0
APPLICATIONS DENIED
0
$0
12
$199,727
24
$233,350
4
$53,448
8
$191,629
3
$66,337
APPLICATIONS WITHDRAWN
2
$117,385
4
$179,385
26
$214,323
3
$63,487
4
$319,318
2
$156,255
FILES CLOSED FOR INCOMPLETENESS
0
$0
1
$193,570
5
$198,236
1
$19,430
0
$0
0
$0
Aggregated Statistics For Year 2005 (Based on 2 partial tracts)
A) FHA, FSA/RHS & VA Home Purchase Loans
B) Conventional Home Purchase Loans
C) Refinancings
D) Home Improvement Loans
F) Non-occupant Loans on < 5 Family Dwellings (A B C & D)
G) Loans On Manufactured Home Dwelling (A B C & D)
Number
Average Value
Number
Average Value
Number
Average Value
Number
Average Value
Number
Average Value
Number
Average Value
LOANS ORIGINATED
5
$168,696
94
$166,215
97
$173,961
16
$79,732
55
$210,025
18
$92,554
APPLICATIONS APPROVED, NOT ACCEPTED
1
$122,050
9
$305,000
9
$159,627
2
$93,290
8
$305,908
1
$89,400
APPLICATIONS DENIED
0
$0
18
$174,181
36
$140,861
4
$45,090
6
$269,110
7
$105,949
APPLICATIONS WITHDRAWN
0
$0
16
$144,888
21
$194,202
3
$149,003
6
$213,785
2
$68,410
FILES CLOSED FOR INCOMPLETENESS
0
$0
1
$132,940
10
$209,043
1
$85,510
2
$159,755
0
$0
Aggregated Statistics For Year 2004 (Based on 2 partial tracts)
A) FHA, FSA/RHS & VA Home Purchase Loans
B) Conventional Home Purchase Loans
C) Refinancings
D) Home Improvement Loans
E) Loans on Dwellings For 5+ Families
F) Non-occupant Loans on < 5 Family Dwellings (A B C & D)
G) Loans On Manufactured Home Dwelling (A B C & D)
Number
Average Value
Number
Average Value
Number
Average Value
Number
Average Value
Number
Average Value
Number
Average Value
Number
Average Value
LOANS ORIGINATED
2
$106,505
44
$161,947
115
$156,798
10
$40,580
1
$218,450
34
$198,031
16
$80,849
APPLICATIONS APPROVED, NOT ACCEPTED
1
$122,050
3
$262,243
17
$139,109
2
$19,435
0
$0
4
$239,440
1
$31,100
APPLICATIONS DENIED
1
$115,830
9
$138,204
39
$181,513
2
$11,660
0
$0
4
$300,465
5
$80,850
APPLICATIONS WITHDRAWN
1
$76,960
7
$196,349
25
$177,620
1
$87,070
0
$0
3
$128,013
4
$105,338
FILES CLOSED FOR INCOMPLETENESS
0
$0
4
$147,705
11
$222,195
1
$11,660
0
$0
3
$262,503
1
$96,400
Aggregated Statistics For Year 2003 (Based on 2 partial tracts)
A) FHA, FSA/RHS & VA Home Purchase Loans
B) Conventional Home Purchase Loans
C) Refinancings
D) Home Improvement Loans
E) Loans on Dwellings For 5+ Families
F) Non-occupant Loans on < 5 Family Dwellings (A B C & D)
Number
Average Value
Number
Average Value
Number
Average Value
Number
Average Value
Number
Average Value
Number
Average Value
LOANS ORIGINATED
6
$117,387
51
$160,876
179
$151,306
12
$27,468
1
$575,280
53
$203,004
APPLICATIONS APPROVED, NOT ACCEPTED
2
$90,955
9
$141,573
24
$126,198
1
$46,640
0
$0
8
$157,909
APPLICATIONS DENIED
1
$85,510
8
$88,040
44
$168,254
4
$63,552
0
$0
6
$362,398
APPLICATIONS WITHDRAWN
0
$0
9
$137,168
31
$173,711
1
$38,870
0
$0
7
$299,189
FILES CLOSED FOR INCOMPLETENESS
0
$0
3
$109,097
7
$159,034
1
$4,660
0
$0
1
$91,730
Aggregated Statistics For Year 2002 (Based on 2 partial tracts)
A) FHA, FSA/RHS & VA Home Purchase Loans
B) Conventional Home Purchase Loans
C) Refinancings
D) Home Improvement Loans
F) Non-occupant Loans on < 5 Family Dwellings (A B C & D)
Number
Average Value
Number
Average Value
Number
Average Value
Number
Average Value
Number
Average Value
LOANS ORIGINATED
2
$80,850
39
$136,165
131
$147,439
11
$43,605
34
$183,946
APPLICATIONS APPROVED, NOT ACCEPTED
0
$0
1
$39,650
20
$137,250
0
$0
1
$85,510
APPLICATIONS DENIED
1
$71,520
13
$113,142
25
$109,116
2
$19,435
5
$139,466
APPLICATIONS WITHDRAWN
1
$85,510
2
$108,445
23
$143,481
2
$29,155
2
$134,880
FILES CLOSED FOR INCOMPLETENESS
1
$135,270
2
$130,215
4
$138,378
0
$0
2
$130,215
Aggregated Statistics For Year 2001 (Based on 2 partial tracts)
A) FHA, FSA/RHS & VA Home Purchase Loans
B) Conventional Home Purchase Loans
C) Refinancings
D) Home Improvement Loans
F) Non-occupant Loans on < 5 Family Dwellings (A B C & D)
Number
Average Value
Number
Average Value
Number
Average Value
Number
Average Value
Number
Average Value
LOANS ORIGINATED
4
$86,875
38
$121,479
103
$133,018
9
$17,448
27
$139,788
APPLICATIONS APPROVED, NOT ACCEPTED
0
$0
5
$59,704
10
$94,687
2
$4,665
2
$51,695
APPLICATIONS DENIED
1
$100,280
14
$97,730
30
$139,284
1
$11,660
1
$136,820
APPLICATIONS WITHDRAWN
3
$88,623
2
$143,820
20
$112,101
1
$13,220
5
$118,632
FILES CLOSED FOR INCOMPLETENESS
0
$0
2
$80,070
4
$159,172
1
$38,090
0
$0
Aggregated Statistics For Year 2000 (Based on 2 partial tracts)
A) FHA, FSA/RHS & VA Home Purchase Loans
B) Conventional Home Purchase Loans
C) Refinancings
D) Home Improvement Loans
F) Non-occupant Loans on < 5 Family Dwellings (A B C & D)
Number
Average Value
Number
Average Value
Number
Average Value
Number
Average Value
Number
Average Value
LOANS ORIGINATED
1
$73,080
26
$99,029
25
$137,755
9
$53,727
7
$74,741
APPLICATIONS APPROVED, NOT ACCEPTED
0
$0
4
$55,972
7
$138,044
1
$17,880
2
$139,930
APPLICATIONS DENIED
1
$56,750
12
$55,972
18
$83,354
4
$24,292
3
$62,710
APPLICATIONS WITHDRAWN
2
$62,580
3
$81,887
13
$92,809
2
$22,155
1
$19,430
FILES CLOSED FOR INCOMPLETENESS
0
$0
2
$106,505
2
$174,525
0
$0
1
$92,510
Aggregated Statistics For Year 1999 (Based on 1 partial tract)
A) FHA, FSA/RHS & VA Home Purchase Loans
B) Conventional Home Purchase Loans
C) Refinancings
D) Home Improvement Loans
F) Non-occupant Loans on < 5 Family Dwellings (A B C & D)

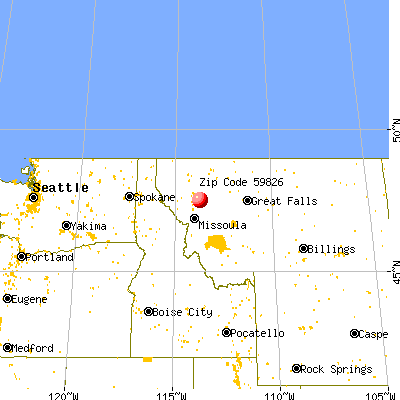


 Nearest zip codes: 59865, 59868, 59821, 59864, 59911, 59863.