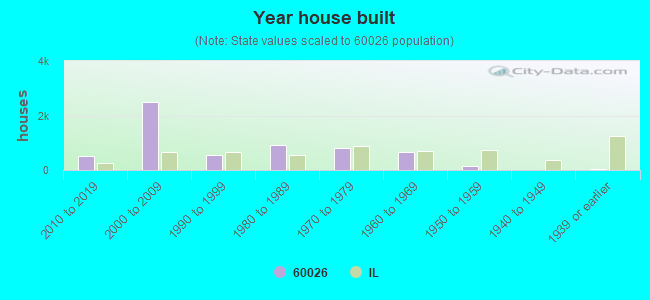
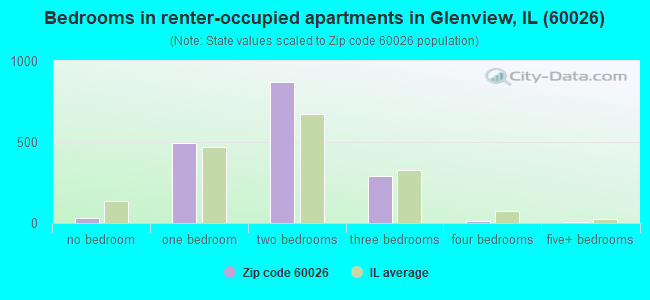
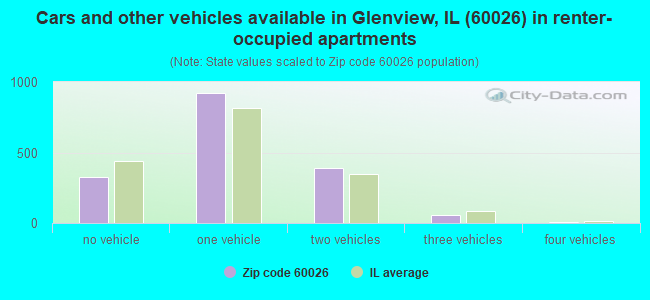
Houses and condos: 5,986 Renter-occupied apartments: 1,710
% of renters here:
30%
State:
33%
March 2022 cost of living index in zip code 60026: 98.8 (near average, U.S. average is 100)
Land area: 4.1 sq. mi. Water area: 0.0 sq. mi.
Population density: 3,569 people per square mile
(average).
OSM Map
Google Map
MSN Map
OSM Map
General Map
Google Map
MSN Map
OSM Map
Google Map
MSN Map
OSM Map
Google Map
MSN Map
Please wait while loading the map...
Real estate property taxes paid for housing units in 2022:
This zip code:
1.4% ($9,718)
Illinois:
2.0% ($4,912)
Median real estate property taxes paid for housing units with mortgages in 2022: $9,569 (1.4%) Median real estate property taxes paid for housing units with no mortgage in 2022: $9,944 (1.4%)
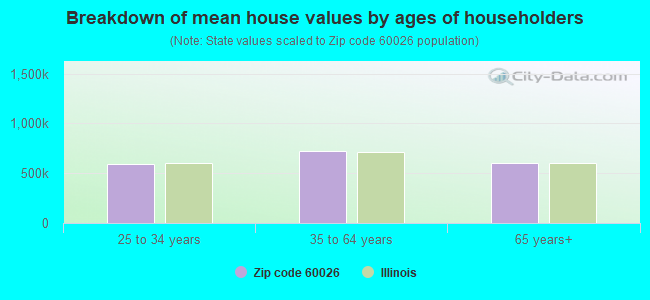
Estimated median house/condo value in 2022: $686,823
60026:
$686,823
Illinois:
$251,600
According to our research of Illinois and other state lists, there were 3 registered sex offenders living in 60026 zip code as of May 18, 2024. The ratio of all residents to sex offenders in zip code 60026 is 4,878 to 1. The ratio of registered sex offenders to all residents in this zip code is much lower than the state average.
Median resident age:
This zip code:
47.2 years
Illinois median age:
39.1 years
Average household size:
This zip code:
2.5 people
Illinois:
2.4 people
Averages for the 2020 tax year for zip code 60026, filed in 2021:
Average Adjusted Gross Income (AGI) in 2020: $256,234 (Individual Income Tax Returns)
Here:
$256,234
State:
$82,626
Salary/wage: $145,234 (reported on 72.9% of returns)
Here:
$145,234
State:
$66,640
(% of AGI for various income ranges: 1202.2% for AGIs below $25k, 3609.2% for AGIs $25k-50k, 6319.3% for AGIs $50k-75k, 9226.6% for AGIs $75k-100k, 17398.4% for AGIs $100k-200k, 102340.8% for AGIs over 200k)
Taxable interest for individuals: $4,535 (reported on 57.2% of returns)
This zip code:
$4,535
Illinois:
$2,376
(% of AGI for various income ranges: 61.8% for AGIs below $25k, 94.9% for AGIs $25k-50k, 195.9% for AGIs $50k-75k, 294.5% for AGIs $75k-100k, 516.6% for AGIs $100k-200k, 2271.3% for AGIs over 200k)
Ordinary dividends: $18,001 (reported on 55.3% of returns)
Here:
$18,001
State:
$9,061
(% of AGI for various income ranges: 144.0% for AGIs below $25k, 271.9% for AGIs $25k-50k, 615.9% for AGIs $50k-75k, 1120.3% for AGIs $75k-100k, 2021.8% for AGIs $100k-200k, 9022.9% for AGIs over 200k)
Net capital gain/loss in AGI: +$71,444 (reported on 52.5% of returns)
Here:
+$71,444
State:
+$31,684
(% of AGI for various income ranges: 61.7% for AGIs below $25k, 160.6% for AGIs $25k-50k, 345.9% for AGIs $50k-75k, 686.9% for AGIs $75k-100k, 1873.4% for AGIs $100k-200k, 46035.2% for AGIs over 200k)
Profit/loss from business: +$28,060 (reported on 18.2% of returns)
Here:
+$28,060
State:
+$12,175
(% of AGI for various income ranges: 131.6% for AGIs below $25k, 305.8% for AGIs $25k-50k, 242.7% for AGIs $50k-75k, 559.3% for AGIs $75k-100k, 957.4% for AGIs $100k-200k, 4524.6% for AGIs over 200k)
Taxable individual retirement arrangement distribution: $48,095 (reported on 16.0% of returns)
60026:
$48,095
Illinois:
$21,613
(% of AGI for various income ranges: 97.3% for AGIs below $25k, 220.4% for AGIs $25k-50k, 543.2% for AGIs $50k-75k, 1039.7% for AGIs $75k-100k, 2456.8% for AGIs $100k-200k, 5764.2% for AGIs over 200k)
Self-employed (Keogh) retirement plans: $36,177 (reported on 3.2% of returns)
60026:
$36,177
Illinois:
$30,962
(% of AGI for various income ranges: 154.8% for AGIs $100k-200k, 1346.0% for AGIs over 200k)
Total itemized deductions: $41,471 (reported on 27.1% of returns)
Here:
$41,471
State:
$34,948
(% of AGI for various income ranges: 322.3% for AGIs below $25k, 581.7% for AGIs $25k-50k, 982.0% for AGIs $50k-75k, 1682.8% for AGIs $75k-100k, 2901.5% for AGIs $100k-200k, 8474.8% for AGIs over 200k)
Charity contributions: $12,718 (reported on 23.9% of returns)
Here:
$12,718
State:
$13,122
(% of AGI for various income ranges: 13.9% for AGIs below $25k, 37.9% for AGIs $25k-50k, 99.8% for AGIs $50k-75k, 177.9% for AGIs $75k-100k, 457.3% for AGIs $100k-200k, 3202.9% for AGIs over 200k)
Taxes paid: $9,153 (reported on 27.0% of returns)
60026:
$9,153
State:
$8,563
(% of AGI for various income ranges: 62.0% for AGIs below $25k, 124.5% for AGIs $25k-50k, 258.3% for AGIs $50k-75k, 390.0% for AGIs $75k-100k, 686.8% for AGIs $100k-200k, 1772.9% for AGIs over 200k)
Earned income credit: $1,640 (reported on 5.1% of returns)
Here:
$1,640
State:
$2,311
(% of AGI for various income ranges: 44.2% for AGIs below $25k, 39.1% for AGIs $25k-50k)
Percentage of individuals using paid preparers for their 2020 taxes: 91.8%
Here:
92%
State:
93%
(% for various income ranges: 88.7% for AGIs below $25k, 91.2% for AGIs $25k-50k, 92.5% for AGIs $50k-75k, 92.7% for AGIs $75k-100k, 92.0% for AGIs $100k-200k, 94.0% for AGIs over 200k)
Averages for the 2012 tax year for zip code 60026, filed in 2013:
Average Adjusted Gross Income (AGI) in 2012: $166,128 (Individual Income Tax Returns)
Here:
$166,128
State:
$68,058
Salary/wage: $126,148 (reported on 75.9% of returns)
Here:
$126,148
State:
$55,396
(% of AGI for various income ranges: 68.6% for AGIs below $25k, 71.0% for AGIs $25k-50k, 59.2% for AGIs $50k-75k, 55.6% for AGIs $75k-100k, 60.6% for AGIs $100k-200k, 56.1% for AGIs over 200k)
Taxable interest for individuals: $4,539 (reported on 59.7% of returns)
This zip code:
$4,539
Illinois:
$1,969
(% of AGI for various income ranges: 3.6% for AGIs below $25k, 1.7% for AGIs $25k-50k, 2.2% for AGIs $50k-75k, 2.0% for AGIs $75k-100k, 1.8% for AGIs $100k-200k, 1.5% for AGIs over 200k)
Ordinary dividends: $16,314 (reported on 52.9% of returns)
Here:
$16,314
State:
$7,786
(% of AGI for various income ranges: 8.6% for AGIs below $25k, 4.3% for AGIs $25k-50k, 5.9% for AGIs $50k-75k, 6.7% for AGIs $75k-100k, 5.1% for AGIs $100k-200k, 5.1% for AGIs over 200k)
Net capital gain/loss in AGI: +$26,635 (reported on 49.5% of returns)
Here:
+$26,635
State:
+$22,183
(% of AGI for various income ranges: 1.5% for AGIs $25k-50k, 1.5% for AGIs $50k-75k, 3.0% for AGIs $75k-100k, 2.6% for AGIs $100k-200k, 10.4% for AGIs over 200k)
Profit/loss from business: +$30,055 (reported on 18.2% of returns)
Here:
+$30,055
State:
+$12,903
(% of AGI for various income ranges: 12.0% for AGIs below $25k, 6.2% for AGIs $25k-50k, 3.1% for AGIs $50k-75k, 3.3% for AGIs $75k-100k, 4.9% for AGIs $100k-200k, 2.6% for AGIs over 200k)
Taxable individual retirement arrangement distribution: $43,697 (reported on 19.6% of returns)
60026:
$43,697
Illinois:
$17,929
(% of AGI for various income ranges: 6.9% for AGIs below $25k, 4.3% for AGIs $25k-50k, 6.8% for AGIs $50k-75k, 9.0% for AGIs $75k-100k, 7.3% for AGIs $100k-200k, 4.3% for AGIs over 200k)
Self-employment retirement plans: $27,919 (reported on 3.3% of returns)
60026:
$27,919
Illinois:
$24,666
Total itemized deductions: $43,221 (17% of AGI, reported on 58.9% of returns)
Here:
$43,221
State:
$26,433
Here:
16.8% of AGI
State:
19.2% of AGI
(% of AGI for various income ranges: 30.9% for AGIs below $25k, 18.2% for AGIs $25k-50k, 22.2% for AGIs $50k-75k, 22.7% for AGIs $75k-100k, 20.3% for AGIs $100k-200k, 12.8% for AGIs over 200k)
Charity contributions: $6,830 (reported on 53.0% of returns)
Here:
$6,830
State:
$4,525
(% of AGI for various income ranges: 1.7% for AGIs below $25k, 1.4% for AGIs $25k-50k, 1.9% for AGIs $50k-75k, 2.0% for AGIs $75k-100k, 2.3% for AGIs $100k-200k, 2.2% for AGIs over 200k)
Taxes paid: $21,858 (reported on 58.6% of returns)
60026:
$21,858
State:
$11,968
(% of AGI for various income ranges: 10.3% for AGIs below $25k, 6.9% for AGIs $25k-50k, 8.6% for AGIs $50k-75k, 9.7% for AGIs $75k-100k, 9.5% for AGIs $100k-200k, 7.1% for AGIs over 200k)
Earned income credit: $1,700 (reported on 5.4% of returns)
Here:
$1,700
State:
$2,349
(% of AGI for various income ranges: 2.3% for AGIs below $25k, 0.6% for AGIs $25k-50k)
Percentage of individuals using paid preparers for their 2012 taxes: 67.8%
Here:
68%
State:
57%
(% for various income ranges: 63.5% for AGIs below $25k, 65.6% for AGIs $25k-50k, 66.7% for AGIs $50k-75k, 69.8% for AGIs $75k-100k, 66.9% for AGIs $100k-200k, 75.2% for AGIs over 200k)
Averages for the 2004 tax year for zip code 60026, filed in 2005:
Average Adjusted Gross Income (AGI) in 2004: $120,954 (Individual Income Tax Returns)
Here:
$120,954
State:
$54,625
Salary/wage: $97,849 (reported on 77.9% of returns)
Here:
$97,849
State:
$46,811
(% of AGI for various income ranges: 86.3% for AGIs below $10k, 68.4% for AGIs $10k-25k, 78.5% for AGIs $25k-50k, 65.7% for AGIs $50k-75k, 63.9% for AGIs $75k-100k, 61.6% for AGIs over 100k)
Taxable interest for individuals: $4,457 (reported on 68.8% of returns)
This zip code:
$4,457
Illinois:
$2,101
(% of AGI for various income ranges: 13.6% for AGIs below $10k, 6.0% for AGIs $10k-25k, 3.5% for AGIs $25k-50k, 4.1% for AGIs $50k-75k, 3.4% for AGIs $75k-100k, 2.2% for AGIs over 100k)
Taxable dividends: $8,500 (reported on 55.7% of returns)
Here:
$8,500
State:
$4,306
(% of AGI for various income ranges: 12.4% for AGIs below $10k, 6.4% for AGIs $10k-25k, 3.7% for AGIs $25k-50k, 4.3% for AGIs $50k-75k, 5.0% for AGIs $75k-100k, 3.7% for AGIs over 100k)
Net capital gain/loss: +$27,471 (reported on 49.1% of returns)
Here:
+$27,471
State:
+$17,321
(% of AGI for various income ranges: -6.0% for AGIs below $10k, 2.4% for AGIs $10k-25k, 0.9% for AGIs $25k-50k, 2.0% for AGIs $50k-75k, 3.2% for AGIs $75k-100k, 13.2% for AGIs over 100k)
Profit/loss from business: +$25,209 (reported on 15.7% of returns)
Here:
+$25,209
State:
+$11,771
(% of AGI for various income ranges: 6.4% for AGIs below $10k, 7.8% for AGIs $10k-25k, 3.3% for AGIs $25k-50k, 5.7% for AGIs $50k-75k, 4.3% for AGIs $75k-100k, 2.9% for AGIs over 100k)
IRA payment deduction: $3,970 (reported on 3.4% of returns)
60026:
$3,970
Illinois:
$3,087
(% of AGI for various income ranges: 1.0% for AGIs below $10k, 0.3% for AGIs $25k-50k, 0.3% for AGIs $50k-75k, 0.2% for AGIs $75k-100k, 0.1% for AGIs over 100k)
Self-employed pension: $19,898 (reported on 3.4% of returns)
Here:
$19,898
Illinois:
$16,965
(% of AGI for various income ranges: 0.9% for AGIs $10k-25k, 0.5% for AGIs $75k-100k, 0.6% for AGIs over 100k)
Total itemized deductions: $32,087 (17% of AGI, reported on 55.0% of returns)
Here:
$32,087
State:
$20,239
Here:
16.5% of AGI
State:
19.5% of AGI
(% of AGI for various income ranges: 26.7% for AGIs below $10k, 21.1% for AGIs $10k-25k, 18.0% for AGIs $25k-50k, 23.3% for AGIs $50k-75k, 23.9% for AGIs $75k-100k, 13.0% for AGIs over 100k)
Charity contributions deductions: $5,365 (3% of AGI, reported on 51.2% of returns)
Here:
$5,365
State:
$3,719
Here:
2.7% of AGI
State:
3.4% of AGI
(% of AGI for various income ranges: 1.3% for AGIs below $10k, 1.7% for AGIs $10k-25k, 2.0% for AGIs $25k-50k, 2.2% for AGIs $50k-75k, 2.7% for AGIs $75k-100k, 2.3% for AGIs over 100k)
Total tax: $28,952 (reported on 79.5% of returns)
60026:
$28,952
State:
$9,882
(% of AGI for various income ranges: 3.6% for AGIs below $10k, 4.4% for AGIs $10k-25k, 6.5% for AGIs $25k-50k, 9.0% for AGIs $50k-75k, 10.4% for AGIs $75k-100k, 21.4% for AGIs over 100k)
Earned income credit: $1,254 (reported on 5.8% of returns)
Here:
$1,254
State:
$1,788
Percentage of individuals using paid preparers for their 2004 taxes: 61.0%
Here:
61%
State:
61%
(% for various income ranges: 50.4% for AGIs below $10k, 59.0% for AGIs $10k-25k, 58.8% for AGIs $25k-50k, 68.5% for AGIs $50k-75k, 68.8% for AGIs $75k-100k, 64.8% for AGIs over 100k)
Likely homosexual households (counted as self-reported same-sex unmarried-partner households)
Lesbian couples: 0.0% of all households
Gay men: 0.2% of all households
Household received Food Stamps/SNAP in the past 12 months: 188 Household did not receive Food Stamps/SNAP in the past 12 months: 5,436
Women who had a birth in the past 12 months: 124 (123 now married, 0 unmarried) Women who did not have a birth in the past 12 months: 2,589 (1,262 now married, 1,318 unmarried)
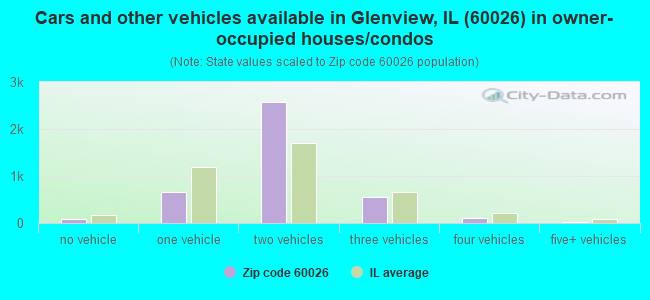
Housing units in zip code 60026 with a mortgage: 2,197 (169 second mortgage, 142 both second mortgage and home equity loan) Houses without a mortgage: 53
Median monthly owner costs for units with a mortgage: $3,291 Median monthly owner costs for units without a mortgage: $1,519
Residents with income below the poverty level in 2022:
This zip code:
4.5%
Whole state:
11.9%
Residents with income below 50% of the poverty level in 2022:
This zip code:
2.1%
Whole state:
5.7%
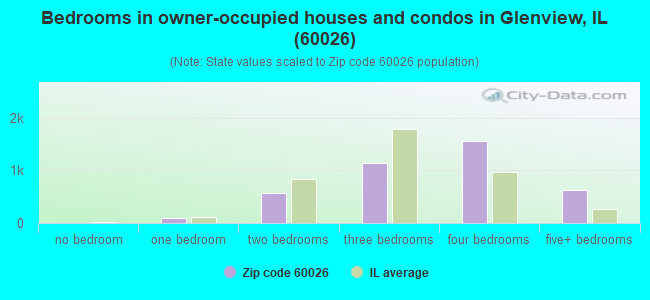
Median number of rooms in houses and condos:
Here:
7.6
State:
6.4
Median number of rooms in apartments:
Here:
4.0
State:
4.1
Notable locations in this zip code not listed on our city pages
Notable locations in zip code 60026: Station Golf Links of Glenview (A), Glenview Fire Department Station 14 (B), Glenview Fire Department Station 8 (C). Display/hide their locations on the map
Churches in zip code 60026 include: Korean Canaan Presbyterian Church (A), Saint Catherine Laboure Church (B), Himalayan Institute of Hatha Yoga (C). Display/hide their locations on the map
Parks in zip code 60026 include: Jennings Park (1), Willow Park (2), Hawthorne Glen Park (3), Indian Ridge Park (4). Display/hide their locations on the map
In group quarters: 357 (-1 institutionalized population)
Size of family households: 1,805 2-persons, 730 3-persons, 1,000 4-persons, 332 5-persons, 122 6-persons, 10 7-or-more-persons
Size of nonfamily households: 1,545 1-person, 123 2-persons, 11 5-persons
2,884 married couples with children.
397 single-parent households (34 men, 363 women).
69.1% of residents of 60026 zip code speak English at home.
5.6% of residents speak Spanish at home (91% very well, 6% well, 2% not well, 1% not at all).
13.1% of residents speak other Indo-European language at home (74% very well, 17% well, 9% not well).
12.4% of residents speak Asian or Pacific Island language at home (51% very well, 38% well, 10% not well, 1% not at all).
0.8% of residents speak other language at home (95% very well, 5% well).
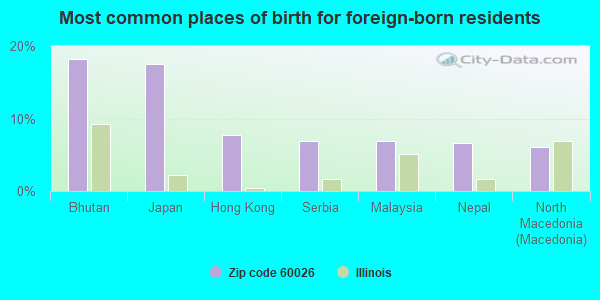
Foreign born population: 3,267 (22.5%) (82.9% of them are naturalized citizens)
This zip code:
22.5%
Whole state:
14.4%
18%Bhutan
18%Japan
8%Hong Kong
7%Serbia
7%Malaysia
7%Nepal
6%North Macedonia (Macedonia)
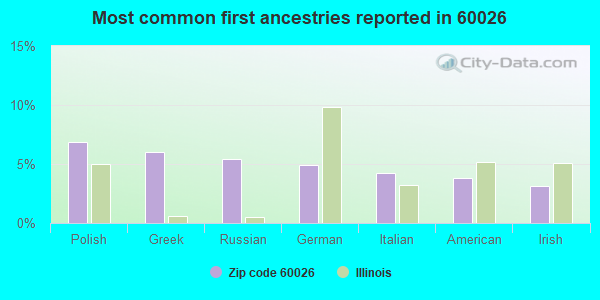
7%Polish
6%Greek
5%Russian
5%German
4%Italian
4%American
3%Irish
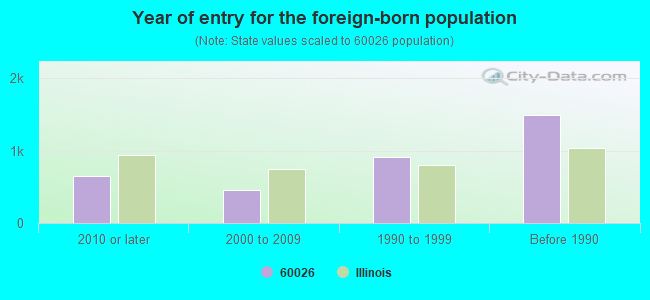
Year of entry for the foreign-born population
6552010 or later
4582000 to 2009
9141990 to 1999
1,493Before 1990
Facilities with environmental interests located in this zip code:
DEPT OF THE NAVY (I-294 AT WEST LAKE AVENUE in GLENVIEW, IL)
STATE MASTER (Illinois EPA Project) - National Pollutant Discharge Elimination System Permit National Pollutant Discharge Elimination System NON-MAJOR (Tracking pollutant discharge elimination systems) - permit Organizations: DEPARTMENT OF THE NAVY (CONTACT/OWNER)
PORTRAIT INNOVATIONS (1825 TOWER DR in GLENVIEW, IL)
STATE MASTER (Illinois EPA Project) - HAZARDOUS WASTE PROGRAM Small Quantity Generators, between 100 kg and 1000 kg of hazardous waste/month (Resource Conservation and Recovery Act (tracking hazardous waste))
Housing units lacking complete plumbing facilities: 0.6% Housing units lacking complete kitchen facilities: 0.1%
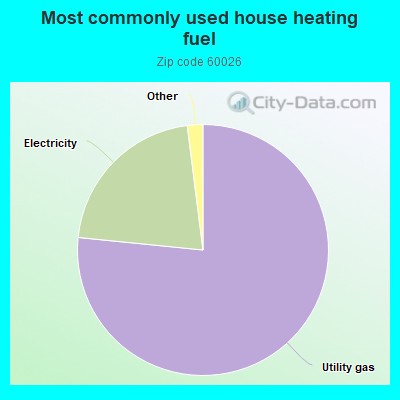
76.6%Utility gas
21.4%Electricity
0.7%No fuel used
0.5%Bottled, tank, or LP gas
0.5%Other fuel
Place of birth for U.S.-born residents:
This state: 8,959
Northeast: 445
Midwest: 996
South: 258
West: 359
91% of the 60026 zip code residents lived in the same house 1 year ago. Out of people who lived in different houses, 75% moved from this county. Out of people who lived in different houses, 7% moved from different county within same state. Out of people who lived in different houses, 10% moved from different state. Out of people who lived in different houses, 5% moved from abroad.
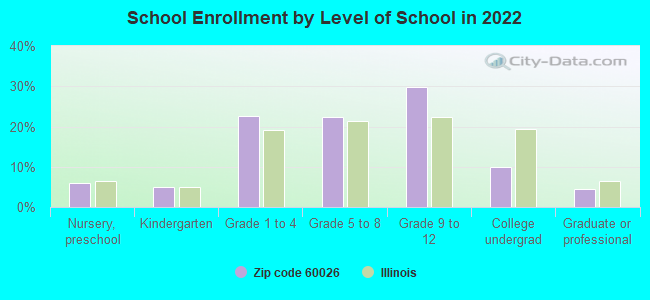
Private vs. public school enrollment:
Students in private schools in grades 1 to 8 (elementary and middle school): 92
Here:
5.6%
Illinois:
13.3%
Students in private schools in grades 9 to 12 (high school): 16
Here:
1.5%
Illinois:
9.9%
Students in private undergraduate colleges: 208
Here:
56.7%
Illinois:
27.4%
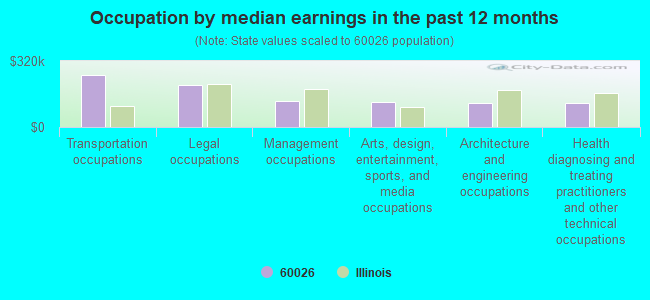
Occupation by median earnings in the past 12 months ($)
254,522Transportation occupations
205,205Legal occupations
125,196Management occupations
122,720Arts, design, entertainment, sports, and media occupations
117,279Architecture and engineering occupations
117,170Health diagnosing and treating practitioners and other technical occupations
Companies with federal contracts located in this zip code:
UNITED STANDARD INDUSTRIES INC (2062 LEHIGH AVE in GLENVIEW, IL; small business) : $10,896,715 in 171 contractsfrom 1999 to 2006
Contracts for Guns, through 30 mm, Guided Missile Handling and Servicing Equipment, Guns, over 30 mm up to 75 mm, Guns, 75 mm through 125 mm, and moreby Army, Navy, Defense Logistics Agency Signed by year:2000: $368,974; 2001: $458,429; 2002: $108,047; 2003: $1,410,517; 2004: $2,824,507; 2005: $5,105,025; 2006: $550,377.
Biggest contracts:
$2,180,000 with Army for Guns, through 30 mm. Signed on 2005-01-25. Completion date: 2005-09-30.
$1,545,000, same as above.Signed on 2004-02-23. Completion date: 2005-09-30.
$787,500, same as above.Signed on 2005-08-04. Completion date: 2005-09-30.
$467,000, same as above.Signed on 2003-05-20. Completion date: 2005-09-30.
GUARNIERI ROBERTO - CENTRO SAL (VIA DEI TIGLI in NUMANA, In; small business) 3 employees, $0 revenue. Woman Owned Business: $4,512,062 in 144 contractsfrom 2000 to 2003
Contracts for Guard Services by Public Buildings Service, Bureau of Immigration and Customs Enforcement Signed by year:2000: $1,200,000; 2001: $1,339,000; 2002: $1,445,435; 2003: $527,627; 2004: $0; 2005: $0; 2006: $0.
Biggest contracts:
$238,000 with Public Buildings Service for Guard Services. Taking place in NJ. Signed on 2000-05-15. Completion date: 2001-04-15.
$214,708, same as above.Signed on 2002-10-15. Completion date: 2003-02-15.
$205,000, same as above.Signed on 2000-04-15. Completion date: 2001-04-15.
$182,000, same as above.Signed on 2002-06-15. Completion date: 2001-09-15.
MAGNAFLUX, A DIVISION OF ITW I (3624 WEST LAKE AVENUE in GLENVIEW, IL) : $1,097,361 in 36 contractsfrom 1999 to 2006
Contracts for Physical Properties Testing and Inspection, Miscellaneous Chemical Specialties, Bending and Forming Machines, Miscellaneous Special Industry Machinery, and moreby Army, Navy, Defense Logistics Agency, Air Force, and others Signed by year:2000: $127,937; 2001: $151,011; 2002: $280,072; 2003: $208,198; 2004: $83,088; 2005: $130,352; 2006: $43,803.
Biggest contracts:
$165,000 with Army for Physical Properties Testing and Inspection. Signed on 2002-07-24. Completion date: 2002-09-27.
$151,958 with Navy for Miscellaneous Chemical Specialties. Signed on 2003-11-26. Completion date: 2004-12-31.
$127,937 with Defense Logistics Agency for Bending and Forming Machines. Signed on 2000-06-02. Completion date: 2000-09-30.
$125,776 with Air Force for Physical Properties Testing and Inspection. Signed on 2001-04-30. Completion date: 2001-07-31.
ILLINOIS TOOL WORKS INC (3700 WEST LAKE AVENUE in GLENVIEW, IL) : $877,792 in 6 contractsfrom 2001 to 2006
Contracts for Gears, Pulleys, Sprockets, and Transmission Chain, Wrapping and Packaging Machinery by Army, Defense Logistics Agency Signed by year:2000: $0; 2001: $116,792; 2002: $32,620; 2003: $76,850; 2004: $70,840; 2005: $433,090; 2006: $147,600.
Biggest contracts:
$433,090 with Army for Gears, Pulleys, Sprockets, and Transmission Chain. Signed on 2005-01-20. Completion date: 2010-12-31.
$147,600, same as above.Signed on 2006-03-28. Completion date: 2010-12-31.
$116,792 with Defense Logistics Agency for Gears, Pulleys, Sprockets, and Transmission Chain. Signed on 2001-01-19. Completion date: 2001-04-19.
$76,850 with Army for Wrapping and Packaging Machinery. Signed on 2003-09-18. Completion date: 2003-12-18.
GLOBAL INDUSTRIAL PRODUCTS, IN (3338 WEST LAKE AVE in GLENVIEW, IL; small business)
$3,899 with Navy for Miscellaneous Electrical and Electronic Components. Signed on 2005-05-13. Completion date: 2005-07-07.
Top industries in this zip code by the number of employees in 2005:
Wholesale Trade: Other Electronic Parts and Equipment Merchant Wholesalers (500-999 employees: 1 establishment)
Professional, Scientific, and Technical Services: Marketing Research and Public Opinion Polling (50-99: 1)
Administrative and Support and Waste Management and Remediation Services: Travel Agencies (50-99: 1)
Health Care and Social Assistance: Offices of Physicians (except Mental Health Specialists) (10-19: 3, 5-9: 1, 1-4: 8)
Administrative and Support and Waste Management and Remediation Services: Office Administrative Services (20-49: 1, 5-9: 1, 1-4: 1)
Fatal accident statistics in 2013:
Fatal accident count: 1
Vehicles involved in fatal accidents: 2
Fatal accidents caused by drunken drivers: 0
Fatalities: 1
Persons involved in fatal accidents: 2
Pedestrians involved in fatal accidents: 0
Fatal accident statistics in 2011:
Fatal accident count: 1
Vehicles involved in fatal accidents: 1
Fatal accidents caused by drunken drivers: 1
Fatalities: 1
Persons involved in fatal accidents: 1
Pedestrians involved in fatal accidents: 0
2004 - 2018 National Fire Incident Reporting System (NFIRS) incidents
According to the data from the years 2004 - 2018 the average number of fires per year is 20. The highest number of reported fire incidents - 33 took place in 2007, and the least - 3 in 2004. The data has a rising trend.
When looking into fire subcategories, the most reports belonged to: Outside Fires (37.9%), and Structure Fires (34.5%).
Fire incident types reported to NFIRS in Zip Code 60026


 According to the data from the years 2004 - 2018 the average number of fires per year is 20. The highest number of reported fire incidents - 33 took place in 2007, and the least - 3 in 2004. The data has a rising trend.
 When looking into fire subcategories, the most reports belonged to: Outside Fires (37.9%), and Structure Fires (34.5%).