Estimated zip code population in 2022: 6,563 Zip code population in 2010: 6,897 Zip code population in 2000: 6,853
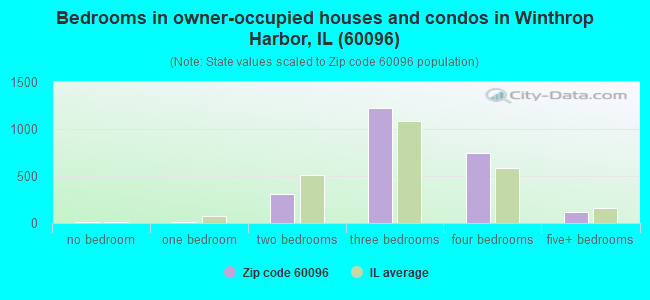
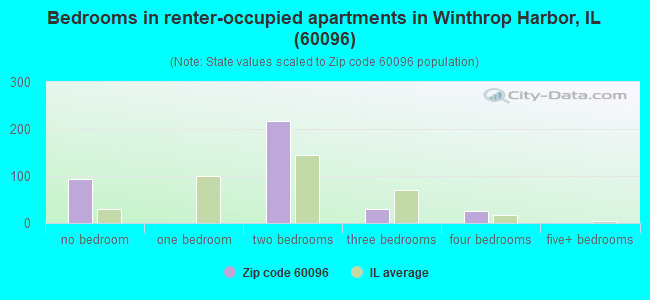
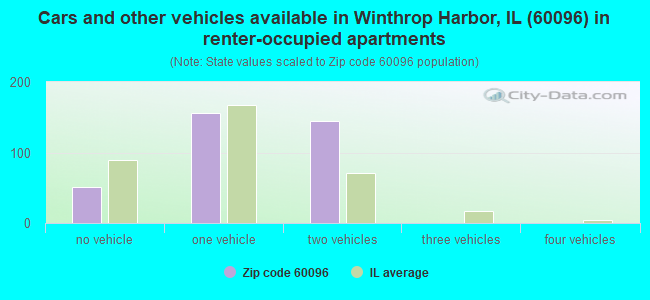
Houses and condos: 2,927 Renter-occupied apartments: 356
% of renters here:
13%
State:
33%
March 2022 cost of living index in zip code 60096: 93.8 (less than average, U.S. average is 100)
Land area: 4.8 sq. mi. Water area: 0.8 sq. mi.
Population density: 1,366 people per square mile
(low).
OSM Map
General Map
Google Map
MSN Map
OSM Map
General Map
Google Map
MSN Map
OSM Map
General Map
Google Map
MSN Map
OSM Map
General Map
Google Map
MSN Map
Please wait while loading the map...
Real estate property taxes paid for housing units in 2022:
This zip code:
2.9% ($6,970)
Illinois:
2.0% ($4,912)
Median real estate property taxes paid for housing units with mortgages in 2022: $7,118 (2.8%) Median real estate property taxes paid for housing units with no mortgage in 2022: $6,842 (2.9%)
Business Search- 14 Million verified businesses
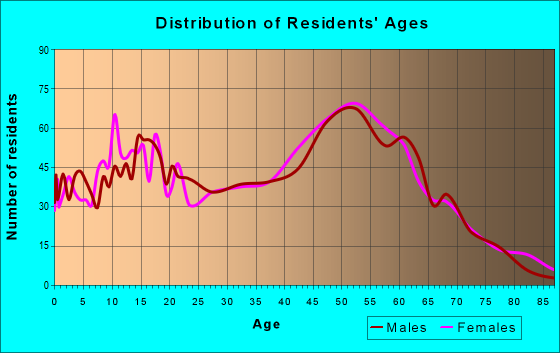
Males: 3,273
(49.9%)
Females: 3,289
(50.1%)
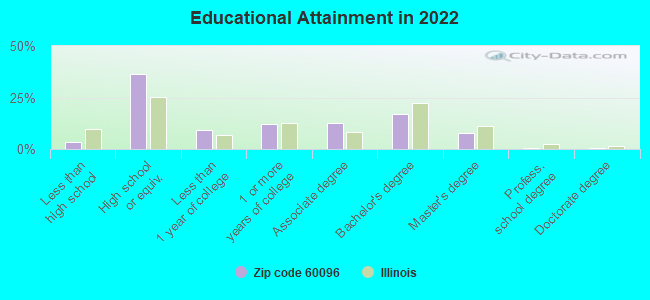
For population 25 years and over in 60096:
High school or higher: 95.9%
Bachelor's degree or higher: 25.8%
Graduate or professional degree: 8.8%
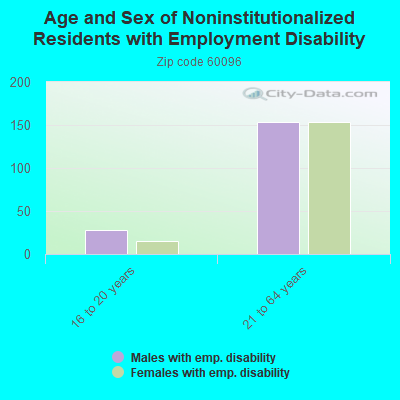
Unemployed: 9.4%
Mean travel time to work (commute): 31.0 minutes
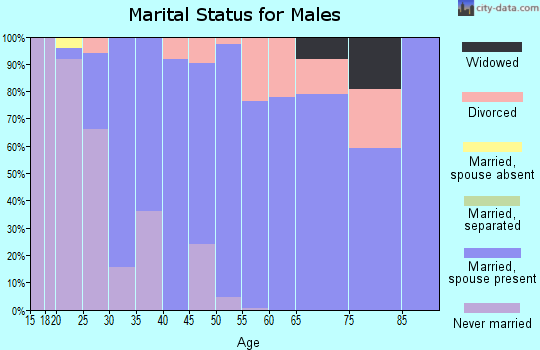
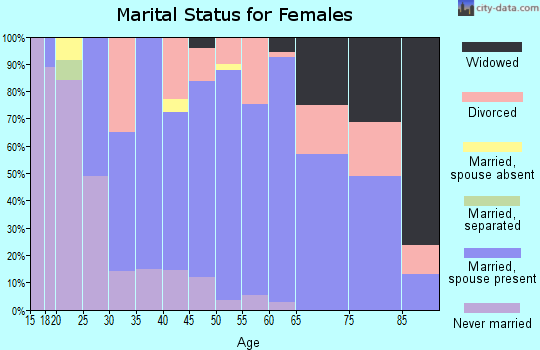
For population 15 years and over in 60096:
Never married: 24.1%
Now married: 60.0%
Separated: 1.3%
Widowed: 5.3%
Divorced: 9.3%
Zip code 60096 compared to state average:
Unemployed percentage above state average.
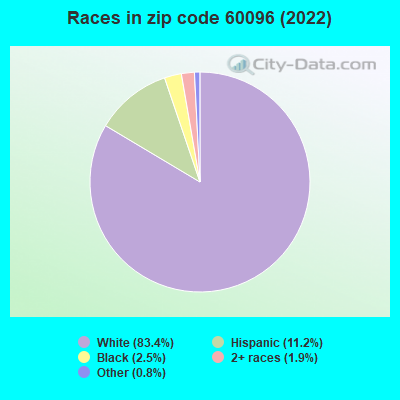
Black race population percentage significantly below state average.
Median age significantly above state average.
Foreign-born population percentage significantly below state average.
Renting percentage significantly below state average.
Length of stay since moving in significantly above state average.
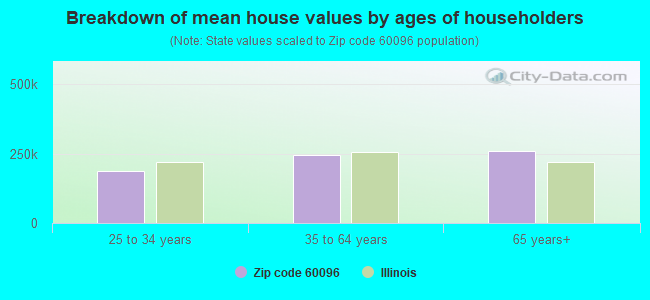
Estimated median house/condo value in 2022: $243,708
60096:
$243,708
Illinois:
$251,600
According to our research of Illinois and other state lists, there were 10 registered sex offenders living in 60096 zip code as of May 18, 2024. The ratio of all residents to sex offenders in zip code 60096 is 695 to 1. The ratio of registered sex offenders to all residents in this zip code is near the state average.
Median resident age:
This zip code:
51.6 years
Illinois median age:
39.1 years
Average household size:
This zip code:
2.4 people
Illinois:
2.4 people
Averages for the 2020 tax year for zip code 60096, filed in 2021:
Average Adjusted Gross Income (AGI) in 2020: $69,817 (Individual Income Tax Returns)
Here:
$69,817
State:
$82,626
Salary/wage: $59,192 (reported on 78.8% of returns)
Here:
$59,192
State:
$66,640
(% of AGI for various income ranges: 1146.0% for AGIs below $25k, 3376.9% for AGIs $25k-50k, 5498.8% for AGIs $50k-75k, 9201.5% for AGIs $75k-100k, 15569.5% for AGIs $100k-200k, 41174.0% for AGIs over 200k)
Taxable interest for individuals: $1,171 (reported on 33.5% of returns)
This zip code:
$1,171
Illinois:
$2,376
(% of AGI for various income ranges: 16.6% for AGIs below $25k, 16.4% for AGIs $25k-50k, 36.7% for AGIs $50k-75k, 64.4% for AGIs $75k-100k, 163.9% for AGIs $100k-200k, 294.0% for AGIs over 200k)
Ordinary dividends: $8,095 (reported on 23.8% of returns)
Here:
$8,095
State:
$9,061
(% of AGI for various income ranges: 31.9% for AGIs below $25k, 60.6% for AGIs $25k-50k, 162.1% for AGIs $50k-75k, 171.5% for AGIs $75k-100k, 602.0% for AGIs $100k-200k, 4968.0% for AGIs over 200k)
Net capital gain/loss in AGI: +$9,330 (reported on 16.3% of returns)
Here:
+$9,330
State:
+$31,684
(% of AGI for various income ranges: 5.3% for AGIs below $25k, 13.6% for AGIs $25k-50k, 58.6% for AGIs $50k-75k, 143.7% for AGIs $75k-100k, 411.5% for AGIs $100k-200k, 5740.0% for AGIs over 200k)
Profit/loss from business: +$10,771 (reported on 10.9% of returns)
Here:
+$10,771
State:
+$12,175
(% of AGI for various income ranges: 86.5% for AGIs below $25k, 76.3% for AGIs $25k-50k, 111.4% for AGIs $50k-75k, 169.3% for AGIs $75k-100k, 504.6% for AGIs $100k-200k)
Taxable individual retirement arrangement distribution: $22,381 (reported on 13.5% of returns)
60096:
$22,381
Illinois:
$21,613
(% of AGI for various income ranges: 61.2% for AGIs below $25k, 143.1% for AGIs $25k-50k, 338.6% for AGIs $50k-75k, 543.0% for AGIs $75k-100k, 987.8% for AGIs $100k-200k, 4412.0% for AGIs over 200k)
Total itemized deductions: $27,671 (reported on 9.7% of returns)
Here:
$27,671
State:
$34,948
(% of AGI for various income ranges: 89.4% for AGIs below $25k, 199.4% for AGIs $25k-50k, 298.8% for AGIs $50k-75k, 457.0% for AGIs $75k-100k, 781.5% for AGIs $100k-200k, 3542.0% for AGIs over 200k)
Charity contributions: $9,350 (reported on 7.4% of returns)
Here:
$9,350
State:
$13,122
(% of AGI for various income ranges: 22.7% for AGIs $25k-50k, 49.5% for AGIs $50k-75k, 65.6% for AGIs $75k-100k, 237.1% for AGIs $100k-200k, 1844.0% for AGIs over 200k)
Taxes paid: $8,797 (reported on 9.7% of returns)
60096:
$8,797
State:
$8,563
(% of AGI for various income ranges: 22.2% for AGIs below $25k, 56.1% for AGIs $25k-50k, 116.9% for AGIs $50k-75k, 176.7% for AGIs $75k-100k, 263.4% for AGIs $100k-200k, 832.0% for AGIs over 200k)
Earned income credit: $2,063 (reported on 11.7% of returns)
Here:
$2,063
State:
$2,311
(% of AGI for various income ranges: 74.0% for AGIs below $25k, 51.2% for AGIs $25k-50k)
Percentage of individuals using paid preparers for their 2020 taxes: 92.8%
Here:
93%
State:
93%
(% for various income ranges: 93.3% for AGIs below $25k, 93.8% for AGIs $25k-50k, 94.6% for AGIs $50k-75k, 92.7% for AGIs $75k-100k, 89.9% for AGIs $100k-200k, 92.3% for AGIs over 200k)
Averages for the 2012 tax year for zip code 60096, filed in 2013:
Average Adjusted Gross Income (AGI) in 2012: $61,267 (Individual Income Tax Returns)
Here:
$61,267
State:
$68,058
Salary/wage: $53,793 (reported on 83.2% of returns)
Here:
$53,793
State:
$55,396
(% of AGI for various income ranges: 70.3% for AGIs below $25k, 73.7% for AGIs $25k-50k, 72.9% for AGIs $50k-75k, 73.4% for AGIs $75k-100k, 76.3% for AGIs $100k-200k, 60.9% for AGIs over 200k)
Taxable interest for individuals: $1,325 (reported on 38.4% of returns)
This zip code:
$1,325
Illinois:
$1,969
(% of AGI for various income ranges: 1.3% for AGIs below $25k, 0.6% for AGIs $25k-50k, 0.4% for AGIs $50k-75k, 1.0% for AGIs $75k-100k, 0.3% for AGIs $100k-200k, 3.2% for AGIs over 200k)
Ordinary dividends: $3,839 (reported on 26.9% of returns)
Here:
$3,839
State:
$7,786
(% of AGI for various income ranges: 2.5% for AGIs below $25k, 1.7% for AGIs $25k-50k, 1.5% for AGIs $50k-75k, 1.9% for AGIs $75k-100k, 1.4% for AGIs $100k-200k, 2.3% for AGIs over 200k)
Net capital gain/loss in AGI: +$4,798 (reported on 15.9% of returns)
Here:
+$4,798
State:
+$22,183
(% of AGI for various income ranges: 0.6% for AGIs $75k-100k, 1.2% for AGIs $100k-200k, 7.0% for AGIs over 200k)
Profit/loss from business: +$8,295 (reported on 11.0% of returns)
Here:
+$8,295
State:
+$12,903
(% of AGI for various income ranges: 4.6% for AGIs below $25k, 2.2% for AGIs $25k-50k, 1.8% for AGIs $50k-75k, 1.3% for AGIs $75k-100k, 1.1% for AGIs $100k-200k)
Taxable individual retirement arrangement distribution: $17,833 (reported on 13.3% of returns)
60096:
$17,833
Illinois:
$17,929
(% of AGI for various income ranges: 4.3% for AGIs below $25k, 3.8% for AGIs $25k-50k, 4.7% for AGIs $50k-75k, 3.2% for AGIs $75k-100k, 4.7% for AGIs $100k-200k)
Total itemized deductions: $21,362 (23% of AGI, reported on 48.3% of returns)
Here:
$21,362
State:
$26,433
Here:
22.8% of AGI
State:
19.2% of AGI
(% of AGI for various income ranges: 16.8% for AGIs below $25k, 14.9% for AGIs $25k-50k, 18.0% for AGIs $50k-75k, 18.6% for AGIs $75k-100k, 17.1% for AGIs $100k-200k, 13.1% for AGIs over 200k)
Charity contributions: $3,046 (reported on 39.9% of returns)
Here:
$3,046
State:
$4,525
(% of AGI for various income ranges: 1.1% for AGIs below $25k, 1.3% for AGIs $25k-50k, 1.9% for AGIs $50k-75k, 2.1% for AGIs $75k-100k, 2.2% for AGIs $100k-200k, 2.7% for AGIs over 200k)
Taxes paid: $10,141 (reported on 48.0% of returns)
60096:
$10,141
State:
$11,968
(% of AGI for various income ranges: 5.3% for AGIs below $25k, 6.1% for AGIs $25k-50k, 7.9% for AGIs $50k-75k, 8.7% for AGIs $75k-100k, 8.7% for AGIs $100k-200k, 7.5% for AGIs over 200k)
Earned income credit: $1,818 (reported on 11.3% of returns)
Here:
$1,818
State:
$2,349
(% of AGI for various income ranges: 4.0% for AGIs below $25k, 0.8% for AGIs $25k-50k)
Percentage of individuals using paid preparers for their 2012 taxes: 53.5%
Here:
53%
State:
57%
(% for various income ranges: 46.8% for AGIs below $25k, 51.4% for AGIs $25k-50k, 55.6% for AGIs $50k-75k, 59.5% for AGIs $75k-100k, 59.7% for AGIs $100k-200k, 71.4% for AGIs over 200k)
Averages for the 2004 tax year for zip code 60096, filed in 2005:
Average Adjusted Gross Income (AGI) in 2004: $53,507 (Individual Income Tax Returns)
Here:
$53,507
State:
$54,625
Salary/wage: $48,319 (reported on 87.4% of returns)
Here:
$48,319
State:
$46,811
(% of AGI for various income ranges: 122.5% for AGIs below $10k, 72.1% for AGIs $10k-25k, 77.8% for AGIs $25k-50k, 80.9% for AGIs $50k-75k, 84.7% for AGIs $75k-100k, 74.4% for AGIs over 100k)
Taxable interest for individuals: $1,319 (reported on 54.2% of returns)
This zip code:
$1,319
Illinois:
$2,101
(% of AGI for various income ranges: 5.5% for AGIs below $10k, 2.9% for AGIs $10k-25k, 1.7% for AGIs $25k-50k, 0.9% for AGIs $50k-75k, 0.7% for AGIs $75k-100k, 1.4% for AGIs over 100k)
Taxable dividends: $2,486 (reported on 31.6% of returns)
Here:
$2,486
State:
$4,306
(% of AGI for various income ranges: 3.4% for AGIs below $10k, 2.6% for AGIs $10k-25k, 1.7% for AGIs $25k-50k, 1.2% for AGIs $50k-75k, 1.2% for AGIs $75k-100k, 1.5% for AGIs over 100k)
Net capital gain/loss: +$6,215 (reported on 21.4% of returns)
Here:
+$6,215
State:
+$17,321
(% of AGI for various income ranges: -1.8% for AGIs below $10k, -0.4% for AGIs $10k-25k, 0.8% for AGIs $25k-50k, 0.8% for AGIs $50k-75k, 0.9% for AGIs $75k-100k, 5.6% for AGIs over 100k)
Profit/loss from business: +$7,954 (reported on 11.5% of returns)
Here:
+$7,954
State:
+$11,771
(% of AGI for various income ranges: 2.3% for AGIs below $10k, 5.0% for AGIs $10k-25k, 1.8% for AGIs $25k-50k, 1.3% for AGIs $50k-75k, 1.1% for AGIs $75k-100k, 1.8% for AGIs over 100k)
IRA payment deduction: $3,338 (reported on 2.0% of returns)
60096:
$3,338
Illinois:
$3,087
Total itemized deductions: $17,392 (22% of AGI, reported on 50.7% of returns)
Here:
$17,392
State:
$20,239
Here:
21.6% of AGI
State:
19.5% of AGI
(% of AGI for various income ranges: 17.2% for AGIs below $10k, 16.4% for AGIs $10k-25k, 15.8% for AGIs $25k-50k, 18.5% for AGIs $50k-75k, 17.8% for AGIs $75k-100k, 14.9% for AGIs over 100k)
Charity contributions deductions: $2,801 (3% of AGI, reported on 44.9% of returns)
Here:
$2,801
State:
$3,719
Here:
3.4% of AGI
State:
3.4% of AGI
(% of AGI for various income ranges: 0.9% for AGIs below $10k, 1.4% for AGIs $10k-25k, 1.6% for AGIs $25k-50k, 2.1% for AGIs $50k-75k, 2.1% for AGIs $75k-100k, 3.2% for AGIs over 100k)
Total tax: $7,114 (reported on 81.2% of returns)
60096:
$7,114
State:
$9,882
(% of AGI for various income ranges: 3.0% for AGIs below $10k, 4.0% for AGIs $10k-25k, 6.7% for AGIs $25k-50k, 8.4% for AGIs $50k-75k, 9.8% for AGIs $75k-100k, 15.6% for AGIs over 100k)
Earned income credit: $1,502 (reported on 8.6% of returns)
Here:
$1,502
State:
$1,788
Percentage of individuals using paid preparers for their 2004 taxes: 56.2%
Here:
56%
State:
61%
(% for various income ranges: 39.8% for AGIs below $10k, 52.8% for AGIs $10k-25k, 60.3% for AGIs $25k-50k, 59.9% for AGIs $50k-75k, 63.0% for AGIs $75k-100k, 63.5% for AGIs over 100k)
Likely homosexual households (counted as self-reported same-sex unmarried-partner households)
Lesbian couples: 0.0% of all households
Gay men: 0.3% of all households
Household received Food Stamps/SNAP in the past 12 months: 224 Household did not receive Food Stamps/SNAP in the past 12 months: 2,526
Women who had a birth in the past 12 months: 52 (32 now married, 19 unmarried) Women who did not have a birth in the past 12 months: 1,182 (595 now married, 582 unmarried)
Housing units in zip code 60096 with a mortgage: 1,453 (186 second mortgage, 187 both second mortgage and home equity loan) Houses without a mortgage: 55
Median monthly owner costs for units with a mortgage: $1,937 Median monthly owner costs for units without a mortgage: $950
Residents with income below the poverty level in 2022:
This zip code:
4.4%
Whole state:
11.9%
Residents with income below 50% of the poverty level in 2022:
This zip code:
2.9%
Whole state:
5.7%
Median number of rooms in houses and condos:
Here:
6.9
State:
6.4
Median number of rooms in apartments:
Here:
4.1
State:
4.1
Notable locations in this zip code not listed on our city pages
Notable locations in zip code 60096: North Point Marina (A), Winthrop Harbor Village Hall (B), Winthrop Harbor Fire Department (C). Display/hide their locations on the map
In group quarters: 17 (-1 institutionalized population)
Size of family households: 1,053 2-persons, 467 3-persons, 262 4-persons, 102 5-persons, 41 6-persons, 37 7-or-more-persons
Size of nonfamily households: 705 1-person, 98 2-persons
625 married couples with children.
177 single-parent households (104 men, 73 women).
91.0% of residents of 60096 zip code speak English at home.
5.4% of residents speak Spanish at home (80% very well, 20% well).
2.9% of residents speak other Indo-European language at home (75% very well, 18% well, 7% not well).
0.1% of residents speak Asian or Pacific Island language at home (100% very well).
0.2% of residents speak other language at home (100% very well).
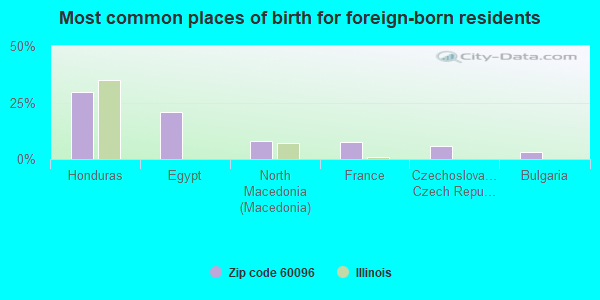
Foreign born population: 387 (5.9%) (85.3% of them are naturalized citizens)
This zip code:
5.9%
Whole state:
14.4%
30%Honduras
21%Egypt
8%North Macedonia (Macedonia)
8%France
6%Czechoslovakia (includes Czech Republic and Slovakia)
3%Bulgaria
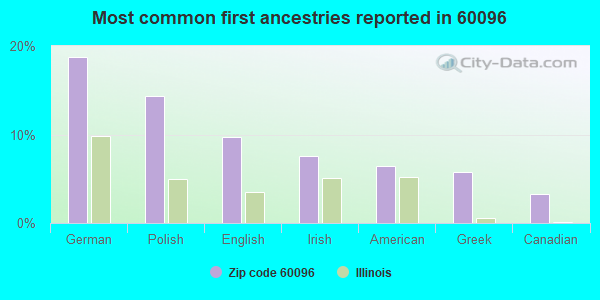
19%German
14%Polish
10%English
8%Irish
6%American
6%Greek
3%Canadian
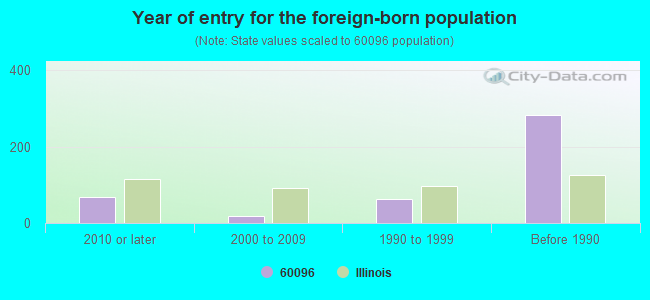
Year of entry for the foreign-born population
692010 or later
192000 to 2009
621990 to 1999
283Before 1990
Facilities with environmental interests located in this zip code:
LAFARGE NORTH AMERICA (9TH ST AND GREEN BAY RD in WINTHROP HARBOR, IL)
STATE MASTER (Illinois EPA Project) - SOLID WASTE PROGRAM, AIR PROGRAM AIR MINOR (AIRS/AFS) CRITERIA AND HAZARDOUS AIR POLLUTANT INVENTORY (Inventory of air pollution sources) Business SIC classification: REFUSE SYSTEMS Alternative names: MINERAL SOLUTIONS INC.
MARATHON GAS (901 SHERIDAN RD in WINTHROP HARBOR, IL)
STATE MASTER (Illinois EPA Project) - SOLID WASTE PROGRAM Conditionally Exempt Small Quantity Generators, less than 100 kg/month of hazardous waste (Resource Conservation and Recovery Act (tracking hazardous waste)) - notification
CHENEYS TIRE & AUTO (1101 SHERIDAN RD in WINTHROP HARBOR, IL)
STATE MASTER (Illinois EPA Project) - HAZARDOUS WASTE PROGRAM Small Quantity Generators, between 100 kg and 1000 kg of hazardous waste/month (Resource Conservation and Recovery Act (tracking hazardous waste)) - notification
NORTH PRAIRIE JR HIGH (500 NORTH AVE in WINTHROP HARBOR, IL)
(National Center for Education Statistics) - STATE ID-3404900101003 Organizations: WINTHROP HARBOR SCHOOL DIST 1 (SCHOOL DISTRICT)
HARRIS AMC JEEP RENAULT (221 SHERIDAN RD in WINTHROP HARBOR, IL)
(Resource Conservation and Recovery Act (tracking hazardous waste)) Organizations: TROCK JOHN (CONTACT/OWNER)
545 RUSSELL AVE SITE (545 RUSSELL AVE in WINTHROP HARBOR, IL)
SUPERFUND (Superfund database)
Housing units lacking complete plumbing facilities: 0.7% Housing units lacking complete kitchen facilities: 0.7%
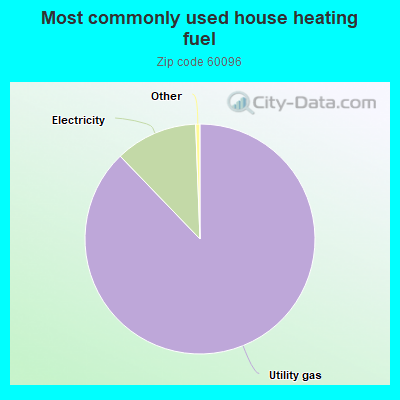
87.8%Utility gas
11.6%Electricity
Population in 1990: 7,433.
Place of birth for U.S.-born residents:
This state: 4,432
Northeast: 127
Midwest: 1,023
South: 387
West: 144
55% of the 60096 zip code residents lived in the same house 5 years ago. Out of people who lived in different houses, 73% lived in this county. Out of people who lived in different counties, 50% lived in Illinois.
94% of the 60096 zip code residents lived in the same house 1 year ago. Out of people who lived in different houses, 50% moved from this county. Out of people who lived in different houses, 37% moved from different county within same state. Out of people who lived in different houses, 15% moved from different state.
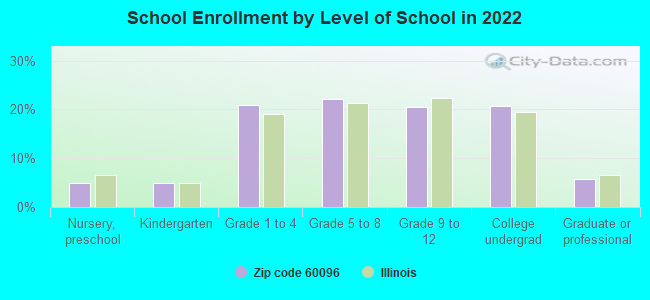
Private vs. public school enrollment:
Students in private schools in grades 1 to 8 (elementary and middle school): 55
Here:
11.1%
Illinois:
13.3%
Students in private schools in grades 9 to 12 (high school): 14
Here:
6.2%
Illinois:
9.9%
Students in private undergraduate colleges: 88
Here:
37.2%
Illinois:
27.4%
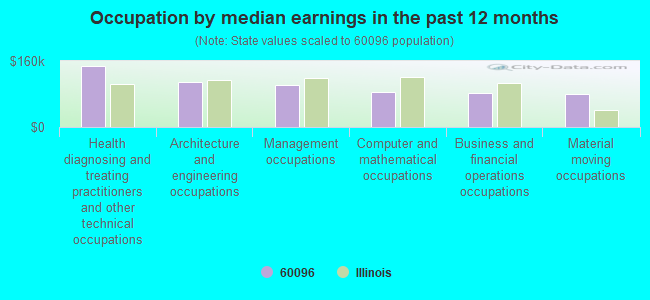
Occupation by median earnings in the past 12 months ($)
148,587Health diagnosing and treating practitioners and other technical occupations
108,382Architecture and engineering occupations
102,863Management occupations
85,707Computer and mathematical occupations
81,551Business and financial operations occupations
80,137Material moving occupations
Companies with federal contracts located in this zip code:
JERALD J ARCHER (265 OLD DARBY LANE in WINTHROP HARBO, IL; small business) : $138,530 in 3 contractsfrom 2000 to 2002
$81,014 with Navy for Dentistry Services. Signed on 2002-10-01. Completion date: 2003-09-30.
$57,516, same as above.Signed on 2000-02-16. Completion date: 2000-09-30.
$0, same as above.Signed on 2002-10-01. Completion date: 2003-09-30.
GREAT LAKES OFFICIALS ASSOCIAT (2500 6TH AVE in WINTHROP HARBO, IL; small business) : $73,795 in 2 contractsfrom 1999 to 2000
$37,010 with Navy for Recreational Services. Signed on 1999-11-26. Completion date: 1999-11-30.
$36,785 with Navy for Athletic and Sporting Equipment. Signed on 2000-10-01. Completion date: 2000-10-01.
Top industries in this zip code by the number of employees in 2005:
Detailed PMIC statistics for the following Tracts:8601.03
, 8601.04
2002 - 2018 National Fire Incident Reporting System (NFIRS) incidents
According to the data from the years 2002 - 2018 the average number of fires per year is 31. The highest number of reported fires - 56 took place in 2003, and the least - 10 in 2015. The data has a decreasing trend.
When looking into fire subcategories, the most incidents belonged to: Structure Fires (49.6%), and Outside Fires (36.3%).
Fire incident types reported to NFIRS in Zip Code 60096
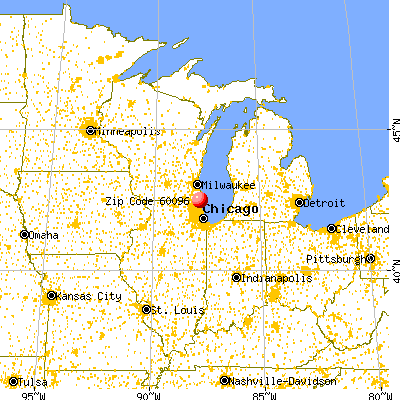


 Nearest zip codes: 60099, 53158, 60087, 53143, 60083, 60085.


 According to the data from the years 2002 - 2018 the average number of fires per year is 31. The highest number of reported fires - 56 took place in 2003, and the least - 10 in 2015. The data has a decreasing trend.
 When looking into fire subcategories, the most incidents belonged to: Structure Fires (49.6%), and Outside Fires (36.3%).