Estimated zip code population in 2022: 11,491 Zip code population in 2010: 10,663 Zip code population in 2000: 12,065
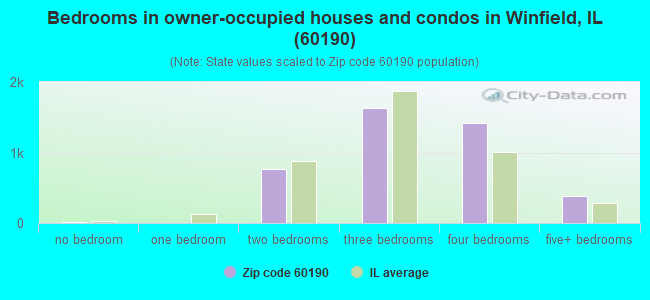
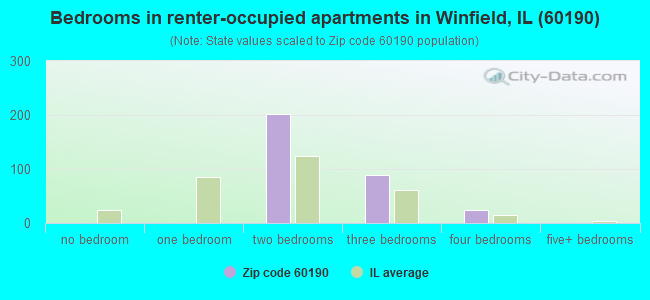
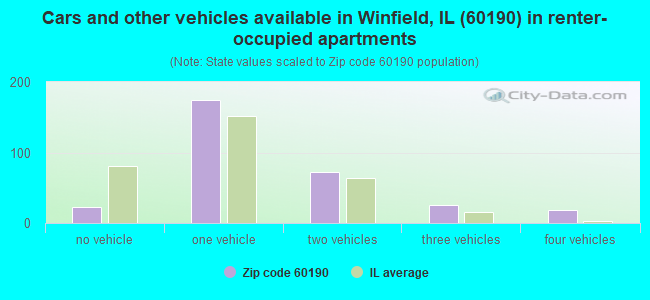
Houses and condos: 4,570 Renter-occupied apartments: 320
% of renters here:
7%
State:
33%
March 2022 cost of living index in zip code 60190: 100.4 (near average, U.S. average is 100)
Land area: 4.6 sq. mi. Water area: 0.1 sq. mi.
Population density: 2,474 people per square mile
(low).
OSM Map
General Map
Google Map
MSN Map
OSM Map
General Map
Google Map
MSN Map
OSM Map
General Map
Google Map
MSN Map
OSM Map
General Map
Google Map
MSN Map
Please wait while loading the map...
Real estate property taxes paid for housing units in 2022:
This zip code:
2.1% ($7,671)
Illinois:
2.0% ($4,912)
Median real estate property taxes paid for housing units with mortgages in 2022: $7,641 (2.1%) Median real estate property taxes paid for housing units with no mortgage in 2022: $7,638 (2.0%)
Business Search- 14 Million verified businesses
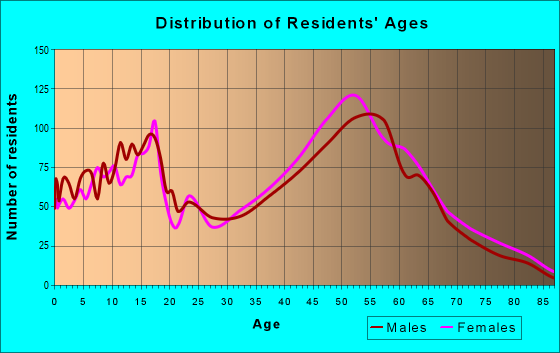
Males: 5,890
(51.3%)
Females: 5,601
(48.7%)
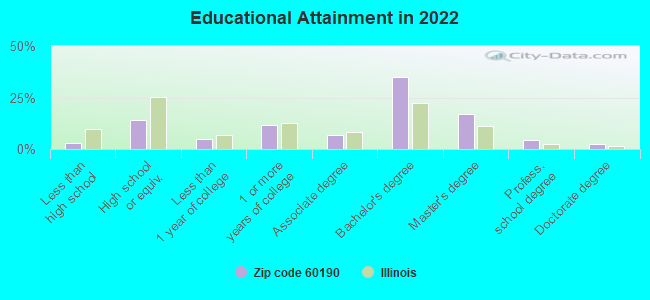
For population 25 years and over in 60190:
High school or higher: 98.3%
Bachelor's degree or higher: 59.9%
Graduate or professional degree: 24.4%
Unemployed: 4.0%
Mean travel time to work (commute): 27.9 minutes
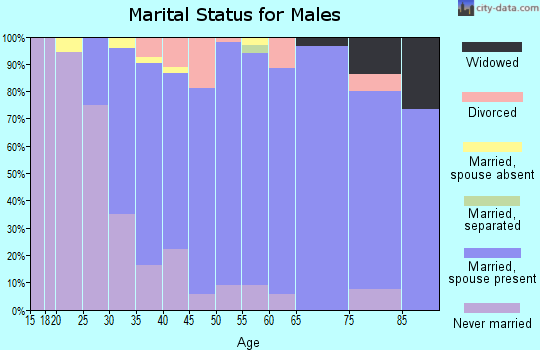
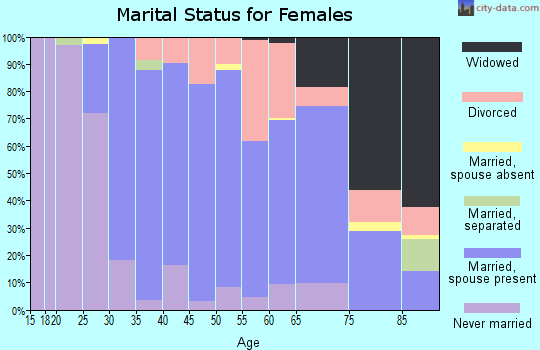
For population 15 years and over in 60190:
Never married: 25.1%
Now married: 62.2%
Separated: 0.7%
Widowed: 3.9%
Divorced: 8.2%
Zip code 60190 compared to state average:
Median household income above state average.
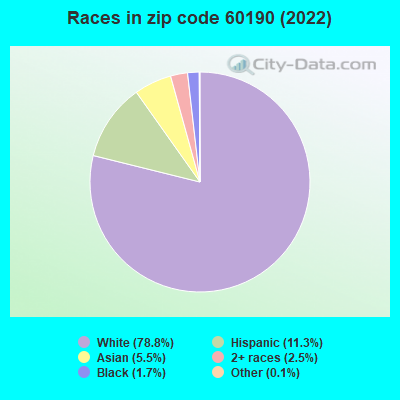
Black race population percentage significantly below state average.
Median age above state average.
Foreign-born population percentage below state average.
Renting percentage significantly below state average.
Length of stay since moving in significantly above state average.
Number of rooms per house above state average.
House age below state average.
Percentage of population with a bachelor's degree or higher above state average.
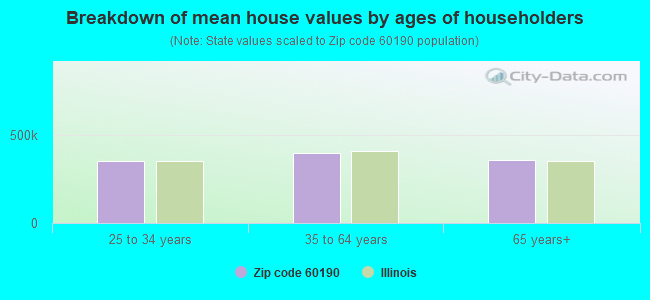
Estimated median house/condo value in 2022: $372,823
60190:
$372,823
Illinois:
$251,600
According to our research of Illinois and other state lists, there were 7 registered sex offenders living in 60190 zip code as of May 17, 2024. The ratio of all residents to sex offenders in zip code 60190 is 1,597 to 1. The ratio of registered sex offenders to all residents in this zip code is lower than the state average.
Median resident age:
This zip code:
46.5 years
Illinois median age:
39.1 years
Average household size:
This zip code:
2.5 people
Illinois:
2.4 people
Averages for the 2020 tax year for zip code 60190, filed in 2021:
Average Adjusted Gross Income (AGI) in 2020: $110,456 (Individual Income Tax Returns)
Here:
$110,456
State:
$82,626
Salary/wage: $95,462 (reported on 81.2% of returns)
Here:
$95,462
State:
$66,640
(% of AGI for various income ranges: 1087.0% for AGIs below $25k, 3406.4% for AGIs $25k-50k, 6283.4% for AGIs $50k-75k, 9045.6% for AGIs $75k-100k, 18359.8% for AGIs $100k-200k, 67254.8% for AGIs over 200k)
Taxable interest for individuals: $1,751 (reported on 45.1% of returns)
This zip code:
$1,751
Illinois:
$2,376
(% of AGI for various income ranges: 28.1% for AGIs below $25k, 39.7% for AGIs $25k-50k, 57.2% for AGIs $50k-75k, 77.6% for AGIs $75k-100k, 162.8% for AGIs $100k-200k, 733.4% for AGIs over 200k)
Ordinary dividends: $6,754 (reported on 39.4% of returns)
Here:
$6,754
State:
$9,061
(% of AGI for various income ranges: 62.5% for AGIs below $25k, 118.5% for AGIs $25k-50k, 203.8% for AGIs $50k-75k, 284.4% for AGIs $75k-100k, 440.9% for AGIs $100k-200k, 2861.4% for AGIs over 200k)
Net capital gain/loss in AGI: +$12,164 (reported on 34.9% of returns)
Here:
+$12,164
State:
+$31,684
(% of AGI for various income ranges: 20.7% for AGIs below $25k, 64.0% for AGIs $25k-50k, 124.7% for AGIs $50k-75k, 214.7% for AGIs $75k-100k, 581.2% for AGIs $100k-200k, 6211.0% for AGIs over 200k)
Profit/loss from business: +$18,706 (reported on 15.1% of returns)
Here:
+$18,706
State:
+$12,175
(% of AGI for various income ranges: 99.5% for AGIs below $25k, 223.0% for AGIs $25k-50k, 160.9% for AGIs $50k-75k, 312.9% for AGIs $75k-100k, 578.0% for AGIs $100k-200k, 2480.3% for AGIs over 200k)
Taxable individual retirement arrangement distribution: $31,930 (reported on 14.6% of returns)
60190:
$31,930
Illinois:
$21,613
(% of AGI for various income ranges: 96.9% for AGIs below $25k, 196.1% for AGIs $25k-50k, 442.4% for AGIs $50k-75k, 612.4% for AGIs $75k-100k, 1081.3% for AGIs $100k-200k, 3803.4% for AGIs over 200k)
Self-employed (Keogh) retirement plans: $29,700 (reported on 1.2% of returns)
60190:
$29,700
Illinois:
$30,962
(% of AGI for various income ranges: 46.5% for AGIs $100k-200k, 579.0% for AGIs over 200k)
Total itemized deductions: $31,171 (reported on 18.6% of returns)
Here:
$31,171
State:
$34,948
(% of AGI for various income ranges: 185.2% for AGIs below $25k, 226.7% for AGIs $25k-50k, 521.9% for AGIs $50k-75k, 849.6% for AGIs $75k-100k, 1289.0% for AGIs $100k-200k, 4686.2% for AGIs over 200k)
Charity contributions: $10,415 (reported on 15.9% of returns)
Here:
$10,415
State:
$13,122
(% of AGI for various income ranges: 8.1% for AGIs below $25k, 32.1% for AGIs $25k-50k, 64.8% for AGIs $50k-75k, 140.0% for AGIs $75k-100k, 349.9% for AGIs $100k-200k, 1929.7% for AGIs over 200k)
Taxes paid: $9,109 (reported on 18.6% of returns)
60190:
$9,109
State:
$8,563
(% of AGI for various income ranges: 31.4% for AGIs below $25k, 79.9% for AGIs $25k-50k, 194.8% for AGIs $50k-75k, 324.9% for AGIs $75k-100k, 421.3% for AGIs $100k-200k, 1067.9% for AGIs over 200k)
Earned income credit: $1,706 (reported on 5.4% of returns)
Here:
$1,706
State:
$2,311
(% of AGI for various income ranges: 31.8% for AGIs below $25k, 41.6% for AGIs $25k-50k)
Percentage of individuals using paid preparers for their 2020 taxes: 92.4%
Here:
92%
State:
93%
(% for various income ranges: 89.2% for AGIs below $25k, 90.9% for AGIs $25k-50k, 93.8% for AGIs $50k-75k, 92.6% for AGIs $75k-100k, 94.0% for AGIs $100k-200k, 94.9% for AGIs over 200k)
Averages for the 2012 tax year for zip code 60190, filed in 2013:
Average Adjusted Gross Income (AGI) in 2012: $92,915 (Individual Income Tax Returns)
Here:
$92,915
State:
$68,058
Salary/wage: $79,281 (reported on 85.0% of returns)
Here:
$79,281
State:
$55,396
(% of AGI for various income ranges: 73.9% for AGIs below $25k, 72.8% for AGIs $25k-50k, 74.9% for AGIs $50k-75k, 73.3% for AGIs $75k-100k, 78.3% for AGIs $100k-200k, 66.5% for AGIs over 200k)
Taxable interest for individuals: $1,428 (reported on 49.0% of returns)
This zip code:
$1,428
Illinois:
$1,969
(% of AGI for various income ranges: 1.8% for AGIs below $25k, 0.9% for AGIs $25k-50k, 0.7% for AGIs $50k-75k, 0.7% for AGIs $75k-100k, 0.6% for AGIs $100k-200k, 0.8% for AGIs over 200k)
Ordinary dividends: $5,876 (reported on 38.9% of returns)
Here:
$5,876
State:
$7,786
(% of AGI for various income ranges: 4.1% for AGIs below $25k, 2.5% for AGIs $25k-50k, 1.9% for AGIs $50k-75k, 2.4% for AGIs $75k-100k, 1.7% for AGIs $100k-200k, 3.2% for AGIs over 200k)
Net capital gain/loss in AGI: +$8,329 (reported on 29.6% of returns)
Here:
+$8,329
State:
+$22,183
(% of AGI for various income ranges: 0.4% for AGIs below $25k, 0.6% for AGIs $75k-100k, 0.7% for AGIs $100k-200k, 6.2% for AGIs over 200k)
Profit/loss from business: +$21,499 (reported on 14.8% of returns)
Here:
+$21,499
State:
+$12,903
(% of AGI for various income ranges: 4.9% for AGIs below $25k, 5.5% for AGIs $25k-50k, 2.7% for AGIs $50k-75k, 1.7% for AGIs $75k-100k, 2.6% for AGIs $100k-200k, 4.3% for AGIs over 200k)
Taxable individual retirement arrangement distribution: $23,148 (reported on 14.3% of returns)
60190:
$23,148
Illinois:
$17,929
(% of AGI for various income ranges: 5.1% for AGIs below $25k, 5.7% for AGIs $25k-50k, 3.9% for AGIs $50k-75k, 5.3% for AGIs $75k-100k, 3.2% for AGIs $100k-200k, 2.8% for AGIs over 200k)
Self-employment retirement plans: $19,471 (reported on 1.2% of returns)
60190:
$19,471
Illinois:
$24,666
Total itemized deductions: $27,610 (20% of AGI, reported on 59.1% of returns)
Here:
$27,610
State:
$26,433
Here:
20.2% of AGI
State:
19.2% of AGI
(% of AGI for various income ranges: 20.3% for AGIs below $25k, 20.4% for AGIs $25k-50k, 21.4% for AGIs $50k-75k, 20.3% for AGIs $75k-100k, 19.3% for AGIs $100k-200k, 13.6% for AGIs over 200k)
Charity contributions: $4,331 (reported on 52.1% of returns)
Here:
$4,331
State:
$4,525
(% of AGI for various income ranges: 1.5% for AGIs below $25k, 2.0% for AGIs $25k-50k, 2.2% for AGIs $50k-75k, 2.3% for AGIs $75k-100k, 2.6% for AGIs $100k-200k, 2.5% for AGIs over 200k)
Taxes paid: $13,356 (reported on 59.1% of returns)
60190:
$13,356
State:
$11,968
(% of AGI for various income ranges: 7.3% for AGIs below $25k, 7.8% for AGIs $25k-50k, 9.2% for AGIs $50k-75k, 9.1% for AGIs $75k-100k, 9.4% for AGIs $100k-200k, 7.6% for AGIs over 200k)
Earned income credit: $1,753 (reported on 5.6% of returns)
Here:
$1,753
State:
$2,349
(% of AGI for various income ranges: 2.6% for AGIs below $25k, 0.5% for AGIs $25k-50k)
Percentage of individuals using paid preparers for their 2012 taxes: 51.0%
Here:
51%
State:
57%
(% for various income ranges: 44.4% for AGIs below $25k, 50.0% for AGIs $25k-50k, 53.9% for AGIs $50k-75k, 51.5% for AGIs $75k-100k, 51.9% for AGIs $100k-200k, 66.7% for AGIs over 200k)
Averages for the 2004 tax year for zip code 60190, filed in 2005:
Average Adjusted Gross Income (AGI) in 2004: $83,734 (Individual Income Tax Returns)
Here:
$83,734
State:
$54,625
Salary/wage: $71,347 (reported on 85.5% of returns)
Here:
$71,347
State:
$46,811
(% of AGI for various income ranges: 133.7% for AGIs below $10k, 69.1% for AGIs $10k-25k, 75.9% for AGIs $25k-50k, 77.7% for AGIs $50k-75k, 82.0% for AGIs $75k-100k, 69.6% for AGIs over 100k)
Taxable interest for individuals: $1,825 (reported on 66.6% of returns)
This zip code:
$1,825
Illinois:
$2,101
(% of AGI for various income ranges: 8.5% for AGIs below $10k, 3.8% for AGIs $10k-25k, 1.7% for AGIs $25k-50k, 1.3% for AGIs $50k-75k, 1.1% for AGIs $75k-100k, 1.4% for AGIs over 100k)
Taxable dividends: $3,650 (reported on 46.1% of returns)
Here:
$3,650
State:
$4,306
(% of AGI for various income ranges: 9.6% for AGIs below $10k, 2.4% for AGIs $10k-25k, 2.0% for AGIs $25k-50k, 2.2% for AGIs $50k-75k, 1.5% for AGIs $75k-100k, 2.0% for AGIs over 100k)
Net capital gain/loss: +$9,837 (reported on 37.1% of returns)
Here:
+$9,837
State:
+$17,321
(% of AGI for various income ranges: -6.6% for AGIs below $10k, 0.9% for AGIs $10k-25k, -0.1% for AGIs $25k-50k, 1.2% for AGIs $50k-75k, 0.8% for AGIs $75k-100k, 6.2% for AGIs over 100k)
Profit/loss from business: +$18,647 (reported on 14.0% of returns)
Here:
+$18,647
State:
+$11,771
(% of AGI for various income ranges: 7.0% for AGIs below $10k, 5.4% for AGIs $10k-25k, 3.6% for AGIs $25k-50k, 3.4% for AGIs $50k-75k, 2.0% for AGIs $75k-100k, 3.1% for AGIs over 100k)
IRA payment deduction: $3,188 (reported on 3.9% of returns)
60190:
$3,188
Illinois:
$3,087
(% of AGI for various income ranges: 0.4% for AGIs $10k-25k, 0.3% for AGIs $25k-50k, 0.3% for AGIs $50k-75k, 0.2% for AGIs $75k-100k, 0.1% for AGIs over 100k)
Self-employed pension: $15,097 (reported on 1.7% of returns)
Here:
$15,097
Illinois:
$16,965
Total itemized deductions: $22,678 (19% of AGI, reported on 60.9% of returns)
Here:
$22,678
State:
$20,239
Here:
18.7% of AGI
State:
19.5% of AGI
(% of AGI for various income ranges: 23.2% for AGIs below $10k, 24.1% for AGIs $10k-25k, 22.7% for AGIs $25k-50k, 23.5% for AGIs $50k-75k, 21.4% for AGIs $75k-100k, 13.4% for AGIs over 100k)
Charity contributions deductions: $4,268 (3% of AGI, reported on 56.9% of returns)
Here:
$4,268
State:
$3,719
Here:
3.4% of AGI
State:
3.4% of AGI
(% of AGI for various income ranges: 1.4% for AGIs below $10k, 2.8% for AGIs $10k-25k, 2.3% for AGIs $25k-50k, 3.3% for AGIs $50k-75k, 3.2% for AGIs $75k-100k, 2.9% for AGIs over 100k)
Total tax: $15,572 (reported on 81.3% of returns)
60190:
$15,572
State:
$9,882
(% of AGI for various income ranges: 3.0% for AGIs below $10k, 4.6% for AGIs $10k-25k, 7.4% for AGIs $25k-50k, 8.6% for AGIs $50k-75k, 9.4% for AGIs $75k-100k, 18.6% for AGIs over 100k)
Earned income credit: $1,333 (reported on 3.6% of returns)
Here:
$1,333
State:
$1,788
Percentage of individuals using paid preparers for their 2004 taxes: 51.4%
Here:
51%
State:
61%
(% for various income ranges: 38.6% for AGIs below $10k, 48.8% for AGIs $10k-25k, 52.0% for AGIs $25k-50k, 58.5% for AGIs $50k-75k, 51.1% for AGIs $75k-100k, 57.8% for AGIs over 100k)
Likely homosexual households (counted as self-reported same-sex unmarried-partner households)
Lesbian couples: 0.2% of all households
Gay men: 0.0% of all households
Household received Food Stamps/SNAP in the past 12 months: 167 Household did not receive Food Stamps/SNAP in the past 12 months: 4,282
Women who had a birth in the past 12 months: 80 (73 now married, 6 unmarried) Women who did not have a birth in the past 12 months: 2,102 (1,090 now married, 1,002 unmarried)
Housing units in zip code 60190 with a mortgage: 2,704 (316 second mortgage, 296 both second mortgage and home equity loan) Houses without a mortgage: 97
Median monthly owner costs for units with a mortgage: $2,247 Median monthly owner costs for units without a mortgage: $1,034
Residents with income below the poverty level in 2022:
This zip code:
1.9%
Whole state:
11.9%
Residents with income below 50% of the poverty level in 2022:
This zip code:
1.3%
Whole state:
5.7%
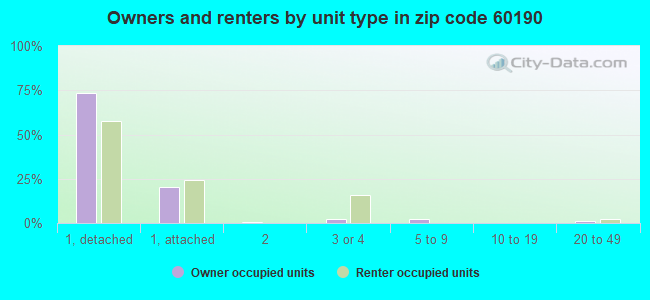
Median number of rooms in houses and condos:
Here:
7.2
State:
6.4
Median number of rooms in apartments:
Here:
5.1
State:
4.1
Notable locations in this zip code not listed on our city pages
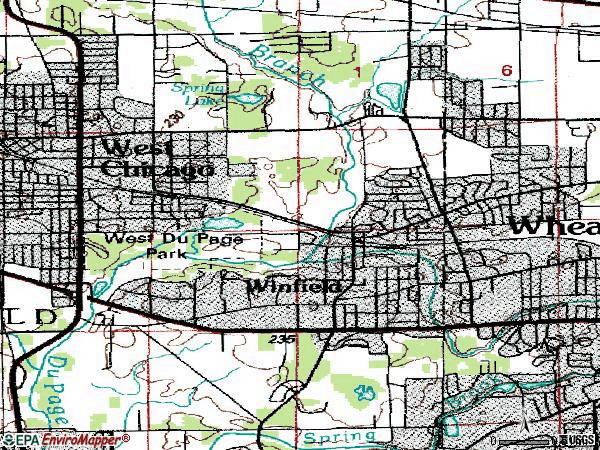
Notable locations in zip code 60190: Winfield Fire Protection District Station 2 (A), Winfield Fire Protection District Station 1 (B). Display/hide their locations on the map
Churches in zip code 60190 include: Christ Our Savior Lutheran Church (A), Saint John the Baptist Catholic Church (B), Winfield Community United Methodist Church (C), Faith Church (D). Display/hide their locations on the map
Parks in zip code 60190 include: Timber Ridge Park (1), Chartwell Park (2), Westfield Estates Park (3), Prairie Trail Park (4), Old Pond Park (5), Knolls Park (6), Founders Park (7). Display/hide their locations on the map
In group quarters: 143 (-1 institutionalized population)
Size of family households: 1,498 2-persons, 574 3-persons, 829 4-persons, 212 5-persons, 129 6-persons, 19 7-or-more-persons
Size of nonfamily households: 1,114 1-person, 104 2-persons, 11 4-persons
2,163 married couples with children.
142 single-parent households (50 men, 92 women).
84.2% of residents of 60190 zip code speak English at home.
7.9% of residents speak Spanish at home (74% very well, 19% well, 7% not well).
4.7% of residents speak other Indo-European language at home (78% very well, 13% well, 9% not well).
2.3% of residents speak Asian or Pacific Island language at home (59% very well, 26% well, 15% not well).
0.9% of residents speak other language at home (80% very well, 16% well, 4% not well).
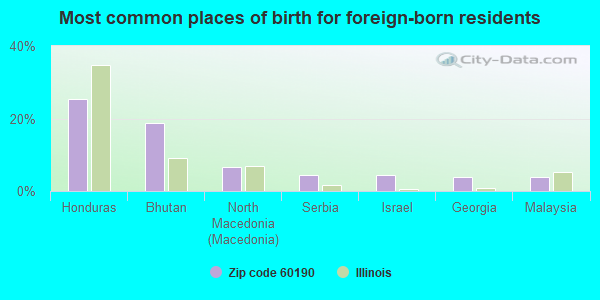
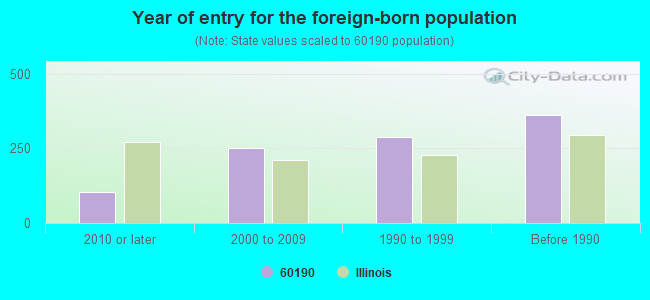
Foreign born population: 952 (8.3%) (84.8% of them are naturalized citizens)
Facilities with environmental interests located in this zip code:
AMOCO OIL CO (5030 WINFIELD RD in WINFIELD, IL)
STATE MASTER (Illinois EPA Project) - SOLID WASTE PROGRAM, AIR PROGRAM AIR MINOR (AIRS/AFS) Business SIC classification: PETROLEUM BULK STATIONS AND TERMINALS Alternative names: BP AMOCO CORPORATION
PLEASANT HILL ELEM SCHOOL (220 PLEASANT HILL in WINFIELD, IL)
(National Center for Education Statistics) - STATE ID-1902220002010 Organizations: COMMUNITY UNIT SCHOOL DIST 200 (SCHOOL DISTRICT)
ALPHA CLEANERS (27 W 119TH GENEVA RD in WINFIELD, IL)
Conditionally Exempt Small Quantity Generators, less than 100 kg/month of hazardous waste (Resource Conservation and Recovery Act (tracking hazardous waste)) - notification Organizations: BANG DOO PYE (CONTACT/OWNER)
AMOCO 18902 (27 W 572 ROOSEVELT AND WINFIEL in WINFIELD, IL)
Small Quantity Generators, between 100 kg and 1000 kg of hazardous waste/month (Resource Conservation and Recovery Act (tracking hazardous waste)) - notification Organizations: AMOCO OIL CO (CONTACT/OWNER)
Housing units lacking complete plumbing facilities: 0.2% Housing units lacking complete kitchen facilities: 0.2%
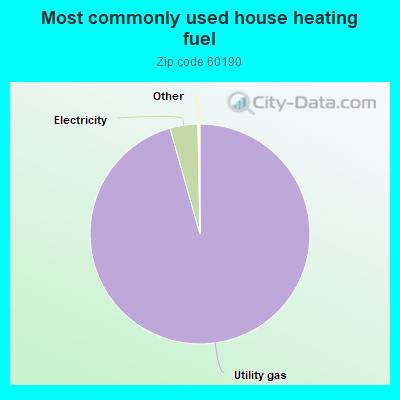
95.6%Utility gas
4.1%Electricity
Population in 1990: 9,255. Population change in the 1990s: +2,810 (+30.4%).
Place of birth for U.S.-born residents:
This state: 7,949
Northeast: 633
Midwest: 1,081
South: 520
West: 255
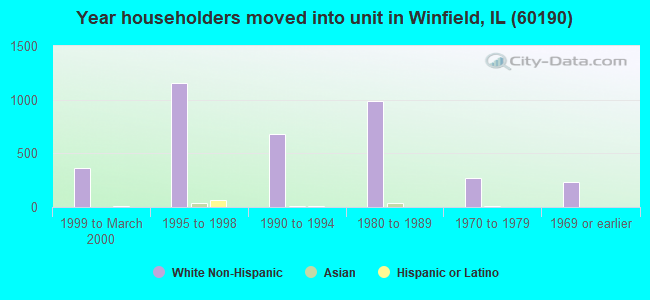
60% of the 60190 zip code residents lived in the same house 5 years ago. Out of people who lived in different houses, 58% lived in this county. Out of people who lived in different counties, 50% lived in Illinois.
94% of the 60190 zip code residents lived in the same house 1 year ago. Out of people who lived in different houses, 64% moved from this county. Out of people who lived in different houses, 21% moved from different county within same state. Out of people who lived in different houses, 14% moved from different state.
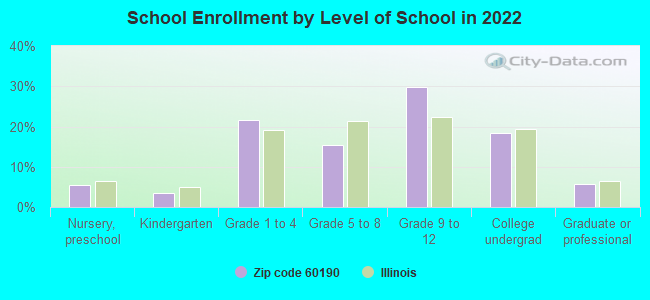
Private vs. public school enrollment:
Students in private schools in grades 1 to 8 (elementary and middle school): 194
Here:
19.4%
Illinois:
13.3%
Students in private schools in grades 9 to 12 (high school): 206
Here:
25.7%
Illinois:
9.9%
Students in private undergraduate colleges: 95
Here:
19.6%
Illinois:
27.4%
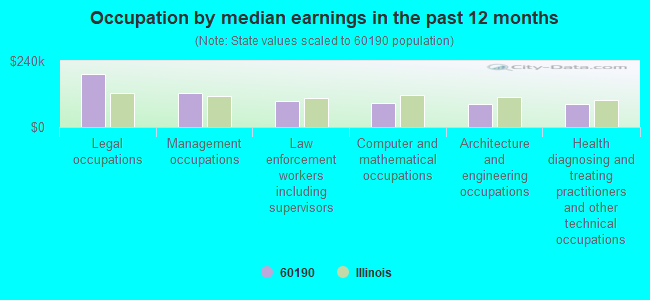
Occupation by median earnings in the past 12 months ($)
191,936Legal occupations
123,596Management occupations
93,073Law enforcement workers including supervisors
86,888Computer and mathematical occupations
84,828Architecture and engineering occupations
83,504Health diagnosing and treating practitioners and other technical occupations
Top industries in this zip code by the number of employees in 2005:
Health Care and Social Assistance: General Medical and Surgical Hospitals (over 1000 employees: 1 establishment)
Health Care and Social Assistance: Offices of Physicians (except Mental Health Specialists) (250-499: 1, 20-49: 3, 10-19: 2, 5-9: 8, 1-4: 5)
Management of Companies and Enterprises: Corporate, Subsidiary, and Regional Managing Offices (100-249: 1)
2002 - 2018 National Fire Incident Reporting System (NFIRS) incidents
According to the data from the years 2002 - 2018 the average number of fires per year is 36. The highest number of fires - 59 took place in 2012, and the least - 11 in 2004. The data has an increasing trend.
When looking into fire subcategories, the most reports belonged to: Structure Fires (57.8%), and Outside Fires (26.5%).
Fire incident types reported to NFIRS in Zip Code 60190
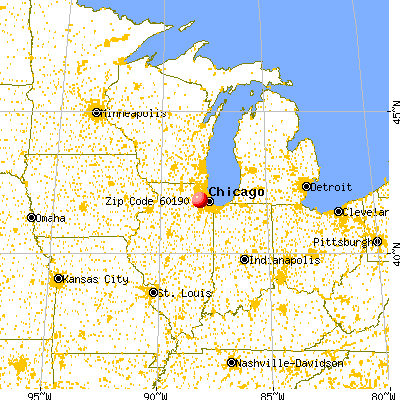


 Nearest zip codes: 60187, 60189, 60188, 60555, 60185, 60139.
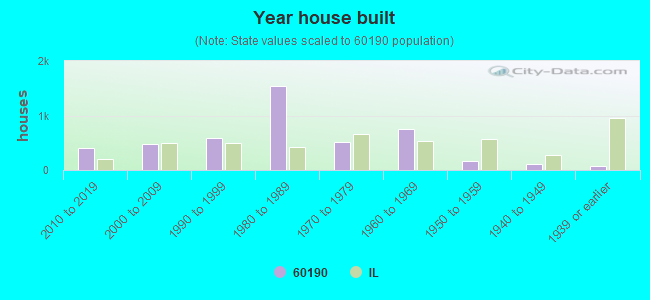


 According to the data from the years 2002 - 2018 the average number of fires per year is 36. The highest number of fires - 59 took place in 2012, and the least - 11 in 2004. The data has an increasing trend.
 When looking into fire subcategories, the most reports belonged to: Structure Fires (57.8%), and Outside Fires (26.5%).