Estimated zip code population in 2022: 4,477 Zip code population in 2010: 4,523 Zip code population in 2000: 4,691
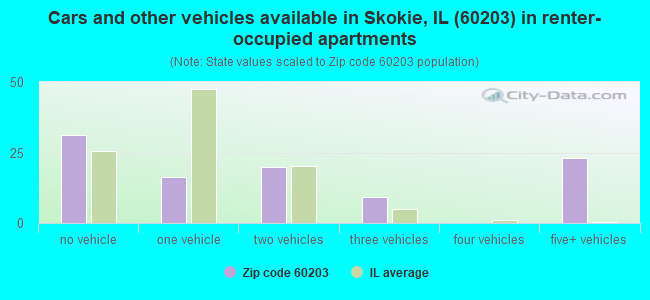
Houses and condos: 1,727 Renter-occupied apartments: 103
% of renters here:
6%
State:
33%
March 2022 cost of living index in zip code 60203: 102.3 (near average, U.S. average is 100)
Land area: 0.7 sq. mi. Water area: 0.0 sq. mi.
Population density: 6,568 people per square mile
(high).
OSM Map
General Map
Google Map
MSN Map
OSM Map
General Map
Google Map
MSN Map
OSM Map
General Map
Google Map
MSN Map
OSM Map
General Map
Google Map
MSN Map
Please wait while loading the map...
Real estate property taxes paid for housing units in 2022:
This zip code:
1.9% ($9,176)
Illinois:
2.0% ($4,912)
Median real estate property taxes paid for housing units with mortgages in 2022: $8,975 (1.8%) Median real estate property taxes paid for housing units with no mortgage in 2022: $9,565 (2.0%)
Business Search- 14 Million verified businesses
Males: 2,226
(49.7%)
Females: 2,250
(50.3%)
For population 25 years and over in 60203:
High school or higher: 96.4%
Bachelor's degree or higher: 78.7%
Graduate or professional degree: 45.8%
Unemployed: 1.0%
Mean travel time to work (commute): 26.7 minutes
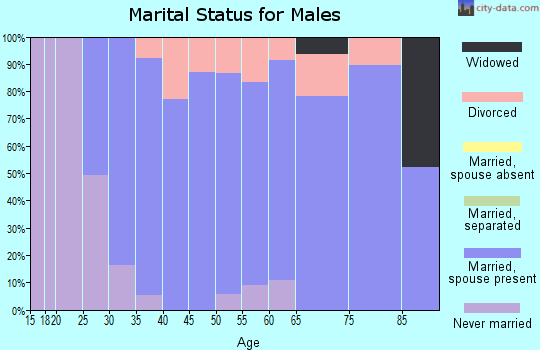
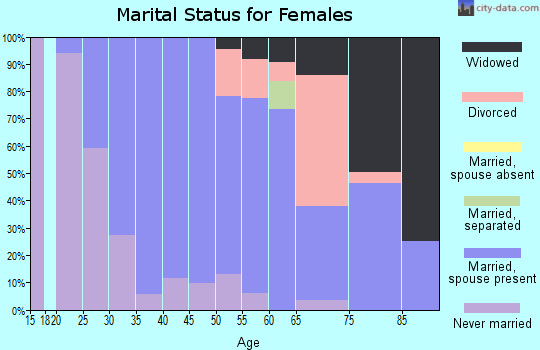
For population 15 years and over in 60203:
Never married: 26.4%
Now married: 60.1%
Separated: 1.5%
Widowed: 5.5%
Divorced: 6.5%
Zip code 60203 compared to state average:
Median household income above state average.
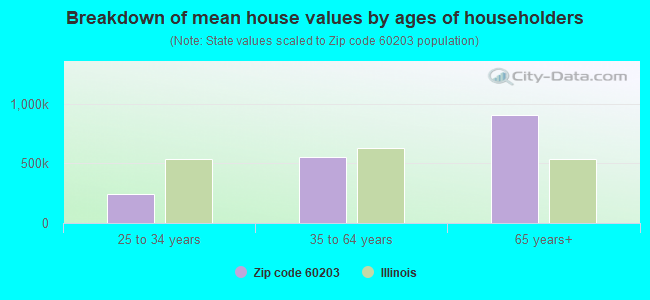
Median house value above state average.
Unemployed percentage significantly below state average.
Hispanic race population percentage below state average.
Median age above state average.
Renting percentage significantly below state average.
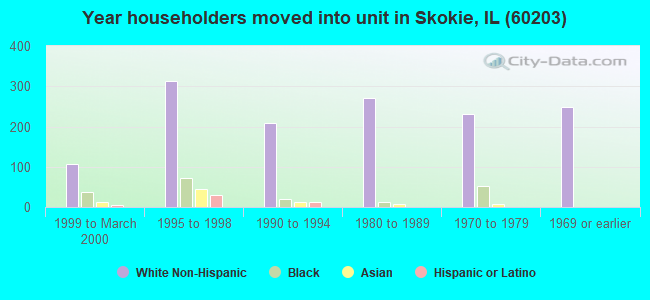
Length of stay since moving in above state average.
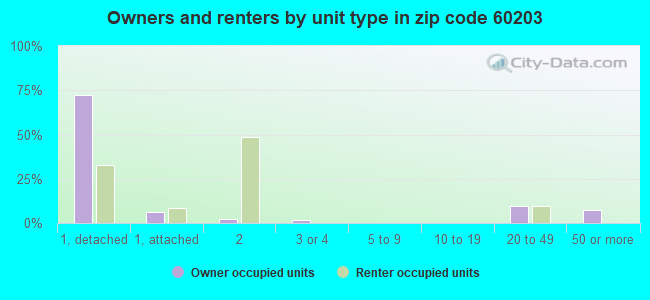
Number of rooms per house above state average.
Percentage of population with a bachelor's degree or higher above state average.
Estimated median house/condo value in 2022: $492,467
60203:
$492,467
Illinois:
$251,600
Median resident age:
This zip code:
43.7 years
Illinois median age:
39.1 years
Average household size:
This zip code:
2.6 people
Illinois:
2.4 people
Averages for the 2020 tax year for zip code 60203, filed in 2021:
Average Adjusted Gross Income (AGI) in 2020: $160,293 (Individual Income Tax Returns)
Here:
$160,293
State:
$82,626
Salary/wage: $117,983 (reported on 76.7% of returns)
Here:
$117,983
State:
$66,640
(% of AGI for various income ranges: 1057.0% for AGIs below $25k, 3248.4% for AGIs $25k-50k, 6370.0% for AGIs $50k-75k, 8721.7% for AGIs $75k-100k, 18617.1% for AGIs $100k-200k, 73348.1% for AGIs over 200k)
Taxable interest for individuals: $3,213 (reported on 50.2% of returns)
This zip code:
$3,213
Illinois:
$2,376
(% of AGI for various income ranges: 49.0% for AGIs below $25k, 90.5% for AGIs $25k-50k, 85.0% for AGIs $50k-75k, 119.2% for AGIs $75k-100k, 285.0% for AGIs $100k-200k, 1346.9% for AGIs over 200k)
Ordinary dividends: $12,325 (reported on 50.2% of returns)
Here:
$12,325
State:
$9,061
(% of AGI for various income ranges: 166.7% for AGIs below $25k, 187.9% for AGIs $25k-50k, 319.3% for AGIs $50k-75k, 668.3% for AGIs $75k-100k, 1048.2% for AGIs $100k-200k, 5322.5% for AGIs over 200k)
Net capital gain/loss in AGI: +$39,652 (reported on 44.3% of returns)
Here:
+$39,652
State:
+$31,684
(% of AGI for various income ranges: 58.0% for AGIs below $25k, 225.3% for AGIs $25k-50k, 180.7% for AGIs $50k-75k, 431.7% for AGIs $75k-100k, 1044.3% for AGIs $100k-200k, 21353.1% for AGIs over 200k)
Profit/loss from business: +$25,389 (reported on 24.2% of returns)
Here:
+$25,389
State:
+$12,175
(% of AGI for various income ranges: 172.7% for AGIs below $25k, 278.9% for AGIs $25k-50k, 417.1% for AGIs $50k-75k, 496.7% for AGIs $75k-100k, 809.6% for AGIs $100k-200k, 5600.6% for AGIs over 200k)
Taxable individual retirement arrangement distribution: $37,341 (reported on 15.5% of returns)
60203:
$37,341
Illinois:
$21,613
(% of AGI for various income ranges: 109.7% for AGIs below $25k, 171.1% for AGIs $25k-50k, 467.9% for AGIs $50k-75k, 606.7% for AGIs $75k-100k, 1171.4% for AGIs $100k-200k, 4611.9% for AGIs over 200k)
Self-employed (Keogh) retirement plans: $30,288 (reported on 3.7% of returns)
60203:
$30,288
Illinois:
$30,962
(% of AGI for various income ranges: 280.8% for AGIs $75k-100k, 1303.8% for AGIs over 200k)
Total itemized deductions: $38,022 (reported on 26.9% of returns)
Here:
$38,022
State:
$34,948
(% of AGI for various income ranges: 274.7% for AGIs below $25k, 257.4% for AGIs $25k-50k, 801.4% for AGIs $50k-75k, 1272.5% for AGIs $75k-100k, 1915.0% for AGIs $100k-200k, 8193.1% for AGIs over 200k)
Charity contributions: $15,506 (reported on 23.3% of returns)
Here:
$15,506
State:
$13,122
(% of AGI for various income ranges: 42.0% for AGIs below $25k, 119.3% for AGIs $50k-75k, 224.2% for AGIs $75k-100k, 362.5% for AGIs $100k-200k, 3956.9% for AGIs over 200k)
Taxes paid: $9,027 (reported on 26.9% of returns)
60203:
$9,027
State:
$8,563
(% of AGI for various income ranges: 56.0% for AGIs below $25k, 82.1% for AGIs $25k-50k, 250.0% for AGIs $50k-75k, 379.2% for AGIs $75k-100k, 582.9% for AGIs $100k-200k, 1603.1% for AGIs over 200k)
Earned income credit: $2,354 (reported on 5.9% of returns)
Here:
$2,354
State:
$2,311
(% of AGI for various income ranges: 74.0% for AGIs below $25k, 44.2% for AGIs $25k-50k)
Percentage of individuals using paid preparers for their 2020 taxes: 92.7%
Here:
93%
State:
93%
(% for various income ranges: 88.2% for AGIs below $25k, 92.3% for AGIs $25k-50k, 95.5% for AGIs $50k-75k, 94.7% for AGIs $75k-100k, 94.5% for AGIs $100k-200k, 93.5% for AGIs over 200k)
Averages for the 2012 tax year for zip code 60203, filed in 2013:
Average Adjusted Gross Income (AGI) in 2012: $123,299 (Individual Income Tax Returns)
Here:
$123,299
State:
$68,058
Salary/wage: $95,469 (reported on 75.8% of returns)
Here:
$95,469
State:
$55,396
(% of AGI for various income ranges: 63.5% for AGIs below $25k, 70.5% for AGIs $25k-50k, 57.9% for AGIs $50k-75k, 64.8% for AGIs $75k-100k, 66.0% for AGIs $100k-200k, 53.7% for AGIs over 200k)
Taxable interest for individuals: $2,727 (reported on 54.0% of returns)
This zip code:
$2,727
Illinois:
$1,969
(% of AGI for various income ranges: 3.3% for AGIs below $25k, 1.7% for AGIs $25k-50k, 1.1% for AGIs $50k-75k, 0.9% for AGIs $75k-100k, 1.1% for AGIs $100k-200k, 1.2% for AGIs over 200k)
Ordinary dividends: $9,681 (reported on 50.2% of returns)
Here:
$9,681
State:
$7,786
(% of AGI for various income ranges: 7.8% for AGIs below $25k, 4.2% for AGIs $25k-50k, 4.9% for AGIs $50k-75k, 3.6% for AGIs $75k-100k, 3.5% for AGIs $100k-200k, 3.9% for AGIs over 200k)
Net capital gain/loss in AGI: +$10,884 (reported on 42.3% of returns)
Here:
+$10,884
State:
+$22,183
(% of AGI for various income ranges: 1.6% for AGIs below $25k, 0.9% for AGIs $75k-100k, 1.5% for AGIs $100k-200k, 5.9% for AGIs over 200k)
Profit/loss from business: +$28,031 (reported on 24.2% of returns)
Here:
+$28,031
State:
+$12,903
(% of AGI for various income ranges: 12.4% for AGIs below $25k, 7.5% for AGIs $25k-50k, 6.4% for AGIs $50k-75k, 4.2% for AGIs $75k-100k, 6.3% for AGIs $100k-200k, 4.8% for AGIs over 200k)
Taxable individual retirement arrangement distribution: $22,641 (reported on 18.1% of returns)
60203:
$22,641
Illinois:
$17,929
(% of AGI for various income ranges: 6.0% for AGIs below $25k, 4.9% for AGIs $25k-50k, 6.8% for AGIs $50k-75k, 4.9% for AGIs $75k-100k, 4.9% for AGIs $100k-200k, 1.9% for AGIs over 200k)
Self-employment retirement plans: $26,300 (reported on 4.2% of returns)
60203:
$26,300
Illinois:
$24,666
Total itemized deductions: $33,599 (18% of AGI, reported on 59.1% of returns)
Here:
$33,599
State:
$26,433
Here:
17.9% of AGI
State:
19.2% of AGI
(% of AGI for various income ranges: 24.0% for AGIs below $25k, 22.8% for AGIs $25k-50k, 22.9% for AGIs $50k-75k, 20.0% for AGIs $75k-100k, 19.3% for AGIs $100k-200k, 12.7% for AGIs over 200k)
Charity contributions: $5,979 (reported on 52.6% of returns)
Here:
$5,979
State:
$4,525
(% of AGI for various income ranges: 1.6% for AGIs below $25k, 2.1% for AGIs $25k-50k, 2.7% for AGIs $50k-75k, 2.4% for AGIs $75k-100k, 2.7% for AGIs $100k-200k, 2.6% for AGIs over 200k)
Taxes paid: $16,147 (reported on 59.1% of returns)
60203:
$16,147
State:
$11,968
(% of AGI for various income ranges: 7.4% for AGIs below $25k, 8.5% for AGIs $25k-50k, 9.0% for AGIs $50k-75k, 8.8% for AGIs $75k-100k, 9.0% for AGIs $100k-200k, 6.9% for AGIs over 200k)
Earned income credit: $2,006 (reported on 7.4% of returns)
Here:
$2,006
State:
$2,349
(% of AGI for various income ranges: 4.1% for AGIs below $25k, 0.8% for AGIs $25k-50k)
Percentage of individuals using paid preparers for their 2012 taxes: 62.8%
Here:
63%
State:
57%
(% for various income ranges: 59.7% for AGIs below $25k, 57.1% for AGIs $25k-50k, 62.5% for AGIs $50k-75k, 55.0% for AGIs $75k-100k, 66.7% for AGIs $100k-200k, 72.7% for AGIs over 200k)
Averages for the 2004 tax year for zip code 60203, filed in 2005:
Average Adjusted Gross Income (AGI) in 2004: $102,136 (Individual Income Tax Returns)
Here:
$102,136
State:
$54,625
Salary/wage: $80,907 (reported on 75.5% of returns)
Here:
$80,907
State:
$46,811
(% of AGI for various income ranges: 108.2% for AGIs below $10k, 55.5% for AGIs $10k-25k, 61.5% for AGIs $25k-50k, 68.9% for AGIs $50k-75k, 70.3% for AGIs $75k-100k, 57.4% for AGIs over 100k)
Taxable interest for individuals: $4,048 (reported on 72.4% of returns)
This zip code:
$4,048
Illinois:
$2,101
(% of AGI for various income ranges: 13.1% for AGIs below $10k, 8.3% for AGIs $10k-25k, 4.9% for AGIs $25k-50k, 3.0% for AGIs $50k-75k, 3.1% for AGIs $75k-100k, 2.5% for AGIs over 100k)
Taxable dividends: $6,016 (reported on 59.9% of returns)
Here:
$6,016
State:
$4,306
(% of AGI for various income ranges: 18.7% for AGIs below $10k, 7.6% for AGIs $10k-25k, 5.0% for AGIs $25k-50k, 3.7% for AGIs $50k-75k, 4.1% for AGIs $75k-100k, 3.1% for AGIs over 100k)
Net capital gain/loss: +$19,799 (reported on 49.6% of returns)
Here:
+$19,799
State:
+$17,321
(% of AGI for various income ranges: -11.6% for AGIs below $10k, 3.1% for AGIs $10k-25k, 1.7% for AGIs $25k-50k, 0.0% for AGIs $50k-75k, 1.6% for AGIs $75k-100k, 12.2% for AGIs over 100k)
Profit/loss from business: +$25,891 (reported on 22.2% of returns)
Here:
+$25,891
State:
+$11,771
(% of AGI for various income ranges: 3.1% for AGIs below $10k, 8.9% for AGIs $10k-25k, 10.2% for AGIs $25k-50k, 5.5% for AGIs $50k-75k, 5.3% for AGIs $75k-100k, 5.3% for AGIs over 100k)
IRA payment deduction: $3,261 (reported on 3.4% of returns)
60203:
$3,261
Illinois:
$3,087
(% of AGI for various income ranges: 0.7% for AGIs $25k-50k, 0.4% for AGIs $50k-75k, 0.1% for AGIs $75k-100k, 0.0% for AGIs over 100k)
Self-employed pension: $16,990 (reported on 5.2% of returns)
Here:
$16,990
Illinois:
$16,965
(% of AGI for various income ranges: 1.4% for AGIs $10k-25k, 0.9% for AGIs $50k-75k, 1.0% for AGIs over 100k)
Total itemized deductions: $27,656 (18% of AGI, reported on 61.9% of returns)
Here:
$27,656
State:
$20,239
Here:
18.5% of AGI
State:
19.5% of AGI
(% of AGI for various income ranges: 36.4% for AGIs below $10k, 35.5% for AGIs $10k-25k, 29.6% for AGIs $25k-50k, 27.2% for AGIs $50k-75k, 23.0% for AGIs $75k-100k, 13.6% for AGIs over 100k)
Charity contributions deductions: $5,683 (4% of AGI, reported on 58.6% of returns)
Here:
$5,683
State:
$3,719
Here:
3.7% of AGI
State:
3.4% of AGI
(% of AGI for various income ranges: 2.2% for AGIs below $10k, 2.9% for AGIs $10k-25k, 3.6% for AGIs $25k-50k, 3.6% for AGIs $50k-75k, 3.2% for AGIs $75k-100k, 3.2% for AGIs over 100k)
Total tax: $22,602 (reported on 81.1% of returns)
60203:
$22,602
State:
$9,882
(% of AGI for various income ranges: 4.5% for AGIs below $10k, 4.8% for AGIs $10k-25k, 7.7% for AGIs $25k-50k, 9.7% for AGIs $50k-75k, 10.3% for AGIs $75k-100k, 20.7% for AGIs over 100k)
Earned income credit: $1,307 (reported on 4.3% of returns)
Here:
$1,307
State:
$1,788
Percentage of individuals using paid preparers for their 2004 taxes: 62.2%
Here:
62%
State:
61%
(% for various income ranges: 59.7% for AGIs below $10k, 61.7% for AGIs $10k-25k, 59.4% for AGIs $25k-50k, 60.4% for AGIs $50k-75k, 56.8% for AGIs $75k-100k, 67.6% for AGIs over 100k)
Likely homosexual households (counted as self-reported same-sex unmarried-partner households)
Lesbian couples: 0.4% of all households
Gay men: 0.0% of all households
Household received Food Stamps/SNAP in the past 12 months: 34 Household did not receive Food Stamps/SNAP in the past 12 months: 1,629
Women who had a birth in the past 12 months: 22 (22 now married, 0 unmarried) Women who did not have a birth in the past 12 months: 878 (436 now married, 438 unmarried)
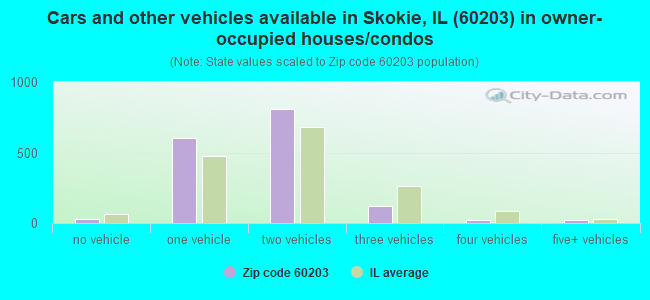
Housing units in zip code 60203 with a mortgage: 979 (153 second mortgage, 5 home equity loan, 108 both second mortgage and home equity loan) Houses without a mortgage: 22
Median monthly owner costs for units with a mortgage: $2,717 Median monthly owner costs for units without a mortgage: $1,259
Residents with income below the poverty level in 2022:
This zip code:
4.9%
Whole state:
11.9%
Residents with income below 50% of the poverty level in 2022:
This zip code:
0.6%
Whole state:
5.7%
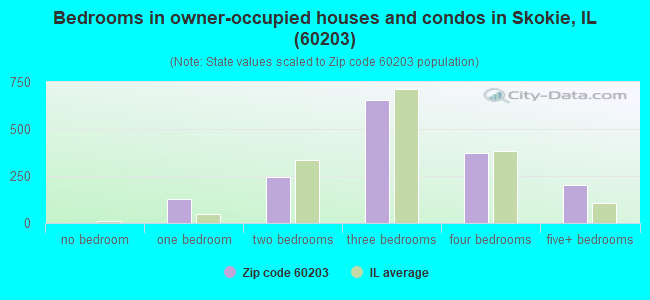
Median number of rooms in houses and condos:
Here:
7.1
State:
6.4
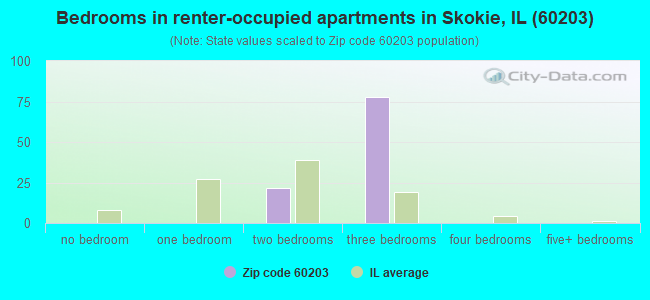
Median number of rooms in apartments:
Here:
5.8
State:
4.1
Notable locations in this zip code not listed on our city pages
Size of family households: 436 2-persons, 327 3-persons, 203 4-persons, 174 5-persons, 24 6-persons, 26 7-or-more-persons
Size of nonfamily households: 440 1-person, 10 2-persons, 32 4-persons
969 married couples with children.
164 single-parent households (17 men, 147 women).
77.6% of residents of 60203 zip code speak English at home.
9.3% of residents speak Spanish at home (78% very well, 5% well, 17% not well).
6.2% of residents speak other Indo-European language at home (68% very well, 23% well, 5% not well, 4% not at all).
2.9% of residents speak Asian or Pacific Island language at home (74% very well, 26% well).
4.4% of residents speak other language at home (89% very well, 11% well).
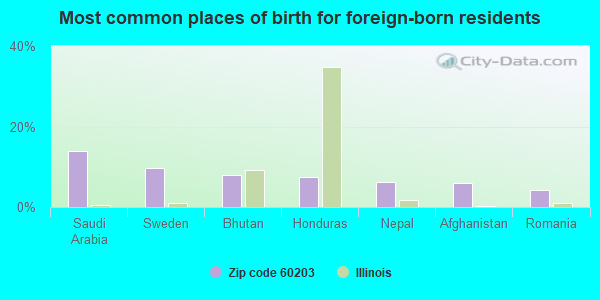
Foreign born population: 750 (16.8%) (79.9% of them are naturalized citizens)
Facilities with environmental interests located in this zip code:
AMOCO 8723 (9410 MCCORMICK AND GOLF in EVANSTON, IL)
Small Quantity Generators, between 100 kg and 1000 kg of hazardous waste/month (Resource Conservation and Recovery Act (tracking hazardous waste)) - notification Organizations: AMOCO OIL CO (CONTACT/OWNER)
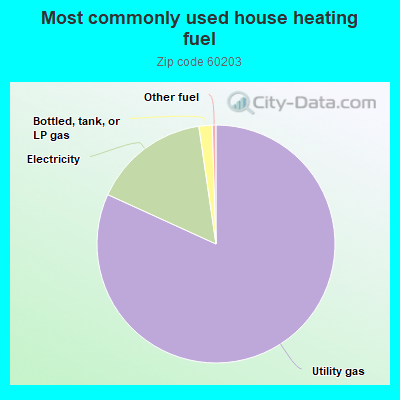
81.9%Utility gas
15.9%Electricity
1.8%Bottled, tank, or LP gas
0.5%Other fuel
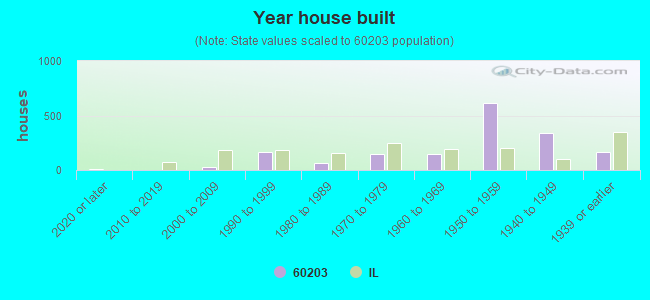
Population in 1990: 4,764.
Place of birth for U.S.-born residents:
This state: 2,546
Northeast: 248
Midwest: 587
South: 144
West: 165
69% of the 60203 zip code residents lived in the same house 5 years ago. Out of people who lived in different houses, 77% lived in this county. Out of people who lived in different counties, 50% lived in Illinois.
93% of the 60203 zip code residents lived in the same house 1 year ago. Out of people who lived in different houses, 65% moved from this county. Out of people who lived in different houses, 25% moved from different state. Out of people who lived in different houses, 9% moved from abroad.
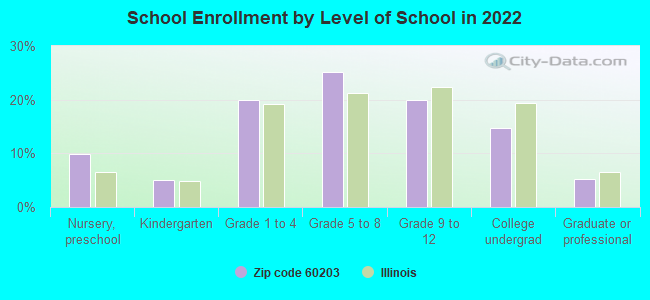
Private vs. public school enrollment:
Students in private schools in grades 1 to 8 (elementary and middle school): 220
Here:
38.7%
Illinois:
13.3%
Students in private schools in grades 9 to 12 (high school): 128
Here:
51.9%
Illinois:
9.9%
Students in private undergraduate colleges: 70
Here:
38.4%
Illinois:
27.4%
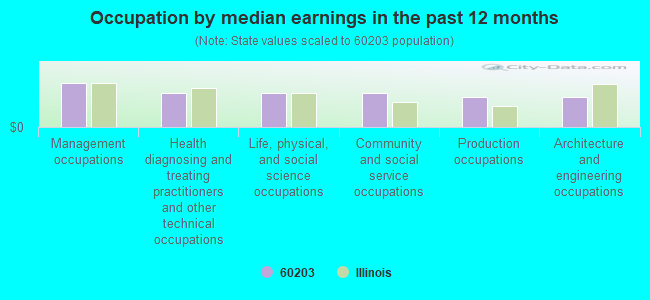
Occupation by median earnings in the past 12 months ($)
113,931Management occupations
89,404Health diagnosing and treating practitioners and other technical occupations
88,192Life, physical, and social science occupations
87,708Community and social service occupations
78,861Production occupations
77,603Architecture and engineering occupations
Top industries in this zip code by the number of employees in 2005:
Other Services (except Public Administration): Religious Organizations (20-49 employees: 1 establishment, 5-9 employees: 1 establishment)
Administrative and Support and Waste Management and Remediation Services: Exterminating and Pest Control Services (20-49: 1)
Health Care and Social Assistance: Child Day Care Services (20-49: 1)
Administrative and Support and Waste Management and Remediation Services: Remediation Services (20-49: 1)
Arts, Entertainment, and Recreation: Musical Groups and Artists (10-19: 1)
Finance and Insurance: Insurance Agencies and Brokerages (5-9: 1, 1-4: 1)
Professional, Scientific, and Technical Services: Administrative Management and General Management Consulting Services (1-4: 4)
Other Services (except Public Administration): Drycleaning and Laundry Services (except Coin-Operated) (5-9: 1)
Accommodation and Food Services: Full-Service Restaurants (5-9: 1)
Wholesale Trade: Industrial Machinery and Equipment Merchant Wholesalers (5-9: 1)
Home Mortgage Disclosure Act Aggregated Statistics For Year 2009 (Based on 4 partial tracts)
A) FHA, FSA/RHS & VA Home Purchase Loans
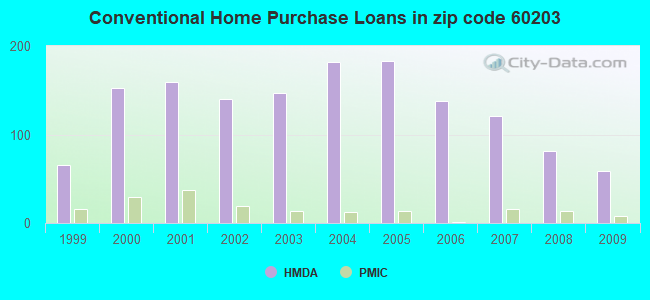
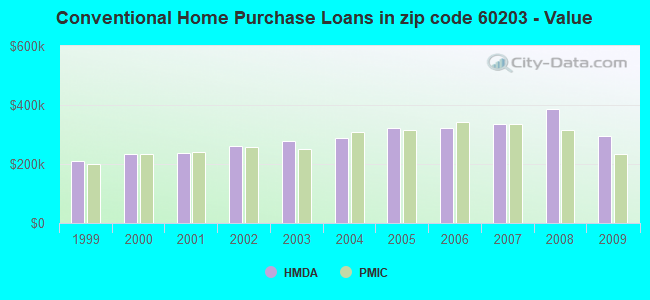
B) Conventional Home Purchase Loans
C) Refinancings
D) Home Improvement Loans
F) Non-occupant Loans on < 5 Family Dwellings (A B C & D)
Number
Average Value
Number
Average Value
Number
Average Value
Number
Average Value
Number
Average Value
LOANS ORIGINATED
16
$280,638
59
$295,589
321
$294,576
7
$227,753
9
$207,130
APPLICATIONS APPROVED, NOT ACCEPTED
1
$311,670
7
$304,339
37
$305,349
3
$97,313
1
$91,400
APPLICATIONS DENIED
4
$293,178
13
$353,389
89
$378,930
6
$11,735
2
$131,915
APPLICATIONS WITHDRAWN
0
$0
8
$240,719
24
$343,715
2
$144,410
1
$188,710
FILES CLOSED FOR INCOMPLETENESS
2
$279,875
6
$291,095
14
$420,134
1
$343,110
0
$0
Aggregated Statistics For Year 2008 (Based on 4 partial tracts)
A) FHA, FSA/RHS & VA Home Purchase Loans
B) Conventional Home Purchase Loans
C) Refinancings
D) Home Improvement Loans
F) Non-occupant Loans on < 5 Family Dwellings (A B C & D)
Number
Average Value
Number
Average Value
Number
Average Value
Number
Average Value
Number
Average Value
LOANS ORIGINATED
3
$324,590
81
$386,843
179
$329,266
14
$122,421
8
$335,942
APPLICATIONS APPROVED, NOT ACCEPTED
0
$0
8
$603,898
30
$328,196
3
$144,023
3
$350,707
APPLICATIONS DENIED
6
$277,615
13
$415,752
51
$370,944
3
$104,807
9
$349,618
APPLICATIONS WITHDRAWN
1
$294,310
9
$279,049
25
$280,022
1
$477,910
3
$255,007
FILES CLOSED FOR INCOMPLETENESS
0
$0
2
$252,885
6
$436,157
1
$373,750
0
$0
Aggregated Statistics For Year 2007 (Based on 4 partial tracts)
B) Conventional Home Purchase Loans
C) Refinancings
D) Home Improvement Loans
E) Loans on Dwellings For 5+ Families
F) Non-occupant Loans on < 5 Family Dwellings (A B C & D)
Number
Average Value
Number
Average Value
Number
Average Value
Number
Average Value
Number
Average Value
LOANS ORIGINATED
121
$334,037
218
$338,792
18
$125,346
1
$1,225,400
18
$296,278
APPLICATIONS APPROVED, NOT ACCEPTED
14
$338,289
31
$386,563
5
$147,400
0
$0
2
$349,240
APPLICATIONS DENIED
23
$228,124
76
$300,328
14
$97,394
0
$0
8
$300,568
APPLICATIONS WITHDRAWN
10
$324,492
39
$372,311
1
$82,260
0
$0
0
$0
FILES CLOSED FOR INCOMPLETENESS
5
$481,098
9
$459,272
0
$0
0
$0
0
$0
Aggregated Statistics For Year 2006 (Based on 4 partial tracts)
B) Conventional Home Purchase Loans
C) Refinancings
D) Home Improvement Loans
F) Non-occupant Loans on < 5 Family Dwellings (A B C & D)
Number
Average Value
Number
Average Value
Number
Average Value
Number
Average Value
LOANS ORIGINATED
138
$320,888
228
$322,379
24
$201,201
19
$351,139
APPLICATIONS APPROVED, NOT ACCEPTED
16
$291,280
23
$351,660
1
$45,700
4
$228,230
APPLICATIONS DENIED
28
$346,772
69
$348,341
13
$165,968
2
$418,475
APPLICATIONS WITHDRAWN
16
$290,006
44
$317,978
1
$342,750
1
$257,330
FILES CLOSED FOR INCOMPLETENESS
3
$287,793
13
$324,158
1
$550,230
0
$0
Aggregated Statistics For Year 2005 (Based on 4 partial tracts)
B) Conventional Home Purchase Loans
C) Refinancings
D) Home Improvement Loans
F) Non-occupant Loans on < 5 Family Dwellings (A B C & D)
Number
Average Value
Number
Average Value
Number
Average Value
Number
Average Value
LOANS ORIGINATED
183
$321,936
257
$294,491
26
$227,489
23
$372,495
APPLICATIONS APPROVED, NOT ACCEPTED
16
$281,589
28
$235,008
4
$81,575
1
$245,080
APPLICATIONS DENIED
24
$323,263
79
$287,303
16
$52,500
5
$263,714
APPLICATIONS WITHDRAWN
12
$333,823
48
$311,072
5
$207,278
5
$401,044
FILES CLOSED FOR INCOMPLETENESS
8
$325,070
20
$313,576
3
$239,163
2
$267,135
Aggregated Statistics For Year 2004 (Based on 4 partial tracts)
A) FHA, FSA/RHS & VA Home Purchase Loans
B) Conventional Home Purchase Loans
C) Refinancings
D) Home Improvement Loans
F) Non-occupant Loans on < 5 Family Dwellings (A B C & D)
G) Loans On Manufactured Home Dwelling (A B C & D)
Number
Average Value
Number
Average Value
Number
Average Value
Number
Average Value
Number
Average Value
Number
Average Value
LOANS ORIGINATED
1
$201,080
182
$289,058
328
$286,986
21
$146,520
24
$305,727
0
$0
APPLICATIONS APPROVED, NOT ACCEPTED
0
$0
25
$290,048
32
$288,413
5
$50,214
5
$279,240
0
$0
APPLICATIONS DENIED
0
$0
19
$241,435
58
$272,196
11
$170,264
2
$317,880
1
$18,280
APPLICATIONS WITHDRAWN
0
$0
17
$284,048
49
$249,671
5
$225,228
0
$0
0
$0
FILES CLOSED FOR INCOMPLETENESS
0
$0
4
$367,785
27
$297,895
1
$45,700
0
$0
0
$0
Aggregated Statistics For Year 2003 (Based on 4 partial tracts)
B) Conventional Home Purchase Loans
C) Refinancings
D) Home Improvement Loans
E) Loans on Dwellings For 5+ Families
F) Non-occupant Loans on < 5 Family Dwellings (A B C & D)
Number
Average Value
Number
Average Value
Number
Average Value
Number
Average Value
Number
Average Value
LOANS ORIGINATED
147
$276,468
958
$232,482
16
$132,384
1
$551,430
18
$242,531
APPLICATIONS APPROVED, NOT ACCEPTED
11
$273,435
74
$212,212
0
$0
0
$0
2
$179,145
APPLICATIONS DENIED
17
$232,402
145
$237,427
7
$62,194
0
$0
3
$200,127
APPLICATIONS WITHDRAWN
11
$213,365
67
$279,065
2
$100,945
0
$0
0
$0
FILES CLOSED FOR INCOMPLETENESS
3
$520,817
29
$296,933
4
$81,182
0
$0
0
$0
Aggregated Statistics For Year 2002 (Based on 4 partial tracts)
B) Conventional Home Purchase Loans
C) Refinancings
D) Home Improvement Loans
F) Non-occupant Loans on < 5 Family Dwellings (A B C & D)
Number
Average Value
Number
Average Value
Number
Average Value
Number
Average Value
LOANS ORIGINATED
140
$259,909
652
$226,336
19
$129,121
11
$216,390
APPLICATIONS APPROVED, NOT ACCEPTED
18
$197,946
58
$222,368
6
$66,403
0
$0
APPLICATIONS DENIED
14
$255,535
64
$204,930
10
$43,344
4
$232,715
APPLICATIONS WITHDRAWN
9
$271,337
41
$240,385
2
$3,200
0
$0
FILES CLOSED FOR INCOMPLETENESS
0
$0
36
$214,342
2
$68,550
1
$288,820
Aggregated Statistics For Year 2001 (Based on 4 partial tracts)
A) FHA, FSA/RHS & VA Home Purchase Loans
B) Conventional Home Purchase Loans
C) Refinancings
D) Home Improvement Loans
F) Non-occupant Loans on < 5 Family Dwellings (A B C & D)
Number
Average Value
Number
Average Value
Number
Average Value
Number
Average Value
Number
Average Value
LOANS ORIGINATED
2
$200,875
159
$235,679
452
$216,605
25
$115,808
17
$205,282
APPLICATIONS APPROVED, NOT ACCEPTED
0
$0
9
$258,798
39
$151,529
9
$86,082
0
$0
APPLICATIONS DENIED
0
$0
14
$242,811
59
$214,389
6
$50,475
4
$316,538
APPLICATIONS WITHDRAWN
0
$0
17
$183,671
45
$217,519
6
$43,952
3
$91,870
FILES CLOSED FOR INCOMPLETENESS
0
$0
3
$247,693
18
$209,674
5
$57,060
0
$0
Aggregated Statistics For Year 2000 (Based on 4 partial tracts)
A) FHA, FSA/RHS & VA Home Purchase Loans
B) Conventional Home Purchase Loans
C) Refinancings
D) Home Improvement Loans
E) Loans on Dwellings For 5+ Families
F) Non-occupant Loans on < 5 Family Dwellings (A B C & D)
Number
Average Value
Number
Average Value
Number
Average Value
Number
Average Value
Number
Average Value
Number
Average Value
LOANS ORIGINATED
3
$216,783
152
$232,835
125
$197,423
29
$74,012
1
$225,760
7
$188,731
APPLICATIONS APPROVED, NOT ACCEPTED
0
$0
17
$201,756
16
$155,459
8
$38,505
0
$0
2
$47,985
APPLICATIONS DENIED
0
$0
19
$222,447
37
$157,886
10
$20,091
0
$0
1
$255,920
APPLICATIONS WITHDRAWN
1
$112,740
11
$258,919
17
$135,021
3
$103,570
0
$0
0
$0
FILES CLOSED FOR INCOMPLETENESS
0
$0
1
$336,990
17
$188,197
1
$12,250
0
$0
0
$0
Aggregated Statistics For Year 1999 (Based on 2 partial tracts)
A) FHA, FSA/RHS & VA Home Purchase Loans
B) Conventional Home Purchase Loans
C) Refinancings
D) Home Improvement Loans
F) Non-occupant Loans on < 5 Family Dwellings (A B C & D)


 Nearest zip codes: 60076, 60201, 60091, 60202, 60043, 60077.