Estimated zip code population in 2022: 1,559 Zip code population in 2010: 1,684 Zip code population in 2000: 1,604
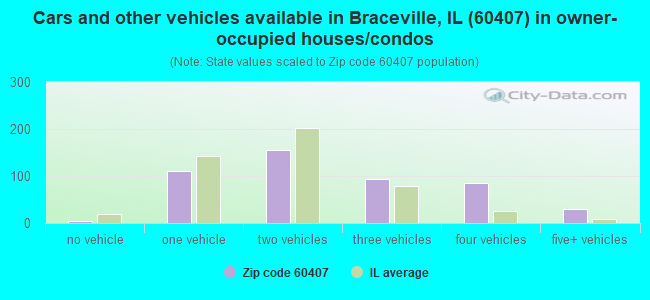
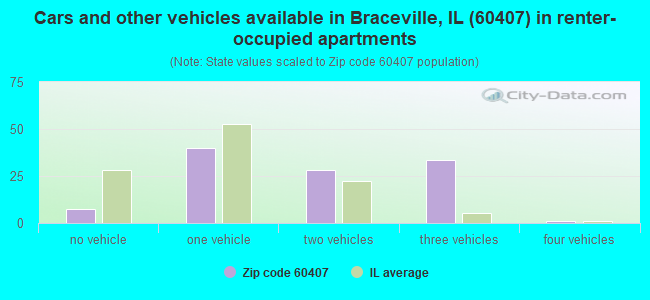
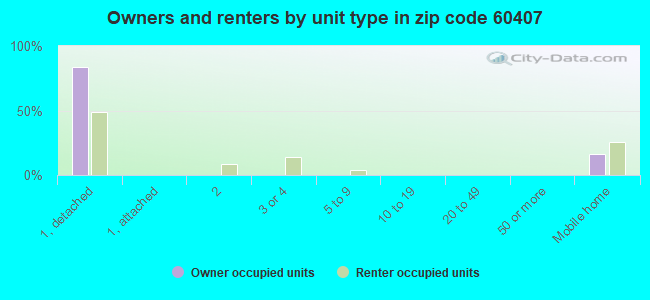
Houses and condos: 636 Renter-occupied apartments: 110
% of renters here:
19%
State:
33%
March 2022 cost of living index in zip code 60407: 98.5 (near average, U.S. average is 100)
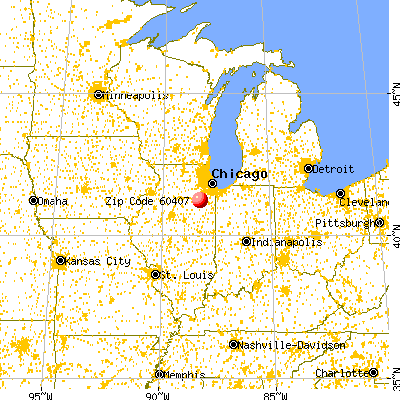
Land area: 12.0 sq. mi. Water area: 0.1 sq. mi.
Population density: 130 people per square mile
(very low).
OSM Map
General Map
Google Map
MSN Map
OSM Map
General Map
Google Map
MSN Map
OSM Map
General Map
Google Map
MSN Map
OSM Map
General Map
Google Map
MSN Map
Please wait while loading the map...
Real estate property taxes paid for housing units in 2022:
This zip code:
1.7% ($2,827)
Illinois:
2.0% ($4,912)
Median real estate property taxes paid for housing units with mortgages in 2022: $3,162 (1.6%) Median real estate property taxes paid for housing units with no mortgage in 2022: $2,242 (1.9%)
Business Search- 14 Million verified businesses
Males: 962
(61.7%)
Females: 597
(38.3%)
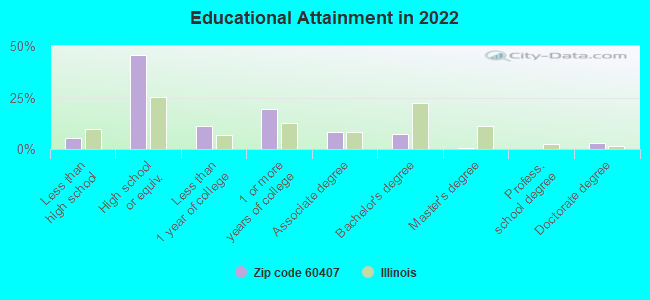
For population 25 years and over in 60407:
High school or higher: 93.1%
Bachelor's degree or higher: 10.6%
Graduate or professional degree: 3.2%
Unemployed: 3.9%
Mean travel time to work (commute): 33.0 minutes
For population 15 years and over in 60407:
Never married: 30.0%
Now married: 44.2%
Separated: 1.3%
Widowed: 3.8%
Divorced: 20.6%
Zip code 60407 compared to state average:
Black race population percentage significantly below state average.
Foreign-born population percentage significantly below state average.
Renting percentage below state average.
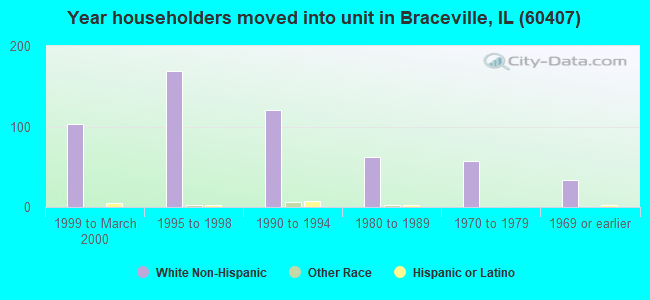
Length of stay since moving in significantly above state average.
House age below state average.
Number of college students below state average.
Percentage of population with a bachelor's degree or higher significantly below state average.
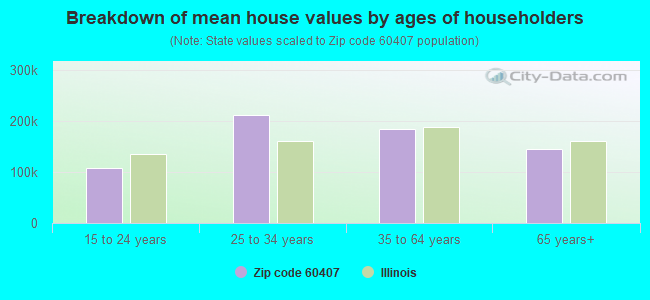
Estimated median house/condo value in 2022: $170,259
60407:
$170,259
Illinois:
$251,600
According to our research of Illinois and other state lists, there were 2 registered sex offenders living in 60407 zip code as of May 29, 2024. The ratio of all residents to sex offenders in zip code 60407 is 943 to 1. The ratio of registered sex offenders to all residents in this zip code is near the state average.
Median resident age:
This zip code:
42.5 years
Illinois median age:
39.1 years
Average household size:
This zip code:
2.6 people
Illinois:
2.4 people
Averages for the 2020 tax year for zip code 60407, filed in 2021:
Average Adjusted Gross Income (AGI) in 2020: $54,170 (Individual Income Tax Returns)
Here:
$54,170
State:
$82,626
Salary/wage: $48,487 (reported on 84.8% of returns)
Here:
$48,487
State:
$66,640
(% of AGI for various income ranges: 1074.8% for AGIs below $25k, 3304.7% for AGIs $25k-50k, 5711.1% for AGIs $50k-75k, 8740.0% for AGIs $75k-100k, 16422.5% for AGIs $100k-200k)
Taxable interest for individuals: $320 (reported on 19.0% of returns)
This zip code:
$320
Illinois:
$2,376
(% of AGI for various income ranges: 6.5% for AGIs below $25k, 5.3% for AGIs $25k-50k, 4.4% for AGIs $50k-75k, 17.1% for AGIs $75k-100k, 10.0% for AGIs $100k-200k)
Ordinary dividends: $1,533 (reported on 11.4% of returns)
Here:
$1,533
State:
$9,061
(% of AGI for various income ranges: 26.1% for AGIs below $25k, 41.1% for AGIs $50k-75k, 51.2% for AGIs $100k-200k)
Net capital gain/loss in AGI: +$1,014 (reported on 8.9% of returns)
Here:
+$1,014
State:
+$31,684
(% of AGI for various income ranges: 17.6% for AGIs $25k-50k, 58.6% for AGIs $75k-100k)
Profit/loss from business: +$2,417 (reported on 7.6% of returns)
Here:
+$2,417
State:
+$12,175
(% of AGI for various income ranges: 47.8% for AGIs below $25k, 35.9% for AGIs $25k-50k)
Taxable individual retirement arrangement distribution: $9,980 (reported on 6.3% of returns)
60407:
$9,980
Illinois:
$21,613
(% of AGI for various income ranges: 293.5% for AGIs $25k-50k)
Total itemized deductions: $23,700 (reported on 2.5% of returns)
Here:
$23,700
State:
$34,948
(% of AGI for various income ranges: 526.7% for AGIs $50k-75k)
Taxes paid: $8,150 (reported on 2.5% of returns)
60407:
$8,150
State:
$8,563
(% of AGI for various income ranges: 95.9% for AGIs $25k-50k)
Earned income credit: $2,218 (reported on 13.9% of returns)
Here:
$2,218
State:
$2,311
(% of AGI for various income ranges: 71.3% for AGIs below $25k, 47.1% for AGIs $25k-50k)
Percentage of individuals using paid preparers for their 2020 taxes: 96.2%
Here:
96%
State:
93%
(% for various income ranges: 92.9% for AGIs below $25k, 95.0% for AGIs $25k-50k, 100.0% for AGIs $50k-75k, 100.0% for AGIs $75k-100k, 100.0% for AGIs $100k-200k)
Averages for the 2012 tax year for zip code 60407, filed in 2013:
Average Adjusted Gross Income (AGI) in 2012: $41,930 (Individual Income Tax Returns)
Here:
$41,930
State:
$68,058
Salary/wage: $38,330 (reported on 85.2% of returns)
Here:
$38,330
State:
$55,396
(% of AGI for various income ranges: 71.0% for AGIs below $25k, 76.1% for AGIs $25k-50k, 82.5% for AGIs $50k-75k, 80.8% for AGIs $75k-100k, 76.8% for AGIs $100k-200k)
Taxable interest for individuals: $485 (reported on 24.7% of returns)
This zip code:
$485
Illinois:
$1,969
(% of AGI for various income ranges: 1.1% for AGIs below $25k, 0.3% for AGIs $25k-50k, 0.1% for AGIs $50k-75k, 0.1% for AGIs $75k-100k, 0.1% for AGIs $100k-200k)
Ordinary dividends: $933 (reported on 14.8% of returns)
Here:
$933
State:
$7,786
(% of AGI for various income ranges: 0.7% for AGIs below $25k, 0.2% for AGIs $25k-50k, 0.3% for AGIs $50k-75k, 0.7% for AGIs $75k-100k)
Net capital gain/loss in AGI: +$100 (reported on 6.2% of returns)
Here:
+$100
State:
+$22,183
Profit/loss from business: +$3,012 (reported on 9.9% of returns)
Here:
+$3,012
State:
+$12,903
Taxable individual retirement arrangement distribution: $6,660 (reported on 6.2% of returns)
60407:
$6,660
Illinois:
$17,929
Total itemized deductions: $16,170 (22% of AGI, reported on 28.4% of returns)
Here:
$16,170
State:
$26,433
Here:
22.3% of AGI
State:
19.2% of AGI
(% of AGI for various income ranges: 8.1% for AGIs below $25k, 8.6% for AGIs $25k-50k, 11.3% for AGIs $50k-75k, 12.6% for AGIs $75k-100k, 12.7% for AGIs $100k-200k)
Charity contributions: $1,547 (reported on 18.5% of returns)
Here:
$1,547
State:
$4,525
(% of AGI for various income ranges: 0.7% for AGIs $25k-50k, 1.0% for AGIs $50k-75k, 0.7% for AGIs $75k-100k, 0.7% for AGIs $100k-200k)
Taxes paid: $6,326 (reported on 28.4% of returns)
60407:
$6,326
State:
$11,968
(% of AGI for various income ranges: 2.6% for AGIs below $25k, 2.8% for AGIs $25k-50k, 4.2% for AGIs $50k-75k, 5.1% for AGIs $75k-100k, 5.8% for AGIs $100k-200k)
Earned income credit: $2,171 (reported on 21.0% of returns)
Here:
$2,171
State:
$2,349
(% of AGI for various income ranges: 7.4% for AGIs below $25k, 0.9% for AGIs $25k-50k)
Percentage of individuals using paid preparers for their 2012 taxes: 59.3%
Here:
59%
State:
57%
(% for various income ranges: 52.9% for AGIs below $25k, 61.9% for AGIs $25k-50k, 63.6% for AGIs $50k-75k, 62.5% for AGIs $75k-100k, 71.4% for AGIs $100k-200k)
Averages for the 2004 tax year for zip code 60407, filed in 2005:
Average Adjusted Gross Income (AGI) in 2004: $37,004 (Individual Income Tax Returns)
Here:
$37,004
State:
$54,625
Salary/wage: $35,274 (reported on 88.2% of returns)
Here:
$35,274
State:
$46,811
(% of AGI for various income ranges: 80.1% for AGIs below $10k, 68.5% for AGIs $10k-25k, 83.3% for AGIs $25k-50k, 86.4% for AGIs $50k-75k, 90.9% for AGIs $75k-100k, 81.8% for AGIs over 100k)
Taxable interest for individuals: $699 (reported on 38.0% of returns)
This zip code:
$699
Illinois:
$2,101
(% of AGI for various income ranges: 3.1% for AGIs below $10k, 1.9% for AGIs $10k-25k, 0.9% for AGIs $25k-50k, 0.5% for AGIs $50k-75k, 0.3% for AGIs $75k-100k, 0.2% for AGIs over 100k)
Taxable dividends: $504 (reported on 14.5% of returns)
Here:
$504
State:
$4,306
(% of AGI for various income ranges: 0.3% for AGIs below $10k, 1.1% for AGIs $10k-25k, 0.1% for AGIs $25k-50k, 0.2% for AGIs $50k-75k, 0.1% for AGIs $75k-100k)
Net capital gain/loss: +$645 (reported on 9.8% of returns)
Here:
+$645
State:
+$17,321
(% of AGI for various income ranges: -1.4% for AGIs below $10k, -0.1% for AGIs $10k-25k, -0.1% for AGIs $25k-50k, 1.1% for AGIs $75k-100k)
Profit/loss from business: +$2,600 (reported on 11.6% of returns)
Here:
+$2,600
State:
+$11,771
(% of AGI for various income ranges: 4.5% for AGIs below $10k, 5.3% for AGIs $10k-25k, 0.3% for AGIs $25k-50k, 0.3% for AGIs $50k-75k, 0.1% for AGIs $75k-100k)
Total itemized deductions: $13,538 (23% of AGI, reported on 32.0% of returns)
Here:
$13,538
State:
$20,239
Here:
23.1% of AGI
State:
19.5% of AGI
(% of AGI for various income ranges: 10.2% for AGIs $10k-25k, 11.6% for AGIs $25k-50k, 13.1% for AGIs $50k-75k, 13.3% for AGIs $75k-100k, 9.4% for AGIs over 100k)
Charity contributions deductions: $1,533 (2% of AGI, reported on 27.0% of returns)
Here:
$1,533
State:
$3,719
Here:
2.5% of AGI
State:
3.4% of AGI
(% of AGI for various income ranges: 0.8% for AGIs $10k-25k, 1.2% for AGIs $25k-50k, 1.0% for AGIs $50k-75k, 1.3% for AGIs $75k-100k, 1.3% for AGIs over 100k)
Total tax: $4,324 (reported on 72.5% of returns)
60407:
$4,324
State:
$9,882
(% of AGI for various income ranges: 1.9% for AGIs below $10k, 3.6% for AGIs $10k-25k, 6.6% for AGIs $25k-50k, 8.3% for AGIs $50k-75k, 10.3% for AGIs $75k-100k, 15.3% for AGIs over 100k)
Earned income credit: $1,534 (reported on 17.1% of returns)
Here:
$1,534
State:
$1,788
Percentage of individuals using paid preparers for their 2004 taxes: 69.0%
Here:
69%
State:
61%
(% for various income ranges: 61.6% for AGIs below $10k, 68.6% for AGIs $10k-25k, 69.2% for AGIs $25k-50k, 79.4% for AGIs $50k-75k, 67.1% for AGIs $75k-100k, 67.9% for AGIs over 100k)
Household received Food Stamps/SNAP in the past 12 months: 114 Household did not receive Food Stamps/SNAP in the past 12 months: 483
Women who had a birth in the past 12 months: 13 (4 now married, 8 unmarried) Women who did not have a birth in the past 12 months: 272 (118 now married, 154 unmarried)
Housing units in zip code 60407 with a mortgage: 290 (13 second mortgage, 12 both second mortgage and home equity loan) Houses without a mortgage: 4
Median monthly owner costs for units with a mortgage: $1,346 Median monthly owner costs for units without a mortgage: $474
Residents with income below the poverty level in 2022:
This zip code:
11.2%
Whole state:
11.9%
Residents with income below 50% of the poverty level in 2022:
This zip code:
4.9%
Whole state:
5.7%
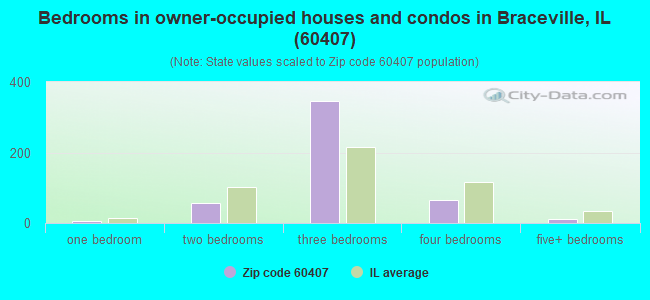
Median number of rooms in houses and condos:
Here:
5.8
State:
6.4
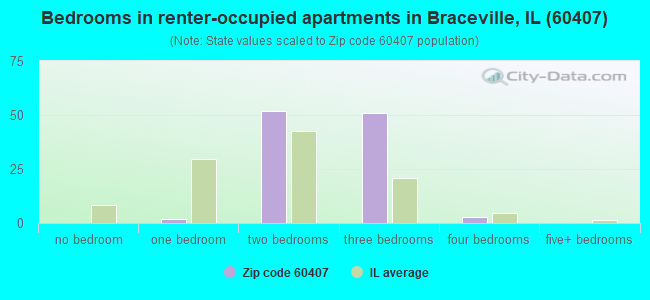
Median number of rooms in apartments:
Here:
4.8
State:
4.1
Notable locations in this zip code not listed on our city pages
Size of family households: 205 2-persons, 109 3-persons, 57 4-persons, 33 5-persons, 4 7-or-more-persons
Size of nonfamily households: 132 1-person, 46 2-persons, 4 3-persons
137 married couples with children.
215 single-parent households (20 men, 195 women).
97.2% of residents of 60407 zip code speak English at home.
1.2% of residents speak Spanish at home (88% very well, 12% well).
0.8% of residents speak other Indo-European language at home (100% very well).
0.2% of residents speak Asian or Pacific Island language at home (100% very well).
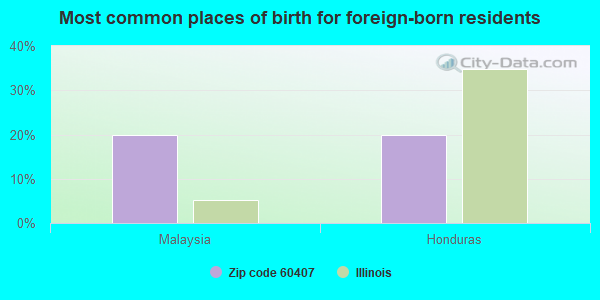
Foreign born population: 5 (0.3%) (100.0% of them are naturalized citizens)
This zip code:
0.3%
Whole state:
14.4%
20%Malaysia
20%Honduras
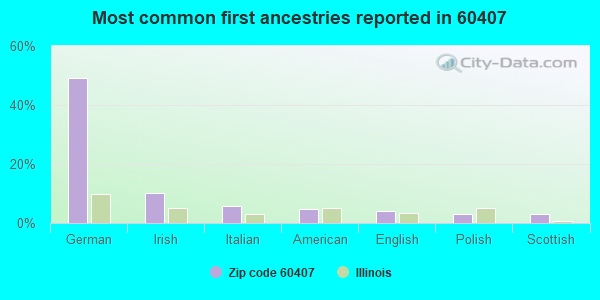
49%German
10%Irish
6%Italian
5%American
4%English
3%Polish
3%Scottish
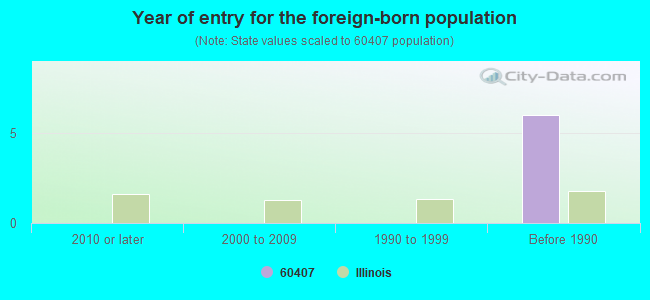
Year of entry for the foreign-born population
02010 or later
02000 to 2009
01990 to 1999
6Before 1990
Facilities with environmental interests located in this zip code:
ROCK SOLID MATERIAL (8460 E BRACEVILLE RD. in BRACEVILLE, IL)
STATE MASTER (Illinois EPA Project) - AIR PROGRAM AIR MAJOR (AIRS/AFS) CRITERIA AND HAZARDOUS AIR POLLUTANT INVENTORY (Inventory of air pollution sources) Business SIC classification: NONCLASSIFIABLE ESTABLISHMENTS
Housing units lacking complete plumbing facilities: 3.5% Housing units lacking complete kitchen facilities: 3.5%
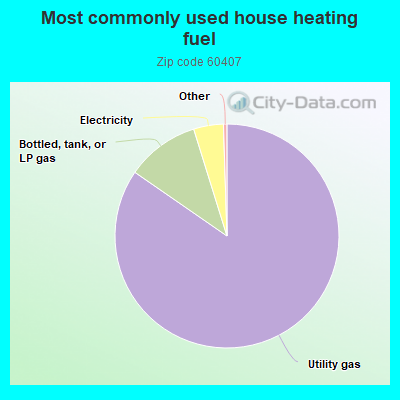
84.8%Utility gas
10.6%Bottled, tank, or LP gas
4.3%Electricity
Population in 1990: 1,535. Population change in the 1990s: +69 (+4.5%).
Place of birth for U.S.-born residents:
This state: 1,367
Northeast: 10
Midwest: 84
South: 55
West: 26
61% of the 60407 zip code residents lived in the same house 5 years ago. Out of people who lived in different houses, 44% lived in this county. Out of people who lived in different counties, 50% lived in Illinois.
94% of the 60407 zip code residents lived in the same house 1 year ago. Out of people who lived in different houses, 63% moved from this county. Out of people who lived in different houses, 25% moved from different county within same state. Out of people who lived in different houses, 3% moved from different state. Out of people who lived in different houses, 3% moved from abroad.
Private vs. public school enrollment:
Students in private schools in grades 1 to 8 (elementary and middle school): 6
Here:
8.0%
Illinois:
13.3%
Students in private schools in grades 9 to 12 (high school):
Here:
0.0%
Illinois:
9.9%
Students in private undergraduate colleges:
Here:
0.0%
Illinois:
27.4%
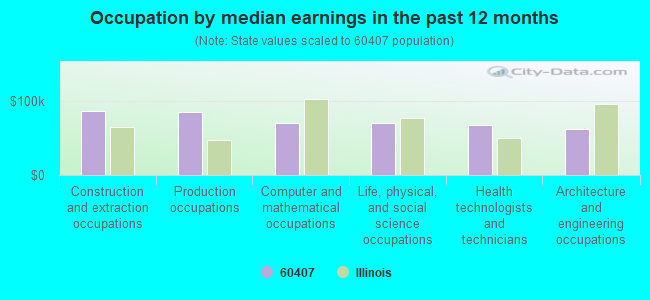
Occupation by median earnings in the past 12 months ($)
85,667Construction and extraction occupations
84,192Production occupations
69,376Computer and mathematical occupations
69,229Life, physical, and social science occupations
66,577Health technologists and technicians
61,849Architecture and engineering occupations
Top industries in this zip code by the number of employees in 2005:
Utilities: Nuclear Electric Power Generation (500-999 employees: 1 establishment)
Other Services (except Public Administration): General Automotive Repair (20-49: 1)
Wholesale Trade: Motor Vehicle Supplies and New Parts Merchant Wholesalers (10-19: 1, 5-9: 1)
Accommodation and Food Services: Food Service Contractors (10-19: 1)
Construction: Poured Concrete Foundation and Structure Contractors (1-4: 1)
Administrative and Support and Waste Management and Remediation Services: All Other Miscellaneous Waste Management Services (1-4: 1)
Construction: Site Preparation Contractors (1-4: 1)
Accommodation and Food Services: Drinking Places (Alcoholic Beverages) (1-4: 1)
Administrative and Support and Waste Management and Remediation Services: Employment Placement Agencies (1-4: 1)
Fatal accident statistics in 2010:
Fatal accident count: 1
Vehicles involved in fatal accidents: 1
Fatal accidents caused by drunken drivers: 1
Fatalities: 1
Persons involved in fatal accidents: 2
Pedestrians involved in fatal accidents: 0
Home Mortgage Disclosure Act Aggregated Statistics For Year 2009 (Based on 6 partial tracts)
A) FHA, FSA/RHS & VA Home Purchase Loans
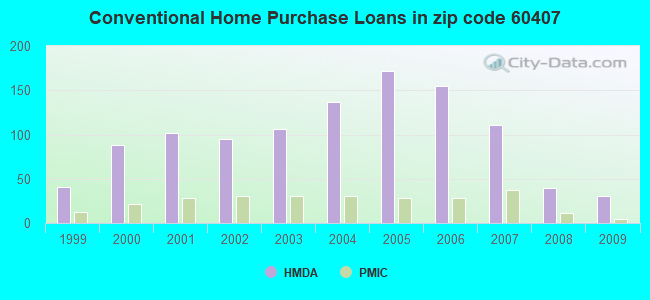
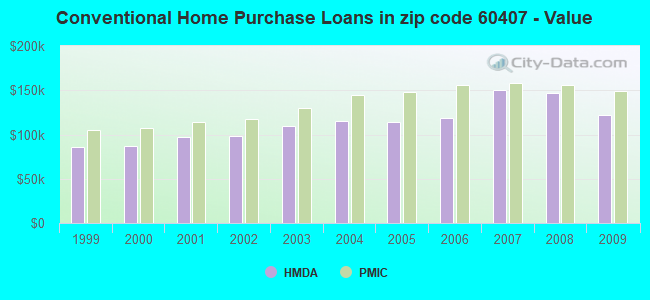
B) Conventional Home Purchase Loans
C) Refinancings
D) Home Improvement Loans
F) Non-occupant Loans on < 5 Family Dwellings (A B C & D)
G) Loans On Manufactured Home Dwelling (A B C & D)
Number
Average Value
Number
Average Value
Number
Average Value
Number
Average Value
Number
Average Value
Number
Average Value
LOANS ORIGINATED
30
$147,177
30
$121,651
199
$145,920
9
$67,550
11
$104,626
4
$59,590
APPLICATIONS APPROVED, NOT ACCEPTED
1
$222,780
1
$225,180
17
$133,411
1
$69,830
0
$0
0
$0
APPLICATIONS DENIED
4
$114,112
5
$97,778
45
$156,844
2
$7,750
3
$93,107
4
$44,542
APPLICATIONS WITHDRAWN
3
$156,433
1
$168,170
31
$164,924
1
$109,850
1
$166,910
0
$0
FILES CLOSED FOR INCOMPLETENESS
0
$0
1
$74,970
11
$134,521
0
$0
0
$0
0
$0
Aggregated Statistics For Year 2008 (Based on 6 partial tracts)
A) FHA, FSA/RHS & VA Home Purchase Loans
B) Conventional Home Purchase Loans
C) Refinancings
D) Home Improvement Loans
E) Loans on Dwellings For 5+ Families
F) Non-occupant Loans on < 5 Family Dwellings (A B C & D)
G) Loans On Manufactured Home Dwelling (A B C & D)
Number
Average Value
Number
Average Value
Number
Average Value
Number
Average Value
Number
Average Value
Number
Average Value
Number
Average Value
LOANS ORIGINATED
25
$159,542
39
$147,289
107
$148,836
11
$41,495
1
$564,640
13
$224,126
4
$74,600
APPLICATIONS APPROVED, NOT ACCEPTED
1
$280,710
5
$133,752
11
$141,893
1
$35,110
0
$0
2
$145,020
0
$0
APPLICATIONS DENIED
4
$139,978
11
$154,265
58
$154,275
20
$38,434
0
$0
4
$98,462
3
$42,957
APPLICATIONS WITHDRAWN
3
$153,563
5
$164,126
21
$158,962
2
$152,585
0
$0
0
$0
0
$0
FILES CLOSED FOR INCOMPLETENESS
0
$0
2
$168,930
9
$149,297
1
$47,070
0
$0
0
$0
0
$0
Aggregated Statistics For Year 2007 (Based on 6 partial tracts)
A) FHA, FSA/RHS & VA Home Purchase Loans
B) Conventional Home Purchase Loans
C) Refinancings
D) Home Improvement Loans
F) Non-occupant Loans on < 5 Family Dwellings (A B C & D)
G) Loans On Manufactured Home Dwelling (A B C & D)
Number
Average Value
Number
Average Value
Number
Average Value
Number
Average Value
Number
Average Value
Number
Average Value
LOANS ORIGINATED
17
$163,294
111
$150,137
146
$128,330
24
$63,728
24
$118,315
7
$69,031
APPLICATIONS APPROVED, NOT ACCEPTED
0
$0
13
$117,898
25
$133,622
4
$78,400
1
$88,760
1
$143,670
APPLICATIONS DENIED
1
$186,250
20
$158,550
72
$136,388
16
$57,652
5
$102,976
3
$58,573
APPLICATIONS WITHDRAWN
0
$0
9
$136,066
38
$150,339
5
$109,124
1
$287,570
0
$0
FILES CLOSED FOR INCOMPLETENESS
0
$0
5
$195,528
17
$144,740
0
$0
1
$157,250
0
$0
Aggregated Statistics For Year 2006 (Based on 6 partial tracts)
A) FHA, FSA/RHS & VA Home Purchase Loans
B) Conventional Home Purchase Loans
C) Refinancings
D) Home Improvement Loans
F) Non-occupant Loans on < 5 Family Dwellings (A B C & D)
G) Loans On Manufactured Home Dwelling (A B C & D)
Number
Average Value
Number
Average Value
Number
Average Value
Number
Average Value
Number
Average Value
Number
Average Value
LOANS ORIGINATED
15
$143,526
155
$118,126
154
$128,773
18
$44,015
25
$100,202
6
$57,570
APPLICATIONS APPROVED, NOT ACCEPTED
1
$124,270
18
$118,746
25
$119,175
5
$41,750
2
$89,360
2
$73,795
APPLICATIONS DENIED
1
$141,740
30
$118,184
86
$129,949
23
$52,404
6
$116,793
3
$62,910
APPLICATIONS WITHDRAWN
1
$192,900
14
$108,501
50
$137,595
4
$94,820
4
$141,028
0
$0
FILES CLOSED FOR INCOMPLETENESS
0
$0
8
$116,765
19
$136,535
0
$0
1
$83,760
0
$0
Aggregated Statistics For Year 2005 (Based on 6 partial tracts)
A) FHA, FSA/RHS & VA Home Purchase Loans
B) Conventional Home Purchase Loans
C) Refinancings
D) Home Improvement Loans
E) Loans on Dwellings For 5+ Families
F) Non-occupant Loans on < 5 Family Dwellings (A B C & D)
G) Loans On Manufactured Home Dwelling (A B C & D)
Number
Average Value
Number
Average Value
Number
Average Value
Number
Average Value
Number
Average Value
Number
Average Value
Number
Average Value
LOANS ORIGINATED
23
$138,214
172
$114,677
164
$121,385
17
$64,148
1
$321,550
32
$106,672
7
$58,720
APPLICATIONS APPROVED, NOT ACCEPTED
3
$130,130
15
$119,162
25
$125,816
3
$61,750
0
$0
2
$98,000
1
$43,710
APPLICATIONS DENIED
2
$128,090
27
$101,262
101
$127,653
17
$44,745
0
$0
4
$85,508
5
$61,996
APPLICATIONS WITHDRAWN
0
$0
21
$97,386
70
$138,127
6
$154,802
0
$0
5
$93,166
0
$0
FILES CLOSED FOR INCOMPLETENESS
1
$106,450
5
$116,176
19
$143,994
0
$0
0
$0
1
$80,460
0
$0
Aggregated Statistics For Year 2004 (Based on 6 partial tracts)
A) FHA, FSA/RHS & VA Home Purchase Loans
B) Conventional Home Purchase Loans
C) Refinancings
D) Home Improvement Loans
E) Loans on Dwellings For 5+ Families
F) Non-occupant Loans on < 5 Family Dwellings (A B C & D)
G) Loans On Manufactured Home Dwelling (A B C & D)
Number
Average Value
Number
Average Value
Number
Average Value
Number
Average Value
Number
Average Value
Number
Average Value
Number
Average Value
LOANS ORIGINATED
23
$132,796
137
$115,165
160
$119,376
16
$43,192
1
$393,550
26
$96,539
8
$51,125
APPLICATIONS APPROVED, NOT ACCEPTED
1
$88,790
10
$108,332
21
$124,076
2
$24,580
0
$0
2
$85,060
2
$17,715
APPLICATIONS DENIED
4
$121,215
25
$94,052
84
$119,683
20
$57,790
0
$0
6
$82,082
4
$58,935
APPLICATIONS WITHDRAWN
1
$93,430
9
$139,831
51
$112,325
4
$58,012
0
$0
3
$164,587
2
$57,660
FILES CLOSED FOR INCOMPLETENESS
1
$146,120
2
$103,110
21
$141,806
1
$100,420
0
$0
2
$101,970
0
$0
Aggregated Statistics For Year 2003 (Based on 6 partial tracts)
A) FHA, FSA/RHS & VA Home Purchase Loans
B) Conventional Home Purchase Loans
C) Refinancings
D) Home Improvement Loans
E) Loans on Dwellings For 5+ Families
F) Non-occupant Loans on < 5 Family Dwellings (A B C & D)
Number
Average Value
Number
Average Value
Number
Average Value
Number
Average Value
Number
Average Value
Number
Average Value
LOANS ORIGINATED
24
$121,197
106
$109,267
358
$106,410
11
$27,466
1
$344,530
25
$92,560
APPLICATIONS APPROVED, NOT ACCEPTED
1
$61,860
9
$98,921
36
$103,862
2
$24,020
0
$0
3
$64,623
APPLICATIONS DENIED
3
$153,393
14
$73,571
94
$106,936
12
$25,916
0
$0
4
$73,280
APPLICATIONS WITHDRAWN
1
$61,630
8
$115,556
72
$117,006
2
$36,440
0
$0
1
$168,460
FILES CLOSED FOR INCOMPLETENESS
0
$0
2
$64,180
8
$111,194
0
$0
0
$0
0
$0
Aggregated Statistics For Year 2002 (Based on 6 partial tracts)
A) FHA, FSA/RHS & VA Home Purchase Loans
B) Conventional Home Purchase Loans
C) Refinancings
D) Home Improvement Loans
F) Non-occupant Loans on < 5 Family Dwellings (A B C & D)
Number
Average Value
Number
Average Value
Number
Average Value
Number
Average Value
Number
Average Value
LOANS ORIGINATED
18
$115,979
95
$98,338
228
$102,726
12
$24,533
24
$72,478
APPLICATIONS APPROVED, NOT ACCEPTED
0
$0
7
$134,900
25
$97,684
0
$0
2
$81,160
APPLICATIONS DENIED
2
$132,670
10
$68,848
57
$96,238
11
$12,606
2
$84,410
APPLICATIONS WITHDRAWN
1
$127,420
7
$103,919
39
$113,925
1
$15,510
2
$44,860
FILES CLOSED FOR INCOMPLETENESS
0
$0
2
$132,050
13
$106,660
1
$66,340
0
$0
Aggregated Statistics For Year 2001 (Based on 6 partial tracts)
A) FHA, FSA/RHS & VA Home Purchase Loans
B) Conventional Home Purchase Loans
C) Refinancings
D) Home Improvement Loans
E) Loans on Dwellings For 5+ Families
F) Non-occupant Loans on < 5 Family Dwellings (A B C & D)
Number
Average Value
Number
Average Value
Number
Average Value
Number
Average Value
Number
Average Value
Number
Average Value
LOANS ORIGINATED
27
$99,159
102
$97,441
200
$92,077
13
$24,091
2
$210,755
18
$83,987
APPLICATIONS APPROVED, NOT ACCEPTED
0
$0
10
$93,456
21
$77,764
3
$26,150
0
$0
2
$58,295
APPLICATIONS DENIED
2
$122,915
17
$73,312
69
$80,497
13
$23,074
0
$0
6
$54,618
APPLICATIONS WITHDRAWN
2
$103,060
9
$113,020
43
$91,343
2
$21,225
0
$0
4
$87,180
FILES CLOSED FOR INCOMPLETENESS
0
$0
1
$145,910
12
$101,360
0
$0
0
$0
0
$0
Aggregated Statistics For Year 2000 (Based on 6 partial tracts)
A) FHA, FSA/RHS & VA Home Purchase Loans
B) Conventional Home Purchase Loans
C) Refinancings
D) Home Improvement Loans
F) Non-occupant Loans on < 5 Family Dwellings (A B C & D)
Number
Average Value
Number
Average Value
Number
Average Value
Number
Average Value
Number
Average Value
LOANS ORIGINATED
25
$100,557
88
$87,257
62
$80,501
20
$21,916
11
$73,774
APPLICATIONS APPROVED, NOT ACCEPTED
1
$81,680
9
$72,878
12
$80,671
4
$24,928
0
$0
APPLICATIONS DENIED
3
$96,730
18
$69,192
43
$68,722
13
$21,594
2
$64,550
APPLICATIONS WITHDRAWN
2
$121,615
7
$83,113
24
$80,915
3
$48,327
2
$68,990
FILES CLOSED FOR INCOMPLETENESS
0
$0
3
$111,187
8
$91,266
0
$0
0
$0
Aggregated Statistics For Year 1999 (Based on 3 partial tracts)
A) FHA, FSA/RHS & VA Home Purchase Loans
B) Conventional Home Purchase Loans
C) Refinancings
D) Home Improvement Loans
F) Non-occupant Loans on < 5 Family Dwellings (A B C & D)
2002 - 2018 National Fire Incident Reporting System (NFIRS) incidents
According to the data from the years 2002 - 2018 the average number of fires per year is 14. The highest number of fires - 28 took place in 2009, and the least - 3 in 2006. The data has an increasing trend.
When looking into fire subcategories, the most reports belonged to: Outside Fires (57.3%), and Structure Fires (26.8%).
Fire incident types reported to NFIRS in Zip Code 60407


 Nearest zip codes: 60408, 60474, 60416, 60424, 60935, 60961.


 According to the data from the years 2002 - 2018 the average number of fires per year is 14. The highest number of fires - 28 took place in 2009, and the least - 3 in 2006. The data has an increasing trend.
 When looking into fire subcategories, the most reports belonged to: Outside Fires (57.3%), and Structure Fires (26.8%).