Estimated zip code population in 2022: 38,405 Zip code population in 2010: 40,524 Zip code population in 2000: 40,640
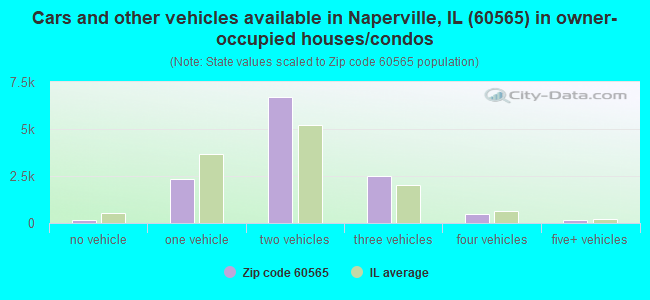
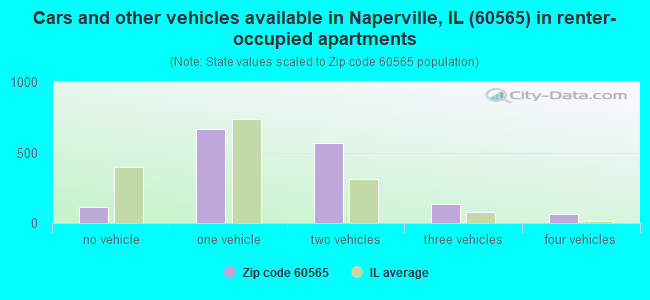
Houses and condos: 14,339 Renter-occupied apartments: 1,576
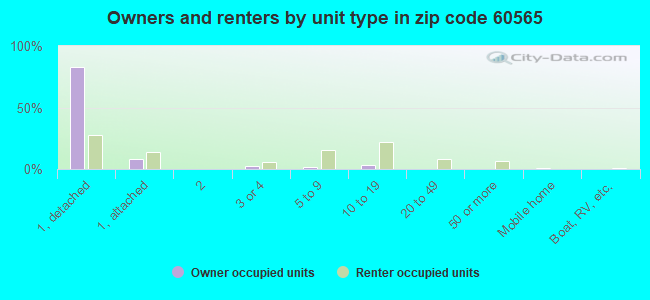
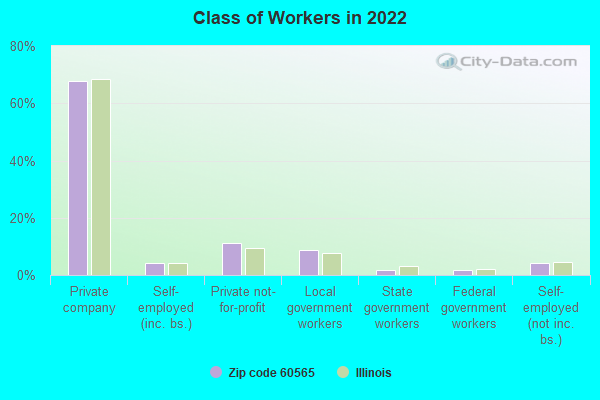
% of renters here:
11%
State:
33%
March 2022 cost of living index in zip code 60565: 102.1 (near average, U.S. average is 100)
Land area: 12.5 sq. mi. Water area: 0.1 sq. mi.
Population density: 3,081 people per square mile
(average).
OSM Map
General Map
Google Map
MSN Map
OSM Map
General Map
Google Map
MSN Map
OSM Map
General Map
Google Map
MSN Map
OSM Map
General Map
Google Map
MSN Map
Please wait while loading the map...
Real estate property taxes paid for housing units in 2022:
This zip code:
1.9% ($9,143)
Illinois:
2.0% ($4,912)
Median real estate property taxes paid for housing units with mortgages in 2022: $9,127 (1.9%) Median real estate property taxes paid for housing units with no mortgage in 2022: $9,078 (1.9%)
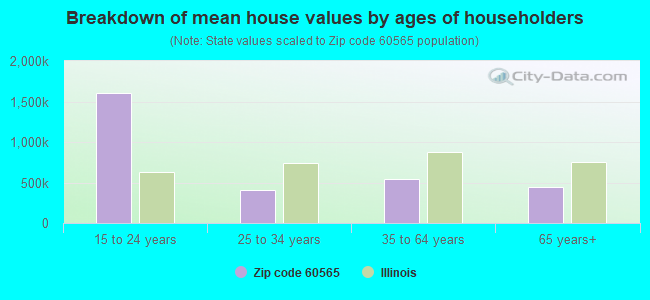
Estimated median house/condo value in 2022: $487,837
60565:
$487,837
Illinois:
$251,600
According to our research of Illinois and other state lists, there were 8 registered sex offenders living in 60565 zip code as of May 17, 2024. The ratio of all residents to sex offenders in zip code 60565 is 5,195 to 1. The ratio of registered sex offenders to all residents in this zip code is much lower than the state average.
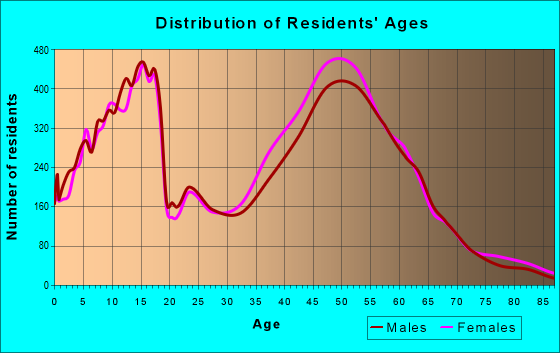
Median resident age:
This zip code:
42.9 years
Illinois median age:
39.1 years
Average household size:
This zip code:
2.7 people
Illinois:
2.4 people
Averages for the 2020 tax year for zip code 60565, filed in 2021:
Average Adjusted Gross Income (AGI) in 2020: $139,469 (Individual Income Tax Returns)
Here:
$139,469
State:
$82,626
Salary/wage: $115,896 (reported on 83.6% of returns)
Here:
$115,896
State:
$66,640
(% of AGI for various income ranges: 1057.1% for AGIs below $25k, 3413.8% for AGIs $25k-50k, 6241.5% for AGIs $50k-75k, 9175.4% for AGIs $75k-100k, 18180.5% for AGIs $100k-200k, 78909.5% for AGIs over 200k)
Taxable interest for individuals: $2,068 (reported on 46.3% of returns)
This zip code:
$2,068
Illinois:
$2,376
(% of AGI for various income ranges: 27.2% for AGIs below $25k, 41.2% for AGIs $25k-50k, 62.9% for AGIs $50k-75k, 112.1% for AGIs $75k-100k, 145.3% for AGIs $100k-200k, 791.8% for AGIs over 200k)
Ordinary dividends: $7,249 (reported on 43.1% of returns)
Here:
$7,249
State:
$9,061
(% of AGI for various income ranges: 54.5% for AGIs below $25k, 91.8% for AGIs $25k-50k, 185.1% for AGIs $50k-75k, 285.8% for AGIs $75k-100k, 486.8% for AGIs $100k-200k, 2775.6% for AGIs over 200k)
Net capital gain/loss in AGI: +$27,450 (reported on 38.8% of returns)
Here:
+$27,450
State:
+$31,684
(% of AGI for various income ranges: 36.4% for AGIs below $25k, 77.6% for AGIs $25k-50k, 142.9% for AGIs $50k-75k, 281.2% for AGIs $75k-100k, 610.5% for AGIs $100k-200k, 13623.2% for AGIs over 200k)
Profit/loss from business: +$18,065 (reported on 16.8% of returns)
Here:
+$18,065
State:
+$12,175
(% of AGI for various income ranges: 140.7% for AGIs below $25k, 198.8% for AGIs $25k-50k, 187.4% for AGIs $50k-75k, 387.3% for AGIs $75k-100k, 500.5% for AGIs $100k-200k, 2200.1% for AGIs over 200k)
Taxable individual retirement arrangement distribution: $33,811 (reported on 13.2% of returns)
60565:
$33,811
Illinois:
$21,613
(% of AGI for various income ranges: 70.1% for AGIs below $25k, 209.1% for AGIs $25k-50k, 384.7% for AGIs $50k-75k, 620.4% for AGIs $75k-100k, 1059.1% for AGIs $100k-200k, 2736.3% for AGIs over 200k)
Self-employed (Keogh) retirement plans: $26,256 (reported on 1.4% of returns)
60565:
$26,256
Illinois:
$30,962
(% of AGI for various income ranges: 11.7% for AGIs $25k-50k, 43.6% for AGIs $100k-200k, 425.4% for AGIs over 200k)
Total itemized deductions: $33,669 (reported on 16.7% of returns)
Here:
$33,669
State:
$34,948
(% of AGI for various income ranges: 116.6% for AGIs below $25k, 229.1% for AGIs $25k-50k, 440.1% for AGIs $50k-75k, 776.8% for AGIs $75k-100k, 1072.1% for AGIs $100k-200k, 4079.4% for AGIs over 200k)
Charity contributions: $9,907 (reported on 14.6% of returns)
Here:
$9,907
State:
$13,122
(% of AGI for various income ranges: 7.4% for AGIs below $25k, 23.7% for AGIs $25k-50k, 49.0% for AGIs $50k-75k, 122.7% for AGIs $75k-100k, 217.7% for AGIs $100k-200k, 1409.2% for AGIs over 200k)
Taxes paid: $9,326 (reported on 16.6% of returns)
60565:
$9,326
State:
$8,563
(% of AGI for various income ranges: 27.2% for AGIs below $25k, 64.9% for AGIs $25k-50k, 143.4% for AGIs $50k-75k, 254.0% for AGIs $75k-100k, 344.0% for AGIs $100k-200k, 969.1% for AGIs over 200k)
Earned income credit: $1,823 (reported on 5.6% of returns)
Here:
$1,823
State:
$2,311
(% of AGI for various income ranges: 43.5% for AGIs below $25k, 38.5% for AGIs $25k-50k)
Percentage of individuals using paid preparers for their 2020 taxes: 91.7%
Here:
92%
State:
93%
(% for various income ranges: 89.4% for AGIs below $25k, 91.8% for AGIs $25k-50k, 90.8% for AGIs $50k-75k, 92.2% for AGIs $75k-100k, 92.2% for AGIs $100k-200k, 93.8% for AGIs over 200k)
Averages for the 2012 tax year for zip code 60565, filed in 2013:
Average Adjusted Gross Income (AGI) in 2012: $111,688 (Individual Income Tax Returns)
Here:
$111,688
State:
$68,058
Salary/wage: $98,483 (reported on 87.6% of returns)
Here:
$98,483
State:
$55,396
(% of AGI for various income ranges: 78.9% for AGIs below $25k, 76.4% for AGIs $25k-50k, 76.7% for AGIs $50k-75k, 74.0% for AGIs $75k-100k, 82.3% for AGIs $100k-200k, 74.5% for AGIs over 200k)
Taxable interest for individuals: $1,435 (reported on 49.1% of returns)
This zip code:
$1,435
Illinois:
$1,969
(% of AGI for various income ranges: 1.5% for AGIs below $25k, 1.0% for AGIs $25k-50k, 0.8% for AGIs $50k-75k, 0.7% for AGIs $75k-100k, 0.5% for AGIs $100k-200k, 0.6% for AGIs over 200k)
Ordinary dividends: $6,057 (reported on 41.7% of returns)
Here:
$6,057
State:
$7,786
(% of AGI for various income ranges: 3.4% for AGIs below $25k, 2.1% for AGIs $25k-50k, 2.0% for AGIs $50k-75k, 2.0% for AGIs $75k-100k, 1.6% for AGIs $100k-200k, 2.7% for AGIs over 200k)
Net capital gain/loss in AGI: +$7,924 (reported on 34.1% of returns)
Here:
+$7,924
State:
+$22,183
(% of AGI for various income ranges: 0.7% for AGIs $25k-50k, 0.5% for AGIs $50k-75k, 0.7% for AGIs $75k-100k, 0.8% for AGIs $100k-200k, 4.3% for AGIs over 200k)
Profit/loss from business: +$19,484 (reported on 15.3% of returns)
Here:
+$19,484
State:
+$12,903
(% of AGI for various income ranges: 8.0% for AGIs below $25k, 4.8% for AGIs $25k-50k, 3.1% for AGIs $50k-75k, 2.8% for AGIs $75k-100k, 2.6% for AGIs $100k-200k, 2.2% for AGIs over 200k)
Taxable individual retirement arrangement distribution: $24,906 (reported on 12.2% of returns)
60565:
$24,906
Illinois:
$17,929
(% of AGI for various income ranges: 3.9% for AGIs below $25k, 4.0% for AGIs $25k-50k, 3.9% for AGIs $50k-75k, 4.9% for AGIs $75k-100k, 3.0% for AGIs $100k-200k, 1.9% for AGIs over 200k)
Self-employment retirement plans: $21,435 (reported on 1.6% of returns)
60565:
$21,435
Illinois:
$24,666
(% of AGI for various income ranges: 0.4% for AGIs below $25k, 0.1% for AGIs $75k-100k, 0.2% for AGIs $100k-200k, 0.4% for AGIs over 200k)
Total itemized deductions: $30,957 (18% of AGI, reported on 57.1% of returns)
Here:
$30,957
State:
$26,433
Here:
17.7% of AGI
State:
19.2% of AGI
(% of AGI for various income ranges: 16.3% for AGIs below $25k, 17.3% for AGIs $25k-50k, 19.5% for AGIs $50k-75k, 21.0% for AGIs $75k-100k, 18.5% for AGIs $100k-200k, 12.7% for AGIs over 200k)
Charity contributions: $4,170 (reported on 51.6% of returns)
Here:
$4,170
State:
$4,525
(% of AGI for various income ranges: 0.9% for AGIs below $25k, 1.4% for AGIs $25k-50k, 1.7% for AGIs $50k-75k, 2.1% for AGIs $75k-100k, 2.0% for AGIs $100k-200k, 2.0% for AGIs over 200k)
Taxes paid: $16,086 (reported on 57.0% of returns)
60565:
$16,086
State:
$11,968
(% of AGI for various income ranges: 5.4% for AGIs below $25k, 6.7% for AGIs $25k-50k, 8.4% for AGIs $50k-75k, 9.7% for AGIs $75k-100k, 9.5% for AGIs $100k-200k, 7.4% for AGIs over 200k)
Earned income credit: $1,892 (reported on 5.8% of returns)
Here:
$1,892
State:
$2,349
(% of AGI for various income ranges: 3.0% for AGIs below $25k, 0.6% for AGIs $25k-50k)
Percentage of individuals using paid preparers for their 2012 taxes: 47.8%
Here:
48%
State:
57%
(% for various income ranges: 41.4% for AGIs below $25k, 46.7% for AGIs $25k-50k, 49.2% for AGIs $50k-75k, 50.0% for AGIs $75k-100k, 48.1% for AGIs $100k-200k, 59.9% for AGIs over 200k)
Averages for the 2004 tax year for zip code 60565, filed in 2005:
Average Adjusted Gross Income (AGI) in 2004: $88,077 (Individual Income Tax Returns)
Here:
$88,077
State:
$54,625
Salary/wage: $81,062 (reported on 89.0% of returns)
Here:
$81,062
State:
$46,811
(% of AGI for various income ranges: 161.6% for AGIs below $10k, 74.4% for AGIs $10k-25k, 81.6% for AGIs $25k-50k, 81.4% for AGIs $50k-75k, 84.9% for AGIs $75k-100k, 81.0% for AGIs over 100k)
Taxable interest for individuals: $1,451 (reported on 66.3% of returns)
This zip code:
$1,451
Illinois:
$2,101
(% of AGI for various income ranges: 8.7% for AGIs below $10k, 3.3% for AGIs $10k-25k, 1.7% for AGIs $25k-50k, 1.7% for AGIs $50k-75k, 1.2% for AGIs $75k-100k, 0.9% for AGIs over 100k)
Taxable dividends: $2,719 (reported on 48.4% of returns)
Here:
$2,719
State:
$4,306
(% of AGI for various income ranges: 9.6% for AGIs below $10k, 2.9% for AGIs $10k-25k, 1.6% for AGIs $25k-50k, 1.4% for AGIs $50k-75k, 1.2% for AGIs $75k-100k, 1.4% for AGIs over 100k)
Net capital gain/loss: +$7,892 (reported on 40.2% of returns)
Here:
+$7,892
State:
+$17,321
(% of AGI for various income ranges: -2.1% for AGIs below $10k, 0.5% for AGIs $10k-25k, 0.5% for AGIs $25k-50k, 0.4% for AGIs $50k-75k, 0.7% for AGIs $75k-100k, 4.7% for AGIs over 100k)
Profit/loss from business: +$17,041 (reported on 14.6% of returns)
Here:
+$17,041
State:
+$11,771
(% of AGI for various income ranges: -7.4% for AGIs below $10k, 8.0% for AGIs $10k-25k, 3.7% for AGIs $25k-50k, 3.4% for AGIs $50k-75k, 2.8% for AGIs $75k-100k, 2.7% for AGIs over 100k)
IRA payment deduction: $3,385 (reported on 4.2% of returns)
60565:
$3,385
Illinois:
$3,087
(% of AGI for various income ranges: 0.5% for AGIs below $10k, 0.4% for AGIs $10k-25k, 0.5% for AGIs $25k-50k, 0.4% for AGIs $50k-75k, 0.3% for AGIs $75k-100k, 0.1% for AGIs over 100k)
Self-employed pension: $15,682 (reported on 1.9% of returns)
Here:
$15,682
Illinois:
$16,965
(% of AGI for various income ranges: 0.1% for AGIs $25k-50k, 0.2% for AGIs $50k-75k, 0.2% for AGIs $75k-100k, 0.4% for AGIs over 100k)
Total itemized deductions: $23,733 (18% of AGI, reported on 58.6% of returns)
Here:
$23,733
State:
$20,239
Here:
17.5% of AGI
State:
19.5% of AGI
(% of AGI for various income ranges: 21.7% for AGIs below $10k, 19.5% for AGIs $10k-25k, 20.3% for AGIs $25k-50k, 22.2% for AGIs $50k-75k, 21.7% for AGIs $75k-100k, 13.8% for AGIs over 100k)
Charity contributions deductions: $3,612 (3% of AGI, reported on 54.9% of returns)
Here:
$3,612
State:
$3,719
Here:
2.6% of AGI
State:
3.4% of AGI
(% of AGI for various income ranges: 0.9% for AGIs below $10k, 1.3% for AGIs $10k-25k, 2.1% for AGIs $25k-50k, 2.3% for AGIs $50k-75k, 2.6% for AGIs $75k-100k, 2.2% for AGIs over 100k)
Total tax: $17,425 (reported on 80.8% of returns)
60565:
$17,425
State:
$9,882
(% of AGI for various income ranges: 4.1% for AGIs below $10k, 5.1% for AGIs $10k-25k, 7.4% for AGIs $25k-50k, 8.6% for AGIs $50k-75k, 9.1% for AGIs $75k-100k, 18.8% for AGIs over 100k)
Earned income credit: $1,456 (reported on 3.6% of returns)
Here:
$1,456
State:
$1,788
Percentage of individuals using paid preparers for their 2004 taxes: 45.9%
Here:
46%
State:
61%
(% for various income ranges: 36.4% for AGIs below $10k, 47.7% for AGIs $10k-25k, 49.8% for AGIs $25k-50k, 50.3% for AGIs $50k-75k, 44.6% for AGIs $75k-100k, 49.9% for AGIs over 100k)
Likely homosexual households (counted as self-reported same-sex unmarried-partner households)
Lesbian couples: 0.0% of all households
Gay men: 0.1% of all households
Household received Food Stamps/SNAP in the past 12 months: 474 Household did not receive Food Stamps/SNAP in the past 12 months: 13,228
Women who had a birth in the past 12 months: 356 (329 now married, 26 unmarried) Women who did not have a birth in the past 12 months: 8,310 (4,221 now married, 4,054 unmarried)
Housing units in zip code 60565 with a mortgage: 8,555 (887 second mortgage, 29 home equity loan, 799 both second mortgage and home equity loan) Houses without a mortgage: 253
Median monthly owner costs for units with a mortgage: $2,654 Median monthly owner costs for units without a mortgage: $1,222
Residents with income below the poverty level in 2022:
This zip code:
3.3%
Whole state:
11.9%
Residents with income below 50% of the poverty level in 2022:
This zip code:
1.9%
Whole state:
5.7%
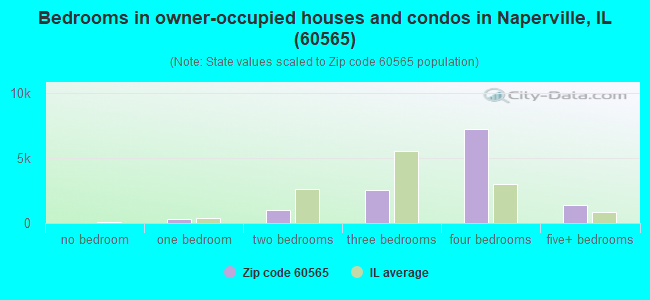
Median number of rooms in houses and condos:
Here:
8.3
State:
6.4
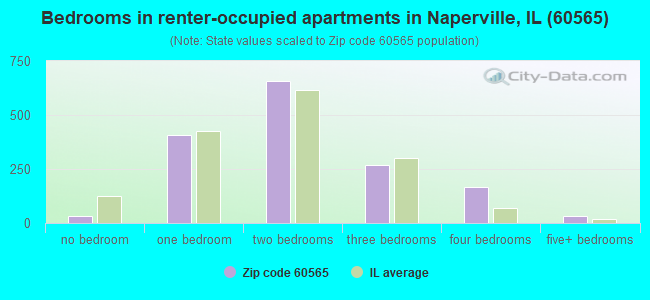
Median number of rooms in apartments:
Here:
4.3
State:
4.1
Notable locations in this zip code not listed on our city pages
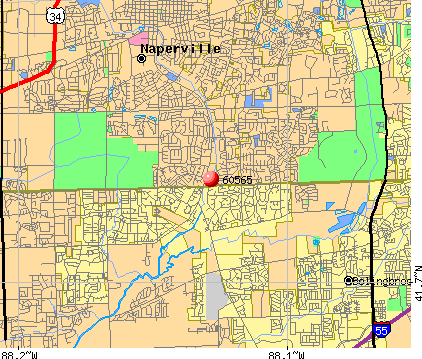
Notable locations in zip code 60565: Woodridge-Greene Valley Wastewater Treatment Plant (A), Naperville Fire Department Station 2 (B), Naperville Fire Department Station 8 (C). Display/hide their locations on the map
Churches in zip code 60565 include: Church In Naperville (A), Bethany Church (B), Good Shepherd Lutheran Church (C), Naperville Congregational Church (D). Display/hide their locations on the map
Parks in zip code 60565 include: Arbor Way Park (1), Campus Green Park (2), Eagle Park (3), Fender County Forest Preserve (4), Hunter Woods Park (5), Ranchview Park (6), Spring Field Park (7), Westglen Park (8), Winding Creek Park (9). Display/hide their locations on the map
In group quarters: 163 (-1 institutionalized population)
Size of family households: 4,487 2-persons, 2,688 3-persons, 2,715 4-persons, 916 5-persons, 291 6-persons, 74 7-or-more-persons
Size of nonfamily households: 2,180 1-person, 415 2-persons, 15 5-persons
7,897 married couples with children.
1,102 single-parent households (235 men, 867 women).
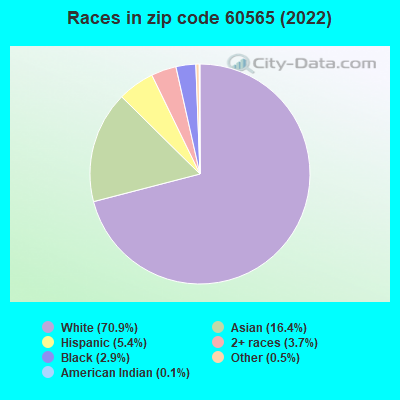
76.4% of residents of 60565 zip code speak English at home.
3.3% of residents speak Spanish at home (76% very well, 20% well, 3% not well).
10.4% of residents speak other Indo-European language at home (81% very well, 15% well, 4% not well).
8.5% of residents speak Asian or Pacific Island language at home (65% very well, 24% well, 11% not well).
1.4% of residents speak other language at home (91% very well, 9% well).
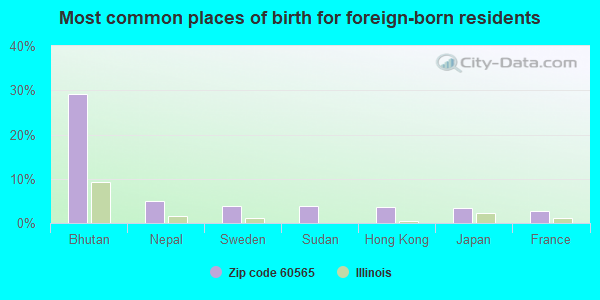
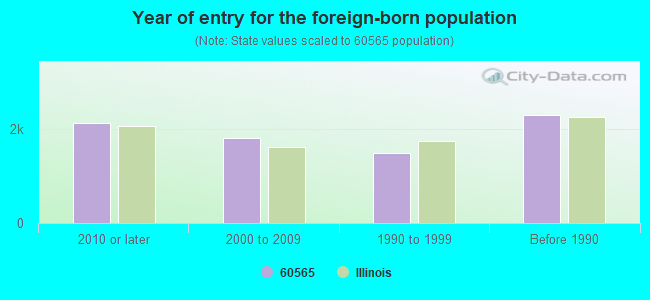
Foreign born population: 7,192 (18.7%) (65.1% of them are naturalized citizens)
Major facilities with environmental interests located in this zip code:
PHOENIX CLOSURES (1899 HIGH GROVE LANE in NAPERVILLE, IL)
STATE MASTER (Illinois EPA Project) - SOLID WASTE PROGRAM, HAZARDOUS WASTE PROGRAM STATE MASTER (Illinois EPA Project) - National Pollutant Discharge Elimination System Permit National Pollutant Discharge Elimination System NON-MAJOR (Tracking pollutant discharge elimination systems) - permit Organizations: PHOENIX CLOSURES, INCORPORATED (CONTACT/OWNER)
MOBIL OIL CORP (1576 SOUTH WASHINGTON ST. in NAPERVILLE, IL)
STATE MASTER (Illinois EPA Project) - SOLID WASTE PROGRAM, AIR PROGRAM, HAZARDOUS WASTE PROGRAM AIR MINOR (AIRS/AFS) Small Quantity Generators, between 100 kg and 1000 kg of hazardous waste/month (Resource Conservation and Recovery Act (tracking hazardous waste)) - notification Business SIC classification: GASOLINE SERVICE STATIONS Organizations: MOBIL OIL CORPORATION (CONTACT/OWNER)
Alternative names: EXXON MOBIL OIL CORPORATION STA 05 BEN, MOBIL OIL CORP SS BEN
HEALTHY CLEANERS (2035 S WASHINGTON ST in NAPERVILLE, IL)
STATE MASTER (Illinois EPA Project) - AIR PROGRAM AIR MINOR (AIRS/AFS) CRITERIA AND HAZARDOUS AIR POLLUTANT INVENTORY (Inventory of air pollution sources) Business SIC classification: DRYCLEANING PLANTS, EXCEPT RUG CLEANING
CIENEGA INC (LIBERTY CLEANERS) (1807 S WASHINGTON ST STE 117 in NAPERVILLE, IL)
STATE MASTER (Illinois EPA Project) - AIR PROGRAM AIR MINOR (AIRS/AFS) CRITERIA AND HAZARDOUS AIR POLLUTANT INVENTORY (Inventory of air pollution sources) Business SIC classification: DRYCLEANING PLANTS, EXCEPT RUG CLEANING
AMOCO 15908 (1120 W 75TH ST in NAPERVILLE, IL)
STATE MASTER (Illinois EPA Project) - HAZARDOUS WASTE PROGRAM Small Quantity Generators, between 100 kg and 1000 kg of hazardous waste/month (Resource Conservation and Recovery Act (tracking hazardous waste)) - notification Organizations: AMOCO OIL CO (CONTACT/OWNER)
AMOCO OIL CO 15926 (2888 BOOK RD in NAPERVILLE, IL)
STATE MASTER (Illinois EPA Project) - HAZARDOUS WASTE PROGRAM Small Quantity Generators, between 100 kg and 1000 kg of hazardous waste/month (Resource Conservation and Recovery Act (tracking hazardous waste)) - notification Alternative names: AMOCO OIL CO #15926
MODAFF CLEANERS (537 W 87TH ST in NAPERVILLE, IL)
STATE MASTER (Illinois EPA Project) - HAZARDOUS WASTE PROGRAM Small Quantity Generators, between 100 kg and 1000 kg of hazardous waste/month (Resource Conservation and Recovery Act (tracking hazardous waste)) - notification Organizations: KIM YOUNG (CONTACT/OWNER)
NAPER VALUE (811 N WASHINGTON in NAPERVILLE, IL)
STATE MASTER (Illinois EPA Project) - SOLID WASTE PROGRAM, HAZARDOUS WASTE PROGRAM Small Quantity Generators, between 100 kg and 1000 kg of hazardous waste/month (Resource Conservation and Recovery Act (tracking hazardous waste)) - notification Organizations: BIALBO BILL (CONTACT/OWNER)
Alternative names: NAPER VALUE CLEANERS
CONVENIENT FOOD MART/MARATHON (501 W 87TH ST in NAPERVILLE, IL)
STATE MASTER (Illinois EPA Project) - SOLID WASTE PROGRAM, HAZARDOUS WASTE PROGRAM Small Quantity Generators, between 100 kg and 1000 kg of hazardous waste/month (Resource Conservation and Recovery Act (tracking hazardous waste)) - notification Organizations: CONVENIENT FOOD MART, INC (CONTACT/OWNER)
RANCH VIEW ELEMENTARY SCHOOL (1651 RANCHVIEW DR in NAPERVILLE, IL)
(Geographic Names Information System) (National Center for Education Statistics) - STATE ID-1902220302015 Organizations: NAPERVILLE C U DIST 203 (SCHOOL DISTRICT)
MADISON JR HIGH SCHOOL (1000 RIVER OAK DR in NAPERVILLE, IL)
(National Center for Education Statistics) - STATE ID-1902220301012 Organizations: NAPERVILLE C U DIST 203 (SCHOOL DISTRICT)
MAPLEBROOK ELEM SCHOOL (1630 WARBLER DR in NAPERVILLE, IL)
(National Center for Education Statistics) - STATE ID-1902220302008 Organizations: NAPERVILLE C U DIST 203 (SCHOOL DISTRICT)
MEADOW GLENS ELEMENTARY SCHOOL (1150 MUIRHEAD in NAPERVILLE, IL)
(National Center for Education Statistics) - STATE ID-1902220302017 Organizations: NAPERVILLE C U DIST 203 (SCHOOL DISTRICT)
Housing units lacking complete plumbing facilities: 0.3% Housing units lacking complete kitchen facilities: 0.3%
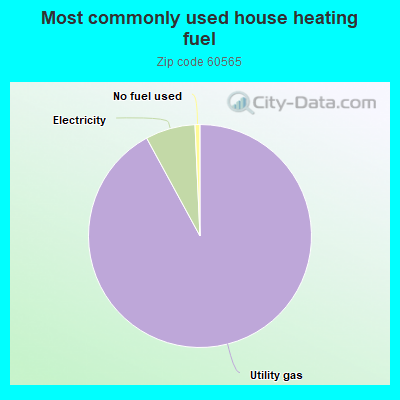
91.7%Utility gas
7.2%Electricity
0.7%No fuel used
Population in 1990: 32,693. Population change in the 1990s: +7,947 (+24.3%).
Place of birth for U.S.-born residents:
This state: 22,836
Northeast: 1,558
Midwest: 4,035
South: 1,217
West: 1,150
62% of the 60565 zip code residents lived in the same house 5 years ago. Out of people who lived in different houses, 36% lived in this county. Out of people who lived in different counties, 50% lived in Illinois.
91% of the 60565 zip code residents lived in the same house 1 year ago. Out of people who lived in different houses, 38% moved from this county. Out of people who lived in different houses, 50% moved from different county within same state. Out of people who lived in different houses, 11% moved from different state. Out of people who lived in different houses, 4% moved from abroad.
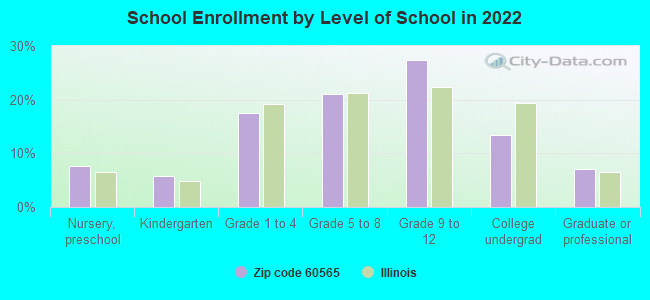
Private vs. public school enrollment:
Students in private schools in grades 1 to 8 (elementary and middle school): 445
Here:
11.3%
Illinois:
13.3%
Students in private schools in grades 9 to 12 (high school): 123
Here:
4.4%
Illinois:
9.9%
Students in private undergraduate colleges: 330
Here:
23.9%
Illinois:
27.4%
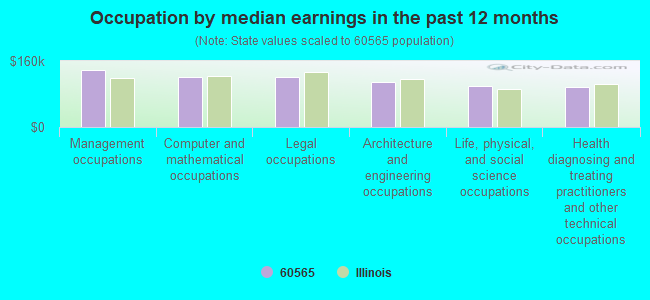
Occupation by median earnings in the past 12 months ($)
138,514Management occupations
121,191Computer and mathematical occupations
120,065Legal occupations
109,347Architecture and engineering occupations
99,880Life, physical, and social science occupations
97,526Health diagnosing and treating practitioners and other technical occupations
Companies with federal contracts located in this zip code (NAPERVILLE, IL):
SSS RESEARCH INC (1413 DURNESS CT; small business) : $1,177,123 in 6 contractsfrom 2004 to 2006
Contracts for Other Defense -- Applied Research and Exploratory Development (R&D), Subsistence -- Management and Support (R&D) by Air Force, National Geospatial-Intelligence Agency, Department of Defense Signed by year:2000: $0; 2001: $0; 2002: $0; 2003: $0; 2004: $416,030; 2005: $591,349; 2006: $169,744.
Biggest contracts:
$375,000 with Air Force for Other Defense -- Applied Research and Exploratory Development (R&D). Signed on 2005-05-20. Completion date: 2007-05-18.
$316,030 with National Geospatial-Intelligence Agency for Subsistence -- Management and Support (R&D). Signed on 2004-05-05. Completion date: 2005-04-26.
$169,744 with Air Force for Other Defense -- Applied Research and Exploratory Development (R&D). Signed on 2006-04-18. Completion date: 2007-05-18.
$131,349, same as above.Signed on 2005-09-30. Completion date: 2007-05-18.
PETER CUCUZ (931 WEST 75TH ST., SUITE 137; small business)
$3,800 with Office of the Assistant Secretary for Administration and Management for . Signed on 2003-10-24. Effective on 2003-11-03. Completion date: 2003-11-07.
OAK HILL PUBLISHING COMPANY (931 WEST 75TH STREET; small business) : $3,275 in 2 contractsfrom 2004 to 2005
$2,850 with Air Force for Books and Pamphlets. Signed on 2005-11-09. Completion date: 2005-11-18.
$425 with Navy for Books and Pamphlets. Taking place in VA. Signed on 2004-04-05. Completion date: 2004-04-05.
AMERICAN EAGLE COMPUTER PRODUC (2404 INDIAN GRASS DR; small business)
$3,049 with Army for Office Information System Equipment. Signed on 2005-04-08. Completion date: 2004-11-30.
Top industries in this zip code by the number of employees in 2005:
Management of Companies and Enterprises: Corporate, Subsidiary, and Regional Managing Offices (over 1000 employees: 1 establishment)
Other Services (except Public Administration): Beauty Salons (20-49: 5, 10-19: 1, 5-9: 1, 1-4: 7)
Administrative and Support and Waste Management and Remediation Services: Temporary Help Services (100-249: 1, 10-19: 1, 1-4: 1)
Professional, Scientific, and Technical Services: Marketing Research and Public Opinion Polling (100-249: 1, 1-4: 1)
Health Care and Social Assistance: Nursing Care Facilities (100-249: 1)
2002 - 2018 National Fire Incident Reporting System (NFIRS) incidents
According to the data from the years 2002 - 2018 the average number of fires per year is 43. The highest number of fires - 76 took place in 2003, and the least - 1 in 2007. The data has a declining trend.
When looking into fire subcategories, the most incidents belonged to: Outside Fires (44.5%), and Structure Fires (42.6%).
Fire incident types reported to NFIRS in Zip Code 60565
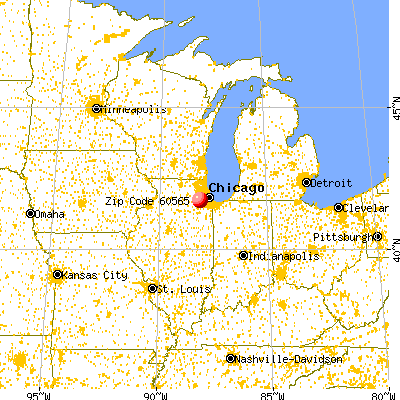


 Nearest zip codes: 60540, 60440, 60490, 60532, 60564, 60517.
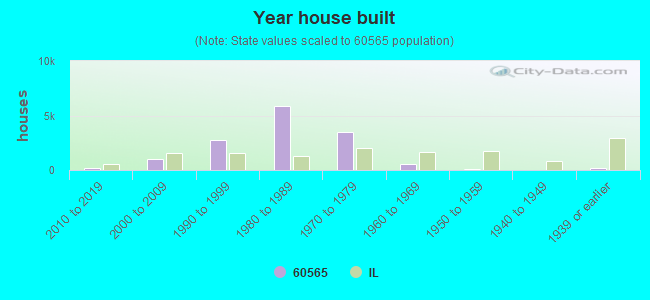


 According to the data from the years 2002 - 2018 the average number of fires per year is 43. The highest number of fires - 76 took place in 2003, and the least - 1 in 2007. The data has a declining trend.
 When looking into fire subcategories, the most incidents belonged to: Outside Fires (44.5%), and Structure Fires (42.6%).