Estimated zip code population in 2022: 1,436 Zip code population in 2010: 1,617 Zip code population in 2000: 1,498
Houses and condos: 691 Renter-occupied apartments: 86
% of renters here:
13%
State:
33%
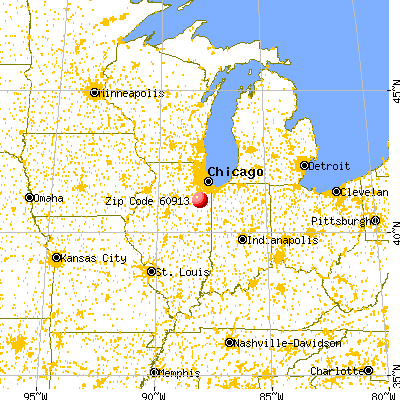
March 2022 cost of living index in zip code 60913: 92.9 (less than average, U.S. average is 100)
Land area: 45.9 sq. mi. Water area: 0.0 sq. mi.
Population density: 31 people per square mile
(very low).
OSM Map
General Map
Google Map
MSN Map
OSM Map
General Map
Google Map
MSN Map
OSM Map
General Map
Google Map
MSN Map
OSM Map
General Map
Google Map
MSN Map
Please wait while loading the map...
Real estate property taxes paid for housing units in 2022:
This zip code:
1.8% ($4,337)
Illinois:
2.0% ($4,912)
Median real estate property taxes paid for housing units with mortgages in 2022: $4,186 (1.9%) Median real estate property taxes paid for housing units with no mortgage in 2022: $4,453 (1.7%)
Business Search- 14 Million verified businesses
Males: 675
(47.0%)
Females: 761
(53.0%)
For population 25 years and over in 60913:
High school or higher: 93.4%
Bachelor's degree or higher: 21.6%
Graduate or professional degree: 3.6%
Unemployed: 3.3%
Mean travel time to work (commute): 24.5 minutes
For population 15 years and over in 60913:
Never married: 17.5%
Now married: 66.1%
Separated: 2.7%
Widowed: 5.3%
Divorced: 8.4%
Zip code 60913 compared to state average:
Black race population percentage significantly below state average.
Hispanic race population percentage significantly below state average.
Median age significantly above state average.
Foreign-born population percentage significantly below state average.
Renting percentage significantly below state average.
Length of stay since moving in significantly above state average.
Averages for the 2020 tax year for zip code 60913, filed in 2021:
Average Adjusted Gross Income (AGI) in 2020: $79,219 (Individual Income Tax Returns)
Here:
$79,219
State:
$82,626
Salary/wage: $66,914 (reported on 80.8% of returns)
Here:
$66,914
State:
$66,640
(% of AGI for various income ranges: 1126.7% for AGIs below $25k, 3403.0% for AGIs $25k-50k, 6625.0% for AGIs $50k-75k, 9565.0% for AGIs $75k-100k, 14230.8% for AGIs $100k-200k)
Taxable interest for individuals: $940 (reported on 41.1% of returns)
This zip code:
$940
Illinois:
$2,376
(% of AGI for various income ranges: 20.8% for AGIs below $25k, 21.0% for AGIs $25k-50k, 37.5% for AGIs $50k-75k, 146.7% for AGIs $75k-100k, 98.3% for AGIs $100k-200k)
Ordinary dividends: $3,753 (reported on 23.3% of returns)
Here:
$3,753
State:
$9,061
(% of AGI for various income ranges: 49.2% for AGIs below $25k, 27.5% for AGIs $50k-75k, 63.3% for AGIs $75k-100k, 432.5% for AGIs $100k-200k)
Net capital gain/loss in AGI: +$8,178 (reported on 24.7% of returns)
Here:
+$8,178
State:
+$31,684
(% of AGI for various income ranges: 6.7% for AGIs below $25k, 98.0% for AGIs $25k-50k, 58.3% for AGIs $75k-100k, 1109.2% for AGIs $100k-200k)
Profit/loss from business: +$5,900 (reported on 13.7% of returns)
Here:
+$5,900
State:
+$12,175
(% of AGI for various income ranges: 212.5% for AGIs below $25k, 221.2% for AGIs $50k-75k, 131.7% for AGIs $100k-200k)
Taxable individual retirement arrangement distribution: $16,445 (reported on 15.1% of returns)
60913:
$16,445
Illinois:
$21,613
(% of AGI for various income ranges: 344.0% for AGIs $25k-50k, 523.3% for AGIs $75k-100k, 959.2% for AGIs $100k-200k)
Total itemized deductions: $30,500 (reported on 5.5% of returns)
Here:
$30,500
State:
$34,948
(% of AGI for various income ranges: 525.0% for AGIs $25k-50k, 579.2% for AGIs $100k-200k)
Charity contributions: $6,767 (reported on 4.1% of returns)
Here:
$6,767
State:
$13,122
(% of AGI for various income ranges: 338.3% for AGIs $75k-100k)
Taxes paid: $8,900 (reported on 5.5% of returns)
60913:
$8,900
State:
$8,563
(% of AGI for various income ranges: 149.0% for AGIs $25k-50k, 172.5% for AGIs $100k-200k)
Earned income credit: $2,083 (reported on 8.2% of returns)
Here:
$2,083
State:
$2,311
(% of AGI for various income ranges: 104.2% for AGIs below $25k)
Percentage of individuals using paid preparers for their 2020 taxes: 94.5%
Here:
95%
State:
93%
(% for various income ranges: 88.9% for AGIs below $25k, 92.9% for AGIs $25k-50k, 100.0% for AGIs $50k-75k, 90.0% for AGIs $75k-100k, 100.0% for AGIs $100k-200k, 100.0% for AGIs over 200k)
Averages for the 2012 tax year for zip code 60913, filed in 2013:
Average Adjusted Gross Income (AGI) in 2012: $59,096 (Individual Income Tax Returns)
Here:
$59,096
State:
$68,058
Salary/wage: $48,552 (reported on 82.3% of returns)
Here:
$48,552
State:
$55,396
(% of AGI for various income ranges: 66.3% for AGIs below $25k, 69.5% for AGIs $25k-50k, 67.4% for AGIs $50k-75k, 70.0% for AGIs $75k-100k, 66.3% for AGIs $100k-200k)
Taxable interest for individuals: $711 (reported on 45.6% of returns)
This zip code:
$711
Illinois:
$1,969
(% of AGI for various income ranges: 0.5% for AGIs below $25k, 0.9% for AGIs $25k-50k, 0.6% for AGIs $50k-75k, 0.4% for AGIs $75k-100k, 0.5% for AGIs $100k-200k)
Ordinary dividends: $2,595 (reported on 26.6% of returns)
Here:
$2,595
State:
$7,786
(% of AGI for various income ranges: 0.6% for AGIs below $25k, 1.0% for AGIs $25k-50k, 1.9% for AGIs $50k-75k, 0.4% for AGIs $75k-100k, 1.3% for AGIs $100k-200k)
Net capital gain/loss in AGI: +$1,515 (reported on 16.5% of returns)
Here:
+$1,515
State:
+$22,183
(% of AGI for various income ranges: 0.5% for AGIs below $25k, 0.6% for AGIs $50k-75k, 0.6% for AGIs $100k-200k)
Profit/loss from business: +$7,267 (reported on 15.2% of returns)
Here:
+$7,267
State:
+$12,903
(% of AGI for various income ranges: 7.4% for AGIs below $25k, 3.6% for AGIs $25k-50k, 2.4% for AGIs $50k-75k, 1.2% for AGIs $100k-200k)
Taxable individual retirement arrangement distribution: $13,000 (reported on 12.7% of returns)
60913:
$13,000
Illinois:
$17,929
(% of AGI for various income ranges: 5.7% for AGIs below $25k, 5.2% for AGIs $25k-50k, 9.3% for AGIs $75k-100k)
Total itemized deductions: $20,433 (20% of AGI, reported on 34.2% of returns)
Here:
$20,433
State:
$26,433
Here:
20.3% of AGI
State:
19.2% of AGI
(% of AGI for various income ranges: 14.1% for AGIs $25k-50k, 13.3% for AGIs $50k-75k, 10.2% for AGIs $75k-100k, 13.0% for AGIs $100k-200k)
Charity contributions: $3,078 (reported on 29.1% of returns)
Here:
$3,078
State:
$4,525
(% of AGI for various income ranges: 0.7% for AGIs $25k-50k, 1.2% for AGIs $50k-75k, 0.9% for AGIs $75k-100k, 2.3% for AGIs $100k-200k)
Taxes paid: $8,315 (reported on 34.2% of returns)
60913:
$8,315
State:
$11,968
(% of AGI for various income ranges: 4.2% for AGIs $25k-50k, 4.4% for AGIs $50k-75k, 4.3% for AGIs $75k-100k, 6.1% for AGIs $100k-200k)
Earned income credit: $1,811 (reported on 11.4% of returns)
Here:
$1,811
State:
$2,349
(% of AGI for various income ranges: 3.9% for AGIs below $25k, 0.8% for AGIs $25k-50k)
Percentage of individuals using paid preparers for their 2012 taxes: 72.2%
Here:
72%
State:
57%
(% for various income ranges: 61.5% for AGIs below $25k, 68.8% for AGIs $25k-50k, 78.6% for AGIs $50k-75k, 80.0% for AGIs $75k-100k, 84.6% for AGIs $100k-200k)
Averages for the 2004 tax year for zip code 60913, filed in 2005:
Average Adjusted Gross Income (AGI) in 2004: $45,178 (Individual Income Tax Returns)
Here:
$45,178
State:
$54,625
Salary/wage: $40,218 (reported on 83.0% of returns)
Here:
$40,218
State:
$46,811
(% of AGI for various income ranges: 102.3% for AGIs below $10k, 63.0% for AGIs $10k-25k, 75.7% for AGIs $25k-50k, 79.1% for AGIs $50k-75k, 87.3% for AGIs $75k-100k, 58.2% for AGIs over 100k)
Taxable interest for individuals: $1,461 (reported on 59.2% of returns)
This zip code:
$1,461
Illinois:
$2,101
(% of AGI for various income ranges: 6.2% for AGIs below $10k, 3.3% for AGIs $10k-25k, 2.1% for AGIs $25k-50k, 1.9% for AGIs $50k-75k, 0.6% for AGIs $75k-100k, 2.1% for AGIs over 100k)
Taxable dividends: $1,886 (reported on 26.6% of returns)
Here:
$1,886
State:
$4,306
(% of AGI for various income ranges: 3.3% for AGIs below $10k, 3.5% for AGIs $10k-25k, 0.8% for AGIs $25k-50k, 1.2% for AGIs $50k-75k, 0.3% for AGIs $75k-100k, 1.1% for AGIs over 100k)
Net capital gain/loss: +$9,885 (reported on 16.5% of returns)
Here:
+$9,885
State:
+$17,321
(% of AGI for various income ranges: 0.5% for AGIs $10k-25k, -0.4% for AGIs $25k-50k, 1.4% for AGIs $50k-75k, 0.4% for AGIs $75k-100k, 12.3% for AGIs over 100k)
Profit/loss from business: +$5,941 (reported on 14.9% of returns)
Here:
+$5,941
State:
+$11,771
(% of AGI for various income ranges: 3.7% for AGIs below $10k, 5.3% for AGIs $10k-25k, 2.6% for AGIs $25k-50k, -0.1% for AGIs $50k-75k, -0.2% for AGIs $75k-100k, 4.1% for AGIs over 100k)
Profit/loss from farming: +$545 (reported on 6.9% of returns)
Here:
+$545
State:
+$2,327
IRA payment deduction: $3,773 (reported on 2.8% of returns)
60913:
$3,773
Illinois:
$3,087
Total itemized deductions: $17,043 (25% of AGI, reported on 35.0% of returns)
Here:
$17,043
State:
$20,239
Here:
24.8% of AGI
State:
19.5% of AGI
(% of AGI for various income ranges: 20.9% for AGIs $10k-25k, 13.8% for AGIs $25k-50k, 13.2% for AGIs $50k-75k, 12.4% for AGIs $75k-100k, 12.0% for AGIs over 100k)
Charity contributions deductions: $2,547 (4% of AGI, reported on 29.3% of returns)
Here:
$2,547
State:
$3,719
Here:
3.6% of AGI
State:
3.4% of AGI
(% of AGI for various income ranges: 0.9% for AGIs $10k-25k, 1.0% for AGIs $25k-50k, 1.8% for AGIs $50k-75k, 2.1% for AGIs $75k-100k, 2.0% for AGIs over 100k)
Total tax: $5,792 (reported on 78.3% of returns)
60913:
$5,792
State:
$9,882
(% of AGI for various income ranges: 2.1% for AGIs below $10k, 4.5% for AGIs $10k-25k, 7.0% for AGIs $25k-50k, 8.6% for AGIs $50k-75k, 9.5% for AGIs $75k-100k, 16.1% for AGIs over 100k)
Earned income credit: $1,359 (reported on 8.1% of returns)
Here:
$1,359
State:
$1,788
Percentage of individuals using paid preparers for their 2004 taxes: 72.5%
Here:
72%
State:
61%
(% for various income ranges: 59.3% for AGIs below $10k, 71.1% for AGIs $10k-25k, 75.0% for AGIs $25k-50k, 77.6% for AGIs $50k-75k, 75.3% for AGIs $75k-100k, 83.3% for AGIs over 100k)
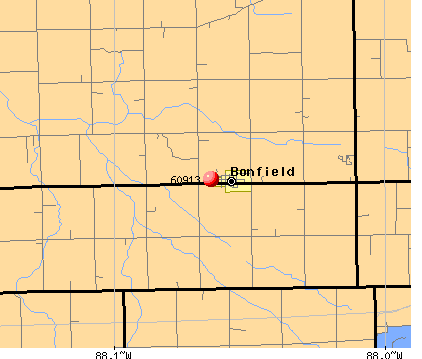
Cemeteries: Zion Lutheran Cemetery (1), Bonfield Cemetery (2), Maple Grove Cemetery (3), Beach Cemetery (4), Mount Hope Cemetery (5), Saint Peter and Paul Cemetery (6). Display/hide their locations on the map
Streams, rivers, and creeks: Bertrand Branch (A), North Bonfield Branch (B), Lehigh Raymond Run (C), South Bonfield Branch (D). Display/hide their locations on the map
Size of family households: 321 2-persons, 114 3-persons, 36 4-persons, 47 5-persons
Size of nonfamily households: 133 1-person, 9 2-persons
164 married couples with children.
25 single-parent households (25 women).
99.2% of residents of 60913 zip code speak English at home.
1.3% of residents speak Spanish at home (100% very well).
Foreign born population: 0 (0.0%)
:
0.0%
Whole state:
14.4%
38%German
10%English
8%American
8%French
5%European
3%Scandinavian
3%French Canadian
Facilities with environmental interests located in this zip code:
BONFIELD GRADE SCHOOL (522 E SMITH ST in BONFIELD, IL)
(Geographic Names Information System) (National Center for Education Statistics) - STATE ID-3204600202004 Organizations: HERSCHER COMM UNIT SCH DIST 2 (SCHOOL DISTRICT)
BONFIELD MOTORS (125 S WEST AVE in BONFIELD, IL)
STATE MASTER (Illinois EPA Project) - HAZARDOUS WASTE PROGRAM Conditionally Exempt Small Quantity Generators, less than 100 kg/month of hazardous waste (Resource Conservation and Recovery Act (tracking hazardous waste)) - notification Organizations: CHARTER GERALD (CONTACT/OWNER)
AT AND T LONG LINES BONFIELD (1 1 2MI S AND 4MI W in BONFIELD, IL)
(Resource Conservation and Recovery Act (tracking hazardous waste))
MCGREGORS COUNTRYVIEW COLLISION (72 N 9000 W RD in BONFIELD, IL)
Conditionally Exempt Small Quantity Generators, less than 100 kg/month of hazardous waste (Resource Conservation and Recovery Act (tracking hazardous waste)) - notification Organizations: MCGREGOR DEAN A (CONTACT/OWNER)
Housing units lacking complete plumbing facilities: 0.8%
56.9%Bottled, tank, or LP gas
33.4%Utility gas
7.0%Electricity
3.1%Fuel oil, kerosene, etc.
Population in 1990: 1,189. Population change in the 1990s: +309 (+26.0%).
Place of birth for U.S.-born residents:
This state: 1,345
Northeast: 4
Midwest: 41
South: 28
West: 9
74% of the 60913 zip code residents lived in the same house 5 years ago. Out of people who lived in different houses, 60% lived in this county. Out of people who lived in different counties, 50% lived in Illinois.
100% of the 60913 zip code residents lived in the same house 1 year ago. Out of people who lived in different houses, 100% moved from this county. Out of people who lived in different houses, 33% moved from different county within same state.
Private vs. public school enrollment:
Students in private schools in grades 1 to 8 (elementary and middle school): 8
Here:
7.4%
Illinois:
13.3%
Students in private schools in grades 9 to 12 (high school):
Here:
0.0%
Illinois:
9.9%
Students in private undergraduate colleges:
Here:
3.2%
Illinois:
27.4%
Occupation by median earnings in the past 12 months ($)
104,612Life, physical, and social science occupations
83,099Business and financial operations occupations
74,639Installation, maintenance, and repair occupations
70,797Health diagnosing and treating practitioners and other technical occupations
69,711Management occupations
68,365Law enforcement workers including supervisors
Companies with federal contracts located in this zip code:
BOUK, KEN P (236 N 9000 WEST RD in BONFIELD, IL; small business)
$3,805 with Army for Landscaping/Groundskeeping Services. Signed on 2004-09-30. Completion date: 2004-10-30.
Top industries in this zip code by the number of employees in 2005:
Other Services (except Public Administration): Other Personal and Household Goods Repair and Maintenance (20-49 employees: 1 establishment)
Administrative and Support and Waste Management and Remediation Services: Telephone Answering Services (10-19: 1)
Other Services (except Public Administration): Religious Organizations (5-9: 1, 1-4: 2)
Construction: Framing Contractors (5-9: 1)
Construction: Plumbing, Heating, and Air-Conditioning Contractors (1-4: 3)
Construction: New Single-Family Housing Construction (except Operative Builders) (1-4: 3)
Construction: Electrical Contractors (1-4: 2)
Real Estate and Rental and Leasing: Offices of Real Estate Appraisers (1-4: 2)
Other Services (except Public Administration): General Automotive Repair (1-4: 1)
Other Services (except Public Administration): Automotive Body, Paint, and Interior Repair and Maintenance (1-4: 1)
Fatal accident statistics in 2012:
Fatal accident count: 4
Vehicles involved in fatal accidents: 7
Fatal accidents caused by drunken drivers: 1
Fatalities: 4
Persons involved in fatal accidents: 13
Pedestrians involved in fatal accidents: 0
Home Mortgage Disclosure Act Aggregated Statistics For Year 2009 (Based on 2 partial tracts)
A) FHA, FSA/RHS & VA Home Purchase Loans
B) Conventional Home Purchase Loans
C) Refinancings
D) Home Improvement Loans
F) Non-occupant Loans on < 5 Family Dwellings (A B C & D)
G) Loans On Manufactured Home Dwelling (A B C & D)
Number
Average Value
Number
Average Value
Number
Average Value
Number
Average Value
Number
Average Value
Number
Average Value
LOANS ORIGINATED
5
$111,244
10
$126,457
61
$160,166
6
$48,575
5
$179,570
1
$10,680
APPLICATIONS APPROVED, NOT ACCEPTED
1
$62,990
1
$48,040
3
$237,897
1
$93,420
1
$5,340
0
$0
APPLICATIONS DENIED
0
$0
2
$179,090
19
$139,097
1
$91,810
1
$98,220
1
$61,390
APPLICATIONS WITHDRAWN
1
$57,120
1
$64,590
11
$173,048
0
$0
1
$66,190
0
$0
FILES CLOSED FOR INCOMPLETENESS
1
$101,960
0
$0
3
$124,553
1
$20,280
0
$0
0
$0
Aggregated Statistics For Year 2008 (Based on 2 partial tracts)
A) FHA, FSA/RHS & VA Home Purchase Loans
B) Conventional Home Purchase Loans
C) Refinancings
D) Home Improvement Loans
F) Non-occupant Loans on < 5 Family Dwellings (A B C & D)
G) Loans On Manufactured Home Dwelling (A B C & D)
Number
Average Value
Number
Average Value
Number
Average Value
Number
Average Value
Number
Average Value
Number
Average Value
LOANS ORIGINATED
2
$114,500
11
$156,064
35
$161,345
7
$61,921
2
$94,750
1
$79,000
APPLICATIONS APPROVED, NOT ACCEPTED
0
$0
0
$0
4
$142,258
1
$61,920
0
$0
0
$0
APPLICATIONS DENIED
1
$145,730
2
$62,190
12
$178,867
1
$8,010
2
$245,280
1
$72,060
APPLICATIONS WITHDRAWN
0
$0
2
$193,505
11
$157,859
1
$125,980
0
$0
0
$0
FILES CLOSED FOR INCOMPLETENESS
0
$0
1
$66,730
2
$103,825
0
$0
0
$0
0
$0
Aggregated Statistics For Year 2007 (Based on 2 partial tracts)
A) FHA, FSA/RHS & VA Home Purchase Loans
B) Conventional Home Purchase Loans
C) Refinancings
D) Home Improvement Loans
F) Non-occupant Loans on < 5 Family Dwellings (A B C & D)
G) Loans On Manufactured Home Dwelling (A B C & D)
Number
Average Value
Number
Average Value
Number
Average Value
Number
Average Value
Number
Average Value
Number
Average Value
LOANS ORIGINATED
2
$111,565
22
$144,077
41
$150,089
6
$58,007
5
$114,126
1
$53,380
APPLICATIONS APPROVED, NOT ACCEPTED
0
$0
0
$0
6
$168,413
2
$59,785
0
$0
0
$0
APPLICATIONS DENIED
1
$13,880
4
$59,118
19
$130,837
6
$46,885
0
$0
3
$70,997
APPLICATIONS WITHDRAWN
0
$0
2
$81,670
6
$165,300
0
$0
1
$40,040
0
$0
FILES CLOSED FOR INCOMPLETENESS
0
$0
1
$76,330
0
$0
0
$0
0
$0
0
$0
Aggregated Statistics For Year 2006 (Based on 2 partial tracts)
A) FHA, FSA/RHS & VA Home Purchase Loans
B) Conventional Home Purchase Loans
C) Refinancings
D) Home Improvement Loans
F) Non-occupant Loans on < 5 Family Dwellings (A B C & D)
G) Loans On Manufactured Home Dwelling (A B C & D)
Number
Average Value
Number
Average Value
Number
Average Value
Number
Average Value
Number
Average Value
Number
Average Value
LOANS ORIGINATED
3
$93,237
28
$136,596
33
$121,901
6
$49,020
2
$62,190
1
$20,280
APPLICATIONS APPROVED, NOT ACCEPTED
1
$45,370
5
$107,080
6
$101,688
0
$0
0
$0
1
$30,960
APPLICATIONS DENIED
1
$77,930
7
$135,357
17
$137,312
5
$47,722
1
$74,200
0
$0
APPLICATIONS WITHDRAWN
1
$57,120
2
$150,530
10
$144,233
1
$168,680
0
$0
0
$0
FILES CLOSED FOR INCOMPLETENESS
0
$0
1
$126,510
3
$153,557
0
$0
0
$0
0
$0
Aggregated Statistics For Year 2005 (Based on 2 partial tracts)
A) FHA, FSA/RHS & VA Home Purchase Loans
B) Conventional Home Purchase Loans
C) Refinancings
D) Home Improvement Loans
E) Loans on Dwellings For 5+ Families
F) Non-occupant Loans on < 5 Family Dwellings (A B C & D)
G) Loans On Manufactured Home Dwelling (A B C & D)
Number
Average Value
Number
Average Value
Number
Average Value
Number
Average Value
Number
Average Value
Number
Average Value
Number
Average Value
LOANS ORIGINATED
1
$93,950
23
$147,306
38
$139,870
5
$61,600
0
$0
3
$107,473
1
$32,030
APPLICATIONS APPROVED, NOT ACCEPTED
0
$0
1
$149,460
8
$125,644
1
$32,030
0
$0
0
$0
0
$0
APPLICATIONS DENIED
0
$0
4
$85,675
34
$127,672
4
$53,112
0
$0
1
$18,680
1
$36,830
APPLICATIONS WITHDRAWN
0
$0
1
$47,510
12
$124,242
1
$66,730
1
$888,780
0
$0
0
$0
FILES CLOSED FOR INCOMPLETENESS
0
$0
2
$105,960
9
$121,826
1
$10,680
0
$0
0
$0
0
$0
Aggregated Statistics For Year 2004 (Based on 2 partial tracts)
A) FHA, FSA/RHS & VA Home Purchase Loans
B) Conventional Home Purchase Loans
C) Refinancings
D) Home Improvement Loans
F) Non-occupant Loans on < 5 Family Dwellings (A B C & D)
G) Loans On Manufactured Home Dwelling (A B C & D)
Number
Average Value
Number
Average Value
Number
Average Value
Number
Average Value
Number
Average Value
Number
Average Value
LOANS ORIGINATED
3
$113,520
23
$134,773
46
$115,208
5
$28,504
4
$50,845
2
$64,325
APPLICATIONS APPROVED, NOT ACCEPTED
0
$0
4
$102,490
6
$111,475
1
$6,410
0
$0
1
$1,070
APPLICATIONS DENIED
0
$0
11
$96,569
31
$113,441
2
$16,550
2
$104,360
2
$64,055
APPLICATIONS WITHDRAWN
0
$0
4
$114,632
14
$126,358
1
$83,270
1
$50,180
0
$0
FILES CLOSED FOR INCOMPLETENESS
0
$0
1
$101,960
6
$208,715
0
$0
1
$54,980
0
$0
Aggregated Statistics For Year 2003 (Based on 2 partial tracts)
A) FHA, FSA/RHS & VA Home Purchase Loans
B) Conventional Home Purchase Loans
C) Refinancings
D) Home Improvement Loans
F) Non-occupant Loans on < 5 Family Dwellings (A B C & D)
Number
Average Value
Number
Average Value
Number
Average Value
Number
Average Value
Number
Average Value
LOANS ORIGINATED
2
$97,950
21
$119,368
106
$122,039
3
$51,780
6
$81,850
APPLICATIONS APPROVED, NOT ACCEPTED
0
$0
3
$81,670
10
$119,678
0
$0
0
$0
APPLICATIONS DENIED
1
$59,790
4
$71,930
28
$120,772
2
$8,005
1
$36,300
APPLICATIONS WITHDRAWN
1
$141,990
1
$330,960
11
$126,607
1
$65,120
0
$0
FILES CLOSED FOR INCOMPLETENESS
0
$0
0
$0
1
$176,150
1
$10,680
0
$0
Aggregated Statistics For Year 2002 (Based on 2 partial tracts)
A) FHA, FSA/RHS & VA Home Purchase Loans
B) Conventional Home Purchase Loans
C) Refinancings
D) Home Improvement Loans
F) Non-occupant Loans on < 5 Family Dwellings (A B C & D)
Number
Average Value
Number
Average Value
Number
Average Value
Number
Average Value
Number
Average Value
LOANS ORIGINATED
4
$90,612
14
$118,580
68
$105,245
5
$25,088
5
$99,608
APPLICATIONS APPROVED, NOT ACCEPTED
0
$0
3
$61,030
7
$112,860
1
$19,750
0
$0
APPLICATIONS DENIED
1
$56,050
1
$105,160
19
$95,269
3
$21,530
1
$67,260
APPLICATIONS WITHDRAWN
0
$0
3
$107,650
6
$111,387
1
$61,920
1
$21,350
FILES CLOSED FOR INCOMPLETENESS
0
$0
0
$0
6
$93,058
0
$0
0
$0
Aggregated Statistics For Year 2001 (Based on 2 partial tracts)
A) FHA, FSA/RHS & VA Home Purchase Loans
B) Conventional Home Purchase Loans
C) Refinancings
D) Home Improvement Loans
F) Non-occupant Loans on < 5 Family Dwellings (A B C & D)
Number
Average Value
Number
Average Value
Number
Average Value
Number
Average Value
Number
Average Value
LOANS ORIGINATED
3
$113,700
24
$93,037
65
$95,739
9
$24,496
7
$62,913
APPLICATIONS APPROVED, NOT ACCEPTED
1
$44,840
5
$98,006
7
$74,731
2
$38,700
1
$16,010
APPLICATIONS DENIED
0
$0
6
$62,722
23
$66,702
4
$18,682
1
$19,750
APPLICATIONS WITHDRAWN
1
$37,370
3
$82,917
8
$70,261
1
$13,350
1
$57,650
FILES CLOSED FOR INCOMPLETENESS
0
$0
1
$58,720
1
$75,800
0
$0
0
$0
Aggregated Statistics For Year 2000 (Based on 2 partial tracts)
A) FHA, FSA/RHS & VA Home Purchase Loans
B) Conventional Home Purchase Loans
C) Refinancings
D) Home Improvement Loans
E) Loans on Dwellings For 5+ Families
F) Non-occupant Loans on < 5 Family Dwellings (A B C & D)
Number
Average Value
Number
Average Value
Number
Average Value
Number
Average Value
Number
Average Value
Number
Average Value
LOANS ORIGINATED
1
$74,200
25
$95,358
22
$81,307
5
$27,650
1
$53,380
1
$63,520
APPLICATIONS APPROVED, NOT ACCEPTED
1
$67,790
2
$82,205
4
$102,490
4
$12,278
0
$0
0
$0
APPLICATIONS DENIED
1
$80,070
11
$64,784
14
$69,127
3
$11,210
0
$0
1
$42,700
APPLICATIONS WITHDRAWN
0
$0
3
$83,983
4
$101,690
1
$10,680
0
$0
0
$0
FILES CLOSED FOR INCOMPLETENESS
1
$89,680
1
$110,500
2
$89,145
0
$0
0
$0
0
$0
Aggregated Statistics For Year 1999 (Based on 1 partial tract)
A) FHA, FSA/RHS & VA Home Purchase Loans
B) Conventional Home Purchase Loans
C) Refinancings
D) Home Improvement Loans
F) Non-occupant Loans on < 5 Family Dwellings (A B C & D)
Detailed PMIC statistics for the following Tracts:0103.00
2002 - 2018 National Fire Incident Reporting System (NFIRS) incidents
According to the data from the years 2002 - 2018 the average number of fire incidents per year is 15. The highest number of reported fire incidents - 25 took place in 2003, and the least - 3 in 2018. The data has a declining trend.
When looking into fire subcategories, the most reports belonged to: Outside Fires (44.3%), and Structure Fires (43.9%).
Fire incident types reported to NFIRS in Zip Code 60913


 Nearest zip codes: 60969, 60941, 60935, 60481, 60917, 60961.


 According to the data from the years 2002 - 2018 the average number of fire incidents per year is 15. The highest number of reported fire incidents - 25 took place in 2003, and the least - 3 in 2018. The data has a declining trend.
 When looking into fire subcategories, the most reports belonged to: Outside Fires (44.3%), and Structure Fires (43.9%).