Estimated zip code population in 2022: 3,352 Zip code population in 2010: 3,369 Zip code population in 2000: 3,172
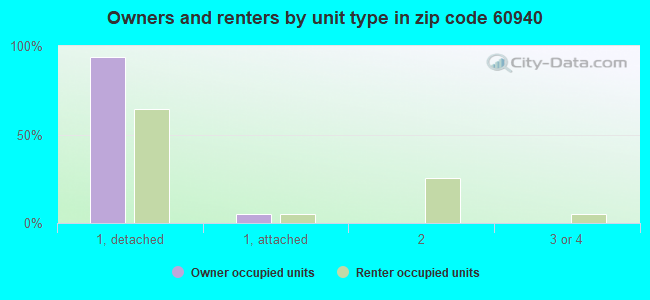
Houses and condos: 1,145 Renter-occupied apartments: 176
% of renters here:
16%
State:
33%
March 2022 cost of living index in zip code 60940: 94.0 (less than average, U.S. average is 100)
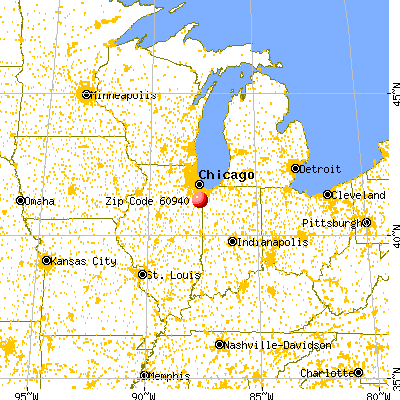
Land area: 75.6 sq. mi. Water area: 0.0 sq. mi.
Population density: 44 people per square mile
(very low).
OSM Map
General Map
Google Map
MSN Map
OSM Map
General Map
Google Map
MSN Map
OSM Map
General Map
Google Map
MSN Map
OSM Map
General Map
Google Map
MSN Map
Please wait while loading the map...
Real estate property taxes paid for housing units in 2022:
This zip code:
2.0% ($4,844)
Illinois:
2.0% ($4,912)
Median real estate property taxes paid for housing units with mortgages in 2022: $4,818 (2.0%) Median real estate property taxes paid for housing units with no mortgage in 2022: $4,927 (2.0%)
Business Search- 14 Million verified businesses
Males: 1,697
(50.6%)
Females: 1,655
(49.4%)
For population 25 years and over in 60940:
High school or higher: 92.9%
Bachelor's degree or higher: 17.8%
Graduate or professional degree: 5.1%
Unemployed: 5.3%
Mean travel time to work (commute): 30.3 minutes
For population 15 years and over in 60940:
Never married: 23.7%
Now married: 58.7%
Separated: 0.8%
Widowed: 6.1%
Divorced: 10.8%
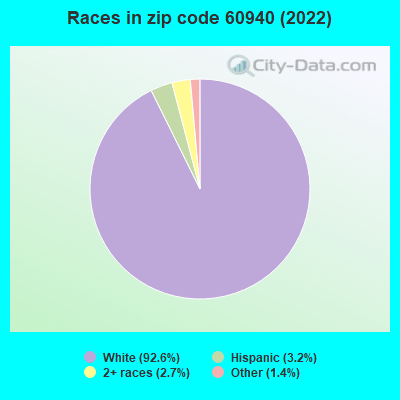
Zip code 60940 compared to state average:
Black race population percentage significantly below state average.
Hispanic race population percentage significantly below state average.
Foreign-born population percentage significantly below state average.
Renting percentage below state average.
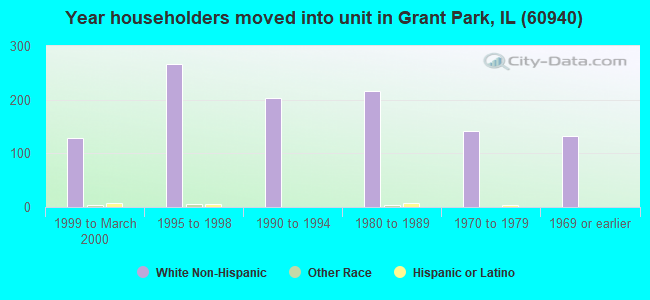
Length of stay since moving in significantly above state average.
Number of college students below state average.
Percentage of population with a bachelor's degree or higher significantly below state average.
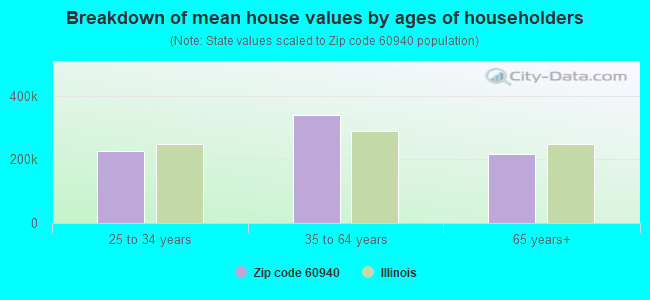
Estimated median house/condo value in 2022: $240,762
60940:
$240,762
Illinois:
$251,600
According to our research of Illinois and other state lists, there were 2 registered sex offenders living in 60940 zip code as of May 28, 2024. The ratio of all residents to sex offenders in zip code 60940 is 1,793 to 1. The ratio of registered sex offenders to all residents in this zip code is lower than the state average.
Median resident age:
This zip code:
38.5 years
Illinois median age:
39.1 years
Average household size:
This zip code:
3.0 people
Illinois:
2.4 people
Averages for the 2020 tax year for zip code 60940, filed in 2021:
Average Adjusted Gross Income (AGI) in 2020: $69,682 (Individual Income Tax Returns)
Here:
$69,682
State:
$82,626
Salary/wage: $56,091 (reported on 81.1% of returns)
Here:
$56,091
State:
$66,640
(% of AGI for various income ranges: 1234.1% for AGIs below $25k, 3530.0% for AGIs $25k-50k, 6192.8% for AGIs $50k-75k, 8415.4% for AGIs $75k-100k, 14158.6% for AGIs $100k-200k)
Taxable interest for individuals: $1,086 (reported on 31.4% of returns)
This zip code:
$1,086
Illinois:
$2,376
(% of AGI for various income ranges: 22.2% for AGIs below $25k, 37.2% for AGIs $25k-50k, 33.9% for AGIs $50k-75k, 56.9% for AGIs $75k-100k, 40.5% for AGIs $100k-200k)
Ordinary dividends: $3,635 (reported on 23.3% of returns)
Here:
$3,635
State:
$9,061
(% of AGI for various income ranges: 17.8% for AGIs below $25k, 64.8% for AGIs $25k-50k, 92.2% for AGIs $50k-75k, 180.0% for AGIs $75k-100k, 182.4% for AGIs $100k-200k)
Net capital gain/loss in AGI: +$6,418 (reported on 17.6% of returns)
Here:
+$6,418
State:
+$31,684
(% of AGI for various income ranges: 4.1% for AGIs below $25k, 27.6% for AGIs $25k-50k, 137.8% for AGIs $50k-75k, 216.2% for AGIs $75k-100k, 271.4% for AGIs $100k-200k)
Profit/loss from business: +$6,037 (reported on 11.9% of returns)
Here:
+$6,037
State:
+$12,175
(% of AGI for various income ranges: 53.1% for AGIs below $25k, 129.2% for AGIs $25k-50k, 102.8% for AGIs $50k-75k, 191.5% for AGIs $75k-100k, 104.8% for AGIs $100k-200k)
Taxable individual retirement arrangement distribution: $15,394 (reported on 11.3% of returns)
60940:
$15,394
Illinois:
$21,613
(% of AGI for various income ranges: 63.4% for AGIs below $25k, 118.8% for AGIs $25k-50k, 273.9% for AGIs $50k-75k, 467.7% for AGIs $75k-100k, 557.1% for AGIs $100k-200k)
Total itemized deductions: $33,491 (reported on 6.9% of returns)
Here:
$33,491
State:
$34,948
(% of AGI for various income ranges: 425.6% for AGIs $50k-75k, 493.1% for AGIs $75k-100k, 1084.3% for AGIs $100k-200k)
Charity contributions: $18,462 (reported on 5.0% of returns)
Here:
$18,462
State:
$13,122
(% of AGI for various income ranges: 95.6% for AGIs $50k-75k, 621.4% for AGIs $100k-200k)
Taxes paid: $8,282 (reported on 6.9% of returns)
60940:
$8,282
State:
$8,563
(% of AGI for various income ranges: 143.3% for AGIs $50k-75k, 137.7% for AGIs $75k-100k, 225.7% for AGIs $100k-200k)
Earned income credit: $2,293 (reported on 9.4% of returns)
Here:
$2,293
State:
$2,311
(% of AGI for various income ranges: 65.0% for AGIs below $25k, 54.4% for AGIs $25k-50k)
Percentage of individuals using paid preparers for their 2020 taxes: 94.3%
Here:
94%
State:
93%
(% for various income ranges: 93.3% for AGIs below $25k, 93.9% for AGIs $25k-50k, 96.2% for AGIs $50k-75k, 94.7% for AGIs $75k-100k, 96.7% for AGIs $100k-200k, 83.3% for AGIs over 200k)
Averages for the 2012 tax year for zip code 60940, filed in 2013:
Average Adjusted Gross Income (AGI) in 2012: $56,498 (Individual Income Tax Returns)
Here:
$56,498
State:
$68,058
Salary/wage: $44,916 (reported on 83.8% of returns)
Here:
$44,916
State:
$55,396
(% of AGI for various income ranges: 72.9% for AGIs below $25k, 69.5% for AGIs $25k-50k, 71.2% for AGIs $50k-75k, 72.9% for AGIs $75k-100k, 68.0% for AGIs $100k-200k, 39.2% for AGIs over 200k)
Taxable interest for individuals: $805 (reported on 40.6% of returns)
This zip code:
$805
Illinois:
$1,969
(% of AGI for various income ranges: 1.3% for AGIs below $25k, 0.7% for AGIs $25k-50k, 0.3% for AGIs $50k-75k, 0.4% for AGIs $75k-100k, 0.3% for AGIs $100k-200k, 1.4% for AGIs over 200k)
Ordinary dividends: $4,300 (reported on 25.0% of returns)
Here:
$4,300
State:
$7,786
(% of AGI for various income ranges: 1.3% for AGIs below $25k, 1.5% for AGIs $25k-50k, 0.5% for AGIs $50k-75k, 0.8% for AGIs $75k-100k, 0.6% for AGIs $100k-200k, 9.6% for AGIs over 200k)
Net capital gain/loss in AGI: +$4,784 (reported on 15.6% of returns)
Here:
+$4,784
State:
+$22,183
(% of AGI for various income ranges: 0.2% for AGIs below $25k, 0.5% for AGIs $25k-50k, 0.4% for AGIs $75k-100k, 4.0% for AGIs $100k-200k)
Profit/loss from business: +$8,579 (reported on 11.9% of returns)
Here:
+$8,579
State:
+$12,903
(% of AGI for various income ranges: 6.4% for AGIs below $25k, 2.3% for AGIs $25k-50k, 2.4% for AGIs $50k-75k, 1.2% for AGIs $75k-100k, 1.3% for AGIs $100k-200k)
Taxable individual retirement arrangement distribution: $10,663 (reported on 11.9% of returns)
60940:
$10,663
Illinois:
$17,929
(% of AGI for various income ranges: 2.5% for AGIs below $25k, 2.2% for AGIs $25k-50k, 2.4% for AGIs $50k-75k, 2.7% for AGIs $75k-100k, 2.7% for AGIs $100k-200k)
Total itemized deductions: $19,938 (22% of AGI, reported on 39.4% of returns)
Here:
$19,938
State:
$26,433
Here:
21.8% of AGI
State:
19.2% of AGI
(% of AGI for various income ranges: 11.4% for AGIs below $25k, 13.2% for AGIs $25k-50k, 16.4% for AGIs $50k-75k, 15.5% for AGIs $75k-100k, 13.9% for AGIs $100k-200k, 10.0% for AGIs over 200k)
Charity contributions: $2,844 (reported on 33.8% of returns)
Here:
$2,844
State:
$4,525
(% of AGI for various income ranges: 0.9% for AGIs below $25k, 1.3% for AGIs $25k-50k, 1.4% for AGIs $50k-75k, 1.6% for AGIs $75k-100k, 1.4% for AGIs $100k-200k, 3.9% for AGIs over 200k)
Taxes paid: $8,487 (reported on 39.4% of returns)
60940:
$8,487
State:
$11,968
(% of AGI for various income ranges: 3.6% for AGIs below $25k, 4.3% for AGIs $25k-50k, 6.4% for AGIs $50k-75k, 7.0% for AGIs $75k-100k, 6.7% for AGIs $100k-200k, 4.8% for AGIs over 200k)
Earned income credit: $2,360 (reported on 12.5% of returns)
Here:
$2,360
State:
$2,349
(% of AGI for various income ranges: 5.2% for AGIs below $25k, 1.0% for AGIs $25k-50k)
Percentage of individuals using paid preparers for their 2012 taxes: 70.0%
Here:
70%
State:
57%
(% for various income ranges: 64.3% for AGIs below $25k, 69.7% for AGIs $25k-50k, 75.0% for AGIs $50k-75k, 77.3% for AGIs $75k-100k, 71.4% for AGIs $100k-200k, 75.0% for AGIs over 200k)
Averages for the 2004 tax year for zip code 60940, filed in 2005:
Average Adjusted Gross Income (AGI) in 2004: $47,903 (Individual Income Tax Returns)
Here:
$47,903
State:
$54,625
Salary/wage: $42,411 (reported on 85.1% of returns)
Here:
$42,411
State:
$46,811
(% of AGI for various income ranges: 87.6% for AGIs below $10k, 71.0% for AGIs $10k-25k, 72.0% for AGIs $25k-50k, 80.8% for AGIs $50k-75k, 85.7% for AGIs $75k-100k, 64.1% for AGIs over 100k)
Taxable interest for individuals: $1,537 (reported on 58.5% of returns)
This zip code:
$1,537
Illinois:
$2,101
(% of AGI for various income ranges: 9.0% for AGIs below $10k, 4.4% for AGIs $10k-25k, 2.0% for AGIs $25k-50k, 1.4% for AGIs $50k-75k, 0.5% for AGIs $75k-100k, 2.3% for AGIs over 100k)
Taxable dividends: $1,349 (reported on 28.3% of returns)
Here:
$1,349
State:
$4,306
(% of AGI for various income ranges: 4.1% for AGIs below $10k, 1.9% for AGIs $10k-25k, 1.2% for AGIs $25k-50k, 0.6% for AGIs $50k-75k, 0.3% for AGIs $75k-100k, 0.6% for AGIs over 100k)
Net capital gain/loss: +$12,529 (reported on 20.1% of returns)
Here:
+$12,529
State:
+$17,321
(% of AGI for various income ranges: -1.6% for AGIs below $10k, 0.4% for AGIs $10k-25k, 1.4% for AGIs $25k-50k, 0.9% for AGIs $50k-75k, 0.7% for AGIs $75k-100k, 17.5% for AGIs over 100k)
Profit/loss from business: +$6,738 (reported on 14.2% of returns)
Here:
+$6,738
State:
+$11,771
(% of AGI for various income ranges: 7.3% for AGIs below $10k, 4.2% for AGIs $10k-25k, 3.6% for AGIs $25k-50k, 0.9% for AGIs $50k-75k, 1.1% for AGIs $75k-100k, 1.8% for AGIs over 100k)
Profit/loss from farming: +$461 (reported on 5.1% of returns)
Here:
+$461
State:
+$2,327
(% of AGI for various income ranges: -3.4% for AGIs below $10k, 2.2% for AGIs $25k-50k, -0.2% for AGIs $50k-75k, -1.0% for AGIs $75k-100k)
IRA payment deduction: $3,234 (reported on 4.3% of returns)
60940:
$3,234
Illinois:
$3,087
Total itemized deductions: $16,068 (22% of AGI, reported on 38.6% of returns)
Here:
$16,068
State:
$20,239
Here:
21.6% of AGI
State:
19.5% of AGI
(% of AGI for various income ranges: 9.4% for AGIs below $10k, 10.8% for AGIs $10k-25k, 13.9% for AGIs $25k-50k, 14.0% for AGIs $50k-75k, 14.7% for AGIs $75k-100k, 10.6% for AGIs over 100k)
Charity contributions deductions: $2,569 (3% of AGI, reported on 34.0% of returns)
Here:
$2,569
State:
$3,719
Here:
3.3% of AGI
State:
3.4% of AGI
(% of AGI for various income ranges: 1.0% for AGIs $10k-25k, 1.3% for AGIs $25k-50k, 1.7% for AGIs $50k-75k, 1.7% for AGIs $75k-100k, 2.8% for AGIs over 100k)
Total tax: $6,234 (reported on 78.8% of returns)
60940:
$6,234
State:
$9,882
(% of AGI for various income ranges: 3.1% for AGIs below $10k, 4.2% for AGIs $10k-25k, 6.9% for AGIs $25k-50k, 8.6% for AGIs $50k-75k, 9.8% for AGIs $75k-100k, 16.5% for AGIs over 100k)
Earned income credit: $1,653 (reported on 10.1% of returns)
Here:
$1,653
State:
$1,788
Percentage of individuals using paid preparers for their 2004 taxes: 72.5%
Here:
72%
State:
61%
(% for various income ranges: 61.6% for AGIs below $10k, 70.9% for AGIs $10k-25k, 71.5% for AGIs $25k-50k, 76.6% for AGIs $50k-75k, 80.4% for AGIs $75k-100k, 81.6% for AGIs over 100k)
Household received Food Stamps/SNAP in the past 12 months: 124 Household did not receive Food Stamps/SNAP in the past 12 months: 985
Women who had a birth in the past 12 months: 12 (12 now married, 0 unmarried) Women who did not have a birth in the past 12 months: 635 (339 now married, 292 unmarried)
Housing units in zip code 60940 with a mortgage: 586 (37 second mortgage, 30 both second mortgage and home equity loan) Houses without a mortgage: 16
Median monthly owner costs for units with a mortgage: $1,621 Median monthly owner costs for units without a mortgage: $760
Residents with income below the poverty level in 2022:
This zip code:
8.7%
Whole state:
11.9%
Residents with income below 50% of the poverty level in 2022:
This zip code:
2.9%
Whole state:
5.7%
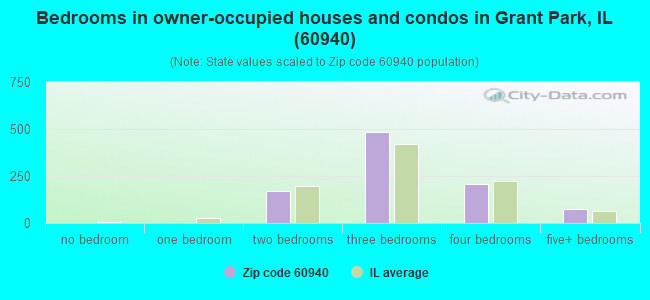
Median number of rooms in houses and condos:
Here:
6.7
State:
6.4
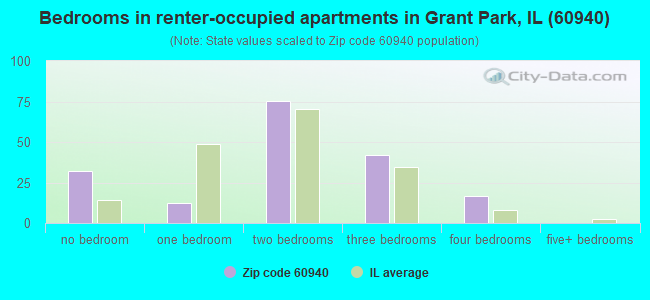
Median number of rooms in apartments:
Here:
4.5
State:
4.1
Notable locations in this zip code not listed on our city pages
Notable locations in zip code 60940: Minne Monesse Golf Course (A), Brock (B), Grant Park Fire Protection District (C). Display/hide their locations on the map
Cemeteries: Scherburnville Christian Cemetery (1), Saint Paul Lutheran Cemetery (2), Heusing Cemetery (3), Union Corner Cemetery (4). Display/hide their locations on the map
In group quarters: 10 (-1 institutionalized population)
Size of family households: 334 2-persons, 149 3-persons, 117 4-persons, 108 5-persons, 38 6-persons, 26 7-or-more-persons
Size of nonfamily households: 270 1-person, 34 2-persons, 24 7-or-more-persons
461 married couples with children.
121 single-parent households (36 men, 85 women).
95.4% of residents of 60940 zip code speak English at home.
3.0% of residents speak Spanish at home (92% very well, 8% well).
0.7% of residents speak other Indo-European language at home (73% very well, 23% well, 5% not well).
0.4% of residents speak other language at home (100% very well).
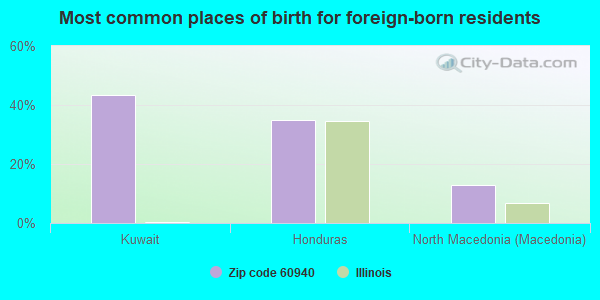
Foreign born population: 23 (0.7%) (82.7% of them are naturalized citizens)
This zip code:
0.7%
Whole state:
14.4%
43%Kuwait
35%Honduras
13%North Macedonia (Macedonia)
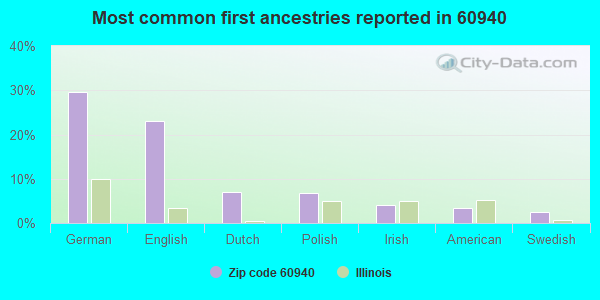
30%German
23%English
7%Dutch
7%Polish
4%Irish
3%American
3%Swedish
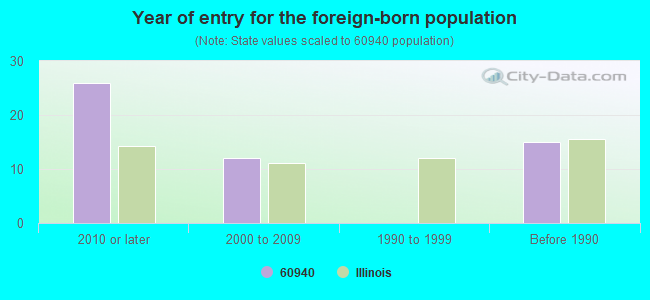
Year of entry for the foreign-born population
262010 or later
122000 to 2009
01990 to 1999
15Before 1990
Major facilities with environmental interests located in this zip code:
REYNOLDS FOOD PACKAGING (304 NE MAIN ST in GRANT PARK, IL)
STATE MASTER (Illinois EPA Project) - SOLID WASTE PROGRAM, HAZARDOUS WASTE PROGRAM, AIR PROGRAM STATE MASTER (Illinois EPA Project) - National Pollutant Discharge Elimination System Permit AIR MINOR (AIRS/AFS) CRITERIA AND HAZARDOUS AIR POLLUTANT INVENTORY (Inventory of air pollution sources) National Pollutant Discharge Elimination System NON-MAJOR (Tracking pollutant discharge elimination systems) - permit Small Quantity Generators, between 100 kg and 1000 kg of hazardous waste/month (Resource Conservation and Recovery Act (tracking hazardous waste)) Business SIC classification: PLASTICS PRODUCTS; SPECIAL DIES AND TOOLS, DIE SETS, JIGS AND FIXTURES, AND INDUSTRIAL MOLDS Business NAICS classification: ALL OTHER PLASTICS PRODUCT MANUFACTURING. Alternative names: IVEX CORP, REYNOLDS FOOD PACKAGING LLC, REYNOLDS FOOD PKG LLC-GRANT PA
HALLMARK FINISHING LLC (13000 E. SR 7 in GRANT PARK, IL)
STATE MASTER (Illinois EPA Project) - AIR PROGRAM, HAZARDOUS WASTE PROGRAM AIR MINOR (AIRS/AFS) Large Quantity Generators, more that 1000 kg of hazardous waste/month (Resource Conservation and Recovery Act (tracking hazardous waste))
GRANT PARK STP (SOUTH MAIN STREET in GRANT PARK, IL)
STATE MASTER (Illinois EPA Project) - National Pollutant Discharge Elimination System Permit National Pollutant Discharge Elimination System NON-MAJOR (Tracking pollutant discharge elimination systems) - permit National Pollutant Discharge Elimination System NON-MAJOR (Tracking pollutant discharge elimination systems) - permit Business SIC classification: SEWERAGE SYSTEMS Alternative names: GRANT PARK STP, VILLAGE OF, GRANT PARK, VILLAGE OF
CHARLES F L HOMMEDIEU & SONS CO INC (103 TAYLOR ST in GRANT PARK, IL)
STATE MASTER (Illinois EPA Project) - AIR PROGRAM AIR MINOR (AIRS/AFS) Business SIC classification: ABRASIVE PRODUCTS Alternative names: CHARLES F. L'HOMMEDIEU & SONS CO. INC.
GRANT PARK PACKING CO (R R #2 in GRANT PARK, IL)
STATE MASTER (Illinois EPA Project) - AIR PROGRAM AIR MINOR (AIRS/AFS) Business SIC classification: MEAT PACKING PLANTS
IVEX CORP-MACHINE DIV (203 N STANLEY ST in GRANT PARK, IL)
STATE MASTER (Illinois EPA Project) - SOLID WASTE PROGRAM Small Quantity Generators, between 100 kg and 1000 kg of hazardous waste/month (Resource Conservation and Recovery Act (tracking hazardous waste)) - notification Alternative names: IVEX MACHINE DIVISION CORP
KANKAKEE SERVICE CO (PUDER STATION in GRANT PARK, IL)
STATE MASTER (Illinois EPA Project) - AIR PROGRAM AIR MINOR (AIRS/AFS) Business SIC classification: BOOKS, PERIODICALS, AND NEWSPAPERS
PARK MANUFACTURING CO (MAIN & MOSIER ST in GRANT PARK, IL)
STATE MASTER (Illinois EPA Project) - AIR PROGRAM AIR MINOR (AIRS/AFS) Business SIC classification: NONCLASSIFIABLE ESTABLISHMENTS
R&R MACHINE SHOP INC (MAIN ST AND DIXIE HWY in GRANT PARK, IL)
STATE MASTER (Illinois EPA Project) - HAZARDOUS WASTE PROGRAM Small Quantity Generators, between 100 kg and 1000 kg of hazardous waste/month (Resource Conservation and Recovery Act (tracking hazardous waste)) - notification Organizations: R AND R MACHINE SHOP INC (CONTACT/OWNER)
REYNOLDS FOOD PKG (221 E GREENWOOD in GRANT PARK, IL)
STATE MASTER (Illinois EPA Project) - SOLID WASTE PROGRAM, HAZARDOUS WASTE PROGRAM Conditionally Exempt Small Quantity Generators, less than 100 kg/month of hazardous waste (Resource Conservation and Recovery Act (tracking hazardous waste)) Business NAICS classification: ALL OTHER PLASTICS PRODUCT MANUFACTURING. Organizations: REYNOLDS FOOD PACKAGING (CONTACT/OPERATOR)
Alternative names: ALCOA REYNOLDS ENGINEERING, IPC INC, IVEX TOOLING MACHINE, REYNOLDS FOOD PACKAGING ENGINEERING
AMERICAN OUTDOOR (206 N STANLEY in GRANT PARK, IL)
STATE MASTER (Illinois EPA Project) - HAZARDOUS WASTE PROGRAM Small Quantity Generators, between 100 kg and 1000 kg of hazardous waste/month (Resource Conservation and Recovery Act (tracking hazardous waste)) - notification
GRANT PARK HIGH SCHOOL (PO BOX 549 in GRANT PARK, IL)
(Geographic Names Information System) (National Center for Education Statistics) - STATE ID-3204600600001 Organizations: GRANT PARK C U SCHOOL DIST 6 (SCHOOL DISTRICT)
RIVER ROSE INC (13356 E 9000 N RD in GRANT PARK, IL)
STATE MASTER (Illinois EPA Project) - HAZARDOUS WASTE PROGRAM Conditionally Exempt Small Quantity Generators, less than 100 kg/month of hazardous waste (Resource Conservation and Recovery Act (tracking hazardous waste)) - notification Organizations: SACHACHIK NANCY LEE (CONTACT/OWNER)
Housing units lacking complete plumbing facilities: 0.6% Housing units lacking complete kitchen facilities: 1.7%
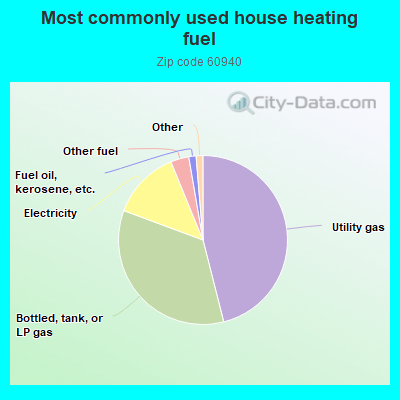
46.2%Utility gas
34.7%Bottled, tank, or LP gas
13.2%Electricity
3.5%Other fuel
1.4%Fuel oil, kerosene, etc.
0.8%No fuel used
0.5%Wood
Population in 1990: 3,009. Population change in the 1990s: +163 (+5.4%).
Place of birth for U.S.-born residents:
This state: 2,773
Northeast: 82
Midwest: 352
South: 43
West: 37
69% of the 60940 zip code residents lived in the same house 5 years ago. Out of people who lived in different houses, 44% lived in this county. Out of people who lived in different counties, 50% lived in Illinois.
95% of the 60940 zip code residents lived in the same house 1 year ago. Out of people who lived in different houses, 45% moved from this county. Out of people who lived in different houses, 33% moved from different county within same state. Out of people who lived in different houses, 24% moved from different state.
Private vs. public school enrollment:
Students in private schools in grades 1 to 8 (elementary and middle school): 38
Here:
9.0%
Illinois:
13.3%
Students in private schools in grades 9 to 12 (high school): 18
Here:
9.6%
Illinois:
9.9%
Students in private undergraduate colleges: 9
Here:
23.6%
Illinois:
27.4%
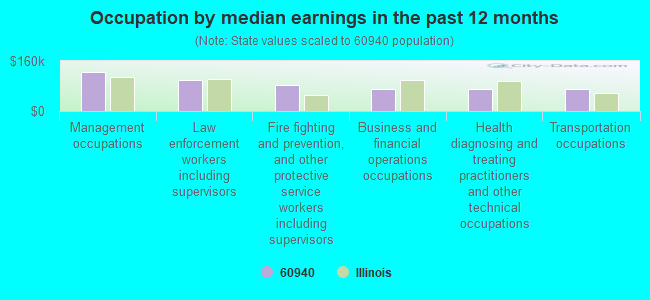
Occupation by median earnings in the past 12 months ($)
125,157Management occupations
98,950Law enforcement workers including supervisors
83,307Fire fighting and prevention, and other protective service workers including supervisors
71,641Business and financial operations occupations
69,587Health diagnosing and treating practitioners and other technical occupations
69,014Transportation occupations
Top industries in this zip code by the number of employees in 2005:
Wholesale Trade: Construction and Mining (except Oil Well) Machinery and Equipment Merchant Wholesalers (20-49: 1)
Accommodation and Food Services: Limited-Service Restaurants (10-19: 2)
Other Services (except Public Administration): Commercial and Industrial Machinery and Equipment (except Automotive and Electronic) Repair and Maintenance (10-19: 1, 1-4: 1)
Arts, Entertainment, and Recreation: Golf Courses and Country Clubs (10-19: 1)
Construction: Painting and Wall Covering Contractors (10-19: 1)
People in group quarters in 2010:
8 people in group homes intended for adults
People in group quarters in 2000:
17 people in other nonhousehold living situations
Fatal accident statistics in 2011:
Fatal accident count: 1
Vehicles involved in fatal accidents: 1
Fatal accidents caused by drunken drivers: 1
Fatalities: 1
Persons involved in fatal accidents: 1
Pedestrians involved in fatal accidents: 0
Fatal accident statistics in 2010:
Fatal accident count: 2
Vehicles involved in fatal accidents: 5
Fatal accidents caused by drunken drivers: 1
Fatalities: 2
Persons involved in fatal accidents: 10
Pedestrians involved in fatal accidents: 0
Home Mortgage Disclosure Act Aggregated Statistics For Year 2009 (Based on 4 partial tracts)
A) FHA, FSA/RHS & VA Home Purchase Loans
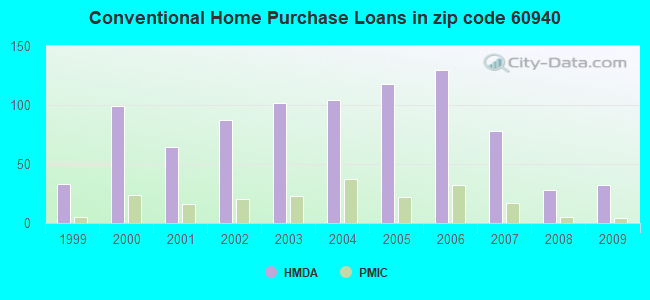
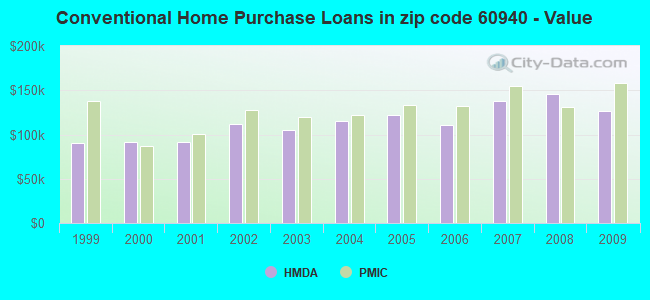
B) Conventional Home Purchase Loans
C) Refinancings
D) Home Improvement Loans
E) Loans on Dwellings For 5+ Families
F) Non-occupant Loans on < 5 Family Dwellings (A B C & D)
G) Loans On Manufactured Home Dwelling (A B C & D)
Number
Average Value
Number
Average Value
Number
Average Value
Number
Average Value
Number
Average Value
Number
Average Value
Number
Average Value
LOANS ORIGINATED
10
$126,411
32
$126,663
233
$140,541
12
$60,292
0
$0
11
$92,275
2
$10,125
APPLICATIONS APPROVED, NOT ACCEPTED
0
$0
2
$93,885
8
$198,891
3
$25,227
0
$0
1
$79,510
0
$0
APPLICATIONS DENIED
3
$148,170
6
$168,293
70
$135,801
5
$45,458
2
$46,720
3
$74,070
0
$0
APPLICATIONS WITHDRAWN
2
$97,340
8
$75,420
48
$151,247
3
$28,150
0
$0
1
$31,610
0
$0
FILES CLOSED FOR INCOMPLETENESS
1
$171,480
3
$155,740
11
$164,842
0
$0
0
$0
0
$0
0
$0
Aggregated Statistics For Year 2008 (Based on 4 partial tracts)
A) FHA, FSA/RHS & VA Home Purchase Loans
B) Conventional Home Purchase Loans
C) Refinancings
D) Home Improvement Loans
F) Non-occupant Loans on < 5 Family Dwellings (A B C & D)
G) Loans On Manufactured Home Dwelling (A B C & D)
Number
Average Value
Number
Average Value
Number
Average Value
Number
Average Value
Number
Average Value
Number
Average Value
LOANS ORIGINATED
16
$136,850
28
$146,258
143
$138,897
34
$56,066
17
$90,988
3
$110,723
APPLICATIONS APPROVED, NOT ACCEPTED
0
$0
6
$181,687
15
$162,684
0
$0
1
$22,990
0
$0
APPLICATIONS DENIED
6
$138,645
14
$101,204
70
$161,671
11
$58,514
2
$130,290
3
$92,290
APPLICATIONS WITHDRAWN
6
$135,902
6
$175,160
30
$137,586
1
$31,610
0
$0
2
$119,140
FILES CLOSED FOR INCOMPLETENESS
0
$0
1
$153,280
10
$229,352
1
$23,950
0
$0
0
$0
Aggregated Statistics For Year 2007 (Based on 4 partial tracts)
A) FHA, FSA/RHS & VA Home Purchase Loans
B) Conventional Home Purchase Loans
C) Refinancings
D) Home Improvement Loans
F) Non-occupant Loans on < 5 Family Dwellings (A B C & D)
G) Loans On Manufactured Home Dwelling (A B C & D)
Number
Average Value
Number
Average Value
Number
Average Value
Number
Average Value
Number
Average Value
Number
Average Value
LOANS ORIGINATED
7
$110,130
78
$137,350
154
$124,287
37
$49,203
24
$76,550
6
$67,857
APPLICATIONS APPROVED, NOT ACCEPTED
0
$0
10
$134,353
25
$101,988
1
$168,610
5
$107,714
0
$0
APPLICATIONS DENIED
2
$63,855
33
$155,453
98
$148,396
13
$64,302
7
$146,656
2
$173,400
APPLICATIONS WITHDRAWN
1
$62,270
9
$160,339
32
$159,434
3
$56,377
3
$169,463
0
$0
FILES CLOSED FOR INCOMPLETENESS
0
$0
0
$0
12
$163,165
0
$0
0
$0
0
$0
Aggregated Statistics For Year 2006 (Based on 4 partial tracts)
A) FHA, FSA/RHS & VA Home Purchase Loans
B) Conventional Home Purchase Loans
C) Refinancings
D) Home Improvement Loans
E) Loans on Dwellings For 5+ Families
F) Non-occupant Loans on < 5 Family Dwellings (A B C & D)
G) Loans On Manufactured Home Dwelling (A B C & D)
Number
Average Value
Number
Average Value
Number
Average Value
Number
Average Value
Number
Average Value
Number
Average Value
Number
Average Value
LOANS ORIGINATED
6
$88,290
130
$111,136
142
$124,528
40
$42,602
1
$275,900
39
$72,841
4
$205,280
APPLICATIONS APPROVED, NOT ACCEPTED
1
$114,000
19
$91,467
17
$113,272
7
$40,637
0
$0
9
$52,519
1
$20,120
APPLICATIONS DENIED
2
$84,305
40
$116,188
80
$123,210
19
$53,964
0
$0
8
$74,816
0
$0
APPLICATIONS WITHDRAWN
0
$0
24
$100,757
51
$109,807
2
$35,925
0
$0
8
$87,324
1
$74,720
FILES CLOSED FOR INCOMPLETENESS
2
$123,815
2
$169,085
28
$125,762
1
$108,250
0
$0
0
$0
0
$0
Aggregated Statistics For Year 2005 (Based on 4 partial tracts)
A) FHA, FSA/RHS & VA Home Purchase Loans
B) Conventional Home Purchase Loans
C) Refinancings
D) Home Improvement Loans
F) Non-occupant Loans on < 5 Family Dwellings (A B C & D)
G) Loans On Manufactured Home Dwelling (A B C & D)
Number
Average Value
Number
Average Value
Number
Average Value
Number
Average Value
Number
Average Value
Number
Average Value
LOANS ORIGINATED
1
$161,900
118
$122,377
162
$122,336
26
$30,402
23
$78,020
8
$80,868
APPLICATIONS APPROVED, NOT ACCEPTED
0
$0
16
$85,376
32
$128,069
3
$104,940
5
$65,444
1
$41,190
APPLICATIONS DENIED
2
$63,705
34
$93,864
73
$102,901
15
$41,855
7
$71,810
3
$99,153
APPLICATIONS WITHDRAWN
3
$160,930
13
$90,311
59
$126,551
4
$98,435
3
$69,297
2
$104,345
FILES CLOSED FOR INCOMPLETENESS
0
$0
13
$72,143
34
$118,566
0
$0
0
$0
0
$0
Aggregated Statistics For Year 2004 (Based on 4 partial tracts)
A) FHA, FSA/RHS & VA Home Purchase Loans
B) Conventional Home Purchase Loans
C) Refinancings
D) Home Improvement Loans
F) Non-occupant Loans on < 5 Family Dwellings (A B C & D)
G) Loans On Manufactured Home Dwelling (A B C & D)
Number
Average Value
Number
Average Value
Number
Average Value
Number
Average Value
Number
Average Value
Number
Average Value
LOANS ORIGINATED
5
$94,590
104
$115,717
183
$114,462
23
$31,819
22
$85,166
2
$9,345
APPLICATIONS APPROVED, NOT ACCEPTED
2
$108,240
23
$90,581
31
$127,590
1
$13,410
2
$31,615
1
$36,400
APPLICATIONS DENIED
3
$97,077
34
$87,790
124
$98,368
19
$54,146
9
$68,456
6
$62,072
APPLICATIONS WITHDRAWN
2
$100,110
8
$102,408
60
$120,826
5
$137,378
3
$91,073
0
$0
FILES CLOSED FOR INCOMPLETENESS
0
$0
3
$74,627
31
$116,309
1
$19,160
0
$0
0
$0
Aggregated Statistics For Year 2003 (Based on 4 partial tracts)
A) FHA, FSA/RHS & VA Home Purchase Loans
B) Conventional Home Purchase Loans
C) Refinancings
D) Home Improvement Loans
E) Loans on Dwellings For 5+ Families
F) Non-occupant Loans on < 5 Family Dwellings (A B C & D)
Number
Average Value
Number
Average Value
Number
Average Value
Number
Average Value
Number
Average Value
Number
Average Value
LOANS ORIGINATED
7
$92,753
102
$104,898
425
$105,753
25
$32,854
2
$124,590
35
$66,806
APPLICATIONS APPROVED, NOT ACCEPTED
0
$0
13
$120,328
37
$91,054
3
$25,473
0
$0
2
$48,380
APPLICATIONS DENIED
4
$107,535
35
$89,584
127
$91,383
8
$38,422
0
$0
4
$64,915
APPLICATIONS WITHDRAWN
2
$113,045
8
$124,831
48
$109,878
2
$5,750
0
$0
2
$18,690
FILES CLOSED FOR INCOMPLETENESS
0
$0
4
$91,785
23
$139,978
0
$0
0
$0
1
$36,400
Aggregated Statistics For Year 2002 (Based on 4 partial tracts)
A) FHA, FSA/RHS & VA Home Purchase Loans
B) Conventional Home Purchase Loans
C) Refinancings
D) Home Improvement Loans
F) Non-occupant Loans on < 5 Family Dwellings (A B C & D)
Number
Average Value
Number
Average Value
Number
Average Value
Number
Average Value
Number
Average Value
LOANS ORIGINATED
4
$80,232
87
$112,173
326
$100,251
41
$35,856
37
$61,839
APPLICATIONS APPROVED, NOT ACCEPTED
0
$0
11
$110,155
21
$93,939
2
$4,670
3
$63,760
APPLICATIONS DENIED
3
$67,060
21
$82,570
91
$87,183
9
$54,292
1
$47,900
APPLICATIONS WITHDRAWN
1
$112,090
12
$118,581
23
$97,882
4
$25,845
0
$0
FILES CLOSED FOR INCOMPLETENESS
1
$50,770
3
$51,093
34
$116,572
0
$0
0
$0
Aggregated Statistics For Year 2001 (Based on 4 partial tracts)
A) FHA, FSA/RHS & VA Home Purchase Loans
B) Conventional Home Purchase Loans
C) Refinancings
D) Home Improvement Loans
F) Non-occupant Loans on < 5 Family Dwellings (A B C & D)
Number
Average Value
Number
Average Value
Number
Average Value
Number
Average Value
Number
Average Value
LOANS ORIGINATED
7
$96,790
64
$91,362
321
$97,760
48
$30,396
22
$74,667
APPLICATIONS APPROVED, NOT ACCEPTED
0
$0
6
$116,678
18
$64,639
3
$66,450
2
$54,605
APPLICATIONS DENIED
2
$105,905
13
$58,135
80
$88,725
19
$32,131
0
$0
APPLICATIONS WITHDRAWN
2
$94,225
6
$123,403
24
$78,571
6
$37,677
0
$0
FILES CLOSED FOR INCOMPLETENESS
0
$0
2
$56,845
13
$85,355
0
$0
2
$56,845
Aggregated Statistics For Year 2000 (Based on 4 partial tracts)
A) FHA, FSA/RHS & VA Home Purchase Loans
B) Conventional Home Purchase Loans
C) Refinancings
D) Home Improvement Loans
F) Non-occupant Loans on < 5 Family Dwellings (A B C & D)
Number
Average Value
Number
Average Value
Number
Average Value
Number
Average Value
Number
Average Value
LOANS ORIGINATED
13
$100,225
99
$91,062
100
$75,776
55
$29,350
27
$69,302
APPLICATIONS APPROVED, NOT ACCEPTED
4
$113,235
8
$48,166
13
$76,425
8
$10,451
3
$30,543
APPLICATIONS DENIED
0
$0
38
$63,856
43
$63,308
11
$21,985
1
$79,510
APPLICATIONS WITHDRAWN
0
$0
16
$72,006
28
$77,846
6
$69,145
0
$0
FILES CLOSED FOR INCOMPLETENESS
2
$71,370
3
$85,437
13
$119,353
0
$0
3
$49,673
Aggregated Statistics For Year 1999 (Based on 1 partial tract)
A) FHA, FSA/RHS & VA Home Purchase Loans
B) Conventional Home Purchase Loans
C) Refinancings
D) Home Improvement Loans
F) Non-occupant Loans on < 5 Family Dwellings (A B C & D)
Detailed PMIC statistics for the following Tracts:0101.00
, 0109.00
2002 - 2018 National Fire Incident Reporting System (NFIRS) incidents
Based on the data from the years 2002 - 2018 the average number of fire incidents per year is 40. The highest number of reported fire incidents - 77 took place in 2010, and the least - 1 in 2006. The data has a growing trend.
When looking into fire subcategories, the most incidents belonged to: Structure Fires (60.9%), and Outside Fires (29.4%).
Fire incident types reported to NFIRS in Zip Code 60940


 Nearest zip codes: 60401, 60954, 46376, 60417, 60468, 60958.


 Based on the data from the years 2002 - 2018 the average number of fire incidents per year is 40. The highest number of reported fire incidents - 77 took place in 2010, and the least - 1 in 2006. The data has a growing trend.
 When looking into fire subcategories, the most incidents belonged to: Structure Fires (60.9%), and Outside Fires (29.4%).