Estimated zip code population in 2022: 748 Zip code population in 2010: 961 Zip code population in 2000: 1,174
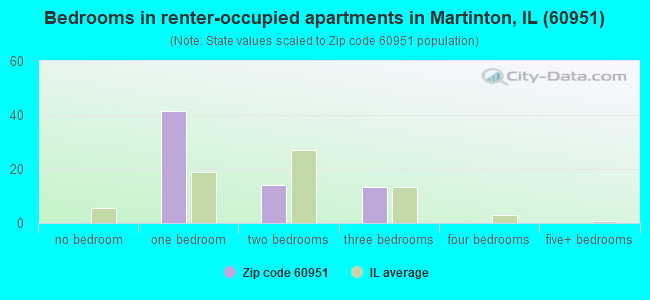
Houses and condos: 366 Renter-occupied apartments: 69
% of renters here:
21%
State:
33%
March 2022 cost of living index in zip code 60951: 84.3 (less than average, U.S. average is 100)
Land area: 53.2 sq. mi. Water area: 0.3 sq. mi.
Population density: 14 people per square mile
(very low).
OSM Map
General Map
Google Map
MSN Map
OSM Map
General Map
Google Map
MSN Map
OSM Map
General Map
Google Map
MSN Map
OSM Map
General Map
Google Map
MSN Map
Please wait while loading the map...
Real estate property taxes paid for housing units in 2022:
This zip code:
1.6% ($2,528)
Illinois:
2.0% ($4,912)
Median real estate property taxes paid for housing units with mortgages in 2022: $2,565 (1.2%) Median real estate property taxes paid for housing units with no mortgage in 2022: $2,326 (1.9%)
Business Search- 14 Million verified businesses
Males: 423
(56.5%)
Females: 325
(43.5%)
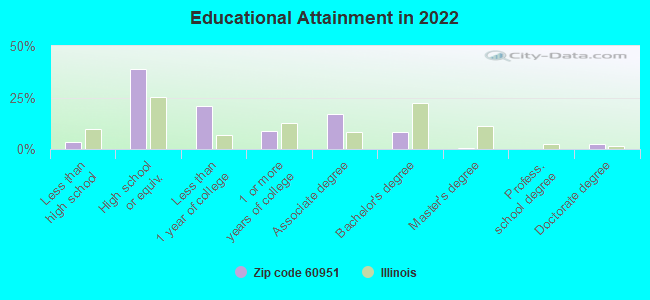
For population 25 years and over in 60951:
High school or higher: 95.3%
Bachelor's degree or higher: 11.5%
Graduate or professional degree: 3.4%
Unemployed: 1.7%
Mean travel time to work (commute): 32.4 minutes
For population 15 years and over in 60951:
Never married: 23.2%
Now married: 61.3%
Separated: 0.1%
Widowed: 3.9%
Divorced: 11.5%
Zip code 60951 compared to state average:
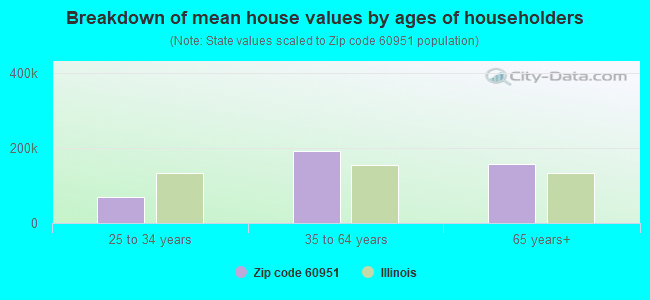
Median house value below state average.
Unemployed percentage below state average.
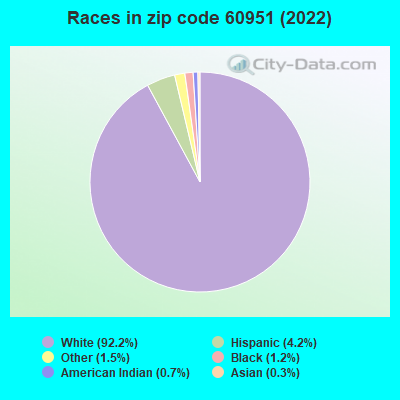
Black race population percentage significantly below state average.
Hispanic race population percentage significantly below state average.
Median age above state average.
Foreign-born population percentage significantly below state average.
Renting percentage below state average.
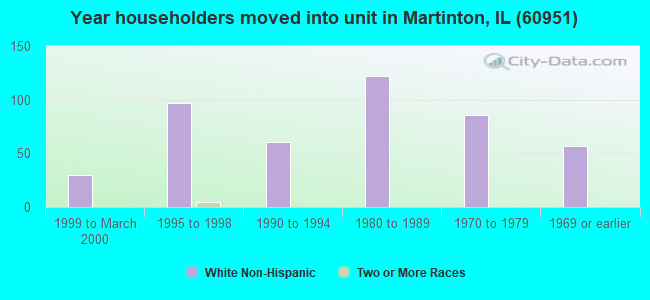
Length of stay since moving in significantly above state average.
Number of college students significantly below state average.
Percentage of population with a bachelor's degree or higher significantly below state average.
Estimated median house/condo value in 2022: $157,842
60951:
$157,842
Illinois:
$251,600
According to our research of Illinois and other state lists, there was 1 registered sex offender living in 60951 zip code as of June 09, 2024. The ratio of all residents to sex offenders in zip code 60951 is 770 to 1. The ratio of registered sex offenders to all residents in this zip code is near the state average.
Median resident age:
This zip code:
43.8 years
Illinois median age:
39.1 years
Average household size:
This zip code:
2.3 people
Illinois:
2.4 people
Averages for the 2020 tax year for zip code 60951, filed in 2021:
Average Adjusted Gross Income (AGI) in 2020: $62,422 (Individual Income Tax Returns)
Here:
$62,422
State:
$82,626
Salary/wage: $48,521 (reported on 80.5% of returns)
Here:
$48,521
State:
$66,640
(% of AGI for various income ranges: 1135.7% for AGIs below $25k, 3271.2% for AGIs $25k-50k, 7327.5% for AGIs $50k-75k, 8906.7% for AGIs $75k-100k, 17492.5% for AGIs $100k-200k)
Taxable interest for individuals: $762 (reported on 31.7% of returns)
This zip code:
$762
Illinois:
$2,376
(% of AGI for various income ranges: 12.5% for AGIs $25k-50k, 72.5% for AGIs $50k-75k, 80.0% for AGIs $75k-100k, 90.0% for AGIs $100k-200k)
Ordinary dividends: $1,633 (reported on 22.0% of returns)
Here:
$1,633
State:
$9,061
(% of AGI for various income ranges: 24.3% for AGIs below $25k, 122.5% for AGIs $50k-75k, 202.5% for AGIs $100k-200k)
Net capital gain/loss in AGI: +$17,550 (reported on 14.6% of returns)
Here:
+$17,550
State:
+$31,684
(% of AGI for various income ranges: 40.0% for AGIs $25k-50k, 2552.5% for AGIs $100k-200k)
Profit/loss from business: +$8,083 (reported on 14.6% of returns)
Here:
+$8,083
State:
+$12,175
(% of AGI for various income ranges: 228.6% for AGIs below $25k, 812.5% for AGIs $50k-75k)
Taxable individual retirement arrangement distribution: $16,700 (reported on 7.3% of returns)
60951:
$16,700
Illinois:
$21,613
(% of AGI for various income ranges: 1252.5% for AGIs $50k-75k)
Earned income credit: $2,220 (reported on 12.2% of returns)
Here:
$2,220
State:
$2,311
(% of AGI for various income ranges: 78.6% for AGIs below $25k, 70.0% for AGIs $25k-50k)
Percentage of individuals using paid preparers for their 2020 taxes: 100.0%
Here:
100%
State:
93%
(% for various income ranges: 100.0% for AGIs below $25k, 100.0% for AGIs $25k-50k, 100.0% for AGIs $50k-75k, 100.0% for AGIs $75k-100k, 100.0% for AGIs $100k-200k)
Averages for the 2012 tax year for zip code 60951, filed in 2013:
Average Adjusted Gross Income (AGI) in 2012: $53,483 (Individual Income Tax Returns)
Here:
$53,483
State:
$68,058
Salary/wage: $40,015 (reported on 81.0% of returns)
Here:
$40,015
State:
$55,396
(% of AGI for various income ranges: 67.8% for AGIs below $25k, 66.1% for AGIs $25k-50k, 75.9% for AGIs $50k-75k, 65.9% for AGIs $75k-100k, 42.9% for AGIs $100k-200k)
Taxable interest for individuals: $1,324 (reported on 40.5% of returns)
This zip code:
$1,324
Illinois:
$1,969
(% of AGI for various income ranges: 1.8% for AGIs below $25k, 1.4% for AGIs $25k-50k, 0.6% for AGIs $50k-75k, 0.4% for AGIs $75k-100k, 1.2% for AGIs $100k-200k)
Ordinary dividends: $1,111 (reported on 21.4% of returns)
Here:
$1,111
State:
$7,786
(% of AGI for various income ranges: 1.8% for AGIs below $25k, 0.3% for AGIs $50k-75k, 0.7% for AGIs $100k-200k)
Net capital gain/loss in AGI: +$1,367 (reported on 14.3% of returns)
Here:
+$1,367
State:
+$22,183
Profit/loss from business: +$5,840 (reported on 11.9% of returns)
Here:
+$5,840
State:
+$12,903
Taxable individual retirement arrangement distribution: $5,620 (reported on 11.9% of returns)
60951:
$5,620
Illinois:
$17,929
Total itemized deductions: $18,075 (21% of AGI, reported on 28.6% of returns)
Here:
$18,075
State:
$26,433
Here:
21.2% of AGI
State:
19.2% of AGI
(% of AGI for various income ranges: 22.1% for AGIs below $25k, 10.4% for AGIs $50k-75k, 11.5% for AGIs $75k-100k, 9.9% for AGIs $100k-200k)
Charity contributions: $3,062 (reported on 19.0% of returns)
Here:
$3,062
State:
$4,525
(% of AGI for various income ranges: 1.4% for AGIs $50k-75k, 1.3% for AGIs $75k-100k, 1.5% for AGIs $100k-200k)
Taxes paid: $6,700 (reported on 26.2% of returns)
60951:
$6,700
State:
$11,968
(% of AGI for various income ranges: 4.6% for AGIs below $25k, 3.7% for AGIs $50k-75k, 3.3% for AGIs $75k-100k, 4.3% for AGIs $100k-200k)
Earned income credit: $2,520 (reported on 11.9% of returns)
Here:
$2,520
State:
$2,349
(% of AGI for various income ranges: 7.4% for AGIs below $25k)
Percentage of individuals using paid preparers for their 2012 taxes: 81.0%
Here:
81%
State:
57%
(% for various income ranges: 71.4% for AGIs below $25k, 80.0% for AGIs $25k-50k, 87.5% for AGIs $50k-75k, 80.0% for AGIs $75k-100k, 100.0% for AGIs $100k-200k)
Averages for the 2004 tax year for zip code 60951, filed in 2005:
Average Adjusted Gross Income (AGI) in 2004: $40,869 (Individual Income Tax Returns)
Here:
$40,869
State:
$54,625
Salary/wage: $37,338 (reported on 84.0% of returns)
Here:
$37,338
State:
$46,811
(% of AGI for various income ranges: 100.0% for AGIs below $10k, 66.3% for AGIs $10k-25k, 80.9% for AGIs $25k-50k, 85.9% for AGIs $50k-75k, 86.6% for AGIs $75k-100k, 50.5% for AGIs over 100k)
Taxable interest for individuals: $1,136 (reported on 55.4% of returns)
This zip code:
$1,136
Illinois:
$2,101
(% of AGI for various income ranges: 9.6% for AGIs below $10k, 4.7% for AGIs $10k-25k, 2.1% for AGIs $25k-50k, 1.3% for AGIs $50k-75k, 0.2% for AGIs $75k-100k, 0.2% for AGIs over 100k)
Taxable dividends: $756 (reported on 20.2% of returns)
Here:
$756
State:
$4,306
(% of AGI for various income ranges: 1.9% for AGIs $10k-25k, 0.6% for AGIs $25k-50k, 0.2% for AGIs $50k-75k, 0.1% for AGIs $75k-100k, 0.0% for AGIs over 100k)
Net capital gain/loss: +$1,037 (reported on 12.7% of returns)
Here:
+$1,037
State:
+$17,321
(% of AGI for various income ranges: 2.4% for AGIs below $10k, 1.1% for AGIs $25k-50k, -0.1% for AGIs $50k-75k, 0.3% for AGIs $75k-100k)
Profit/loss from business: +$1,000 (reported on 12.4% of returns)
Here:
+$1,000
State:
+$11,771
Profit/loss from farming: +$1,478 (reported on 10.8% of returns)
Here:
+$1,478
State:
+$2,327
IRA payment deduction: $3,136 (reported on 5.2% of returns)
60951:
$3,136
Illinois:
$3,087
Total itemized deductions: $16,000 (23% of AGI, reported on 25.1% of returns)
Here:
$16,000
State:
$20,239
Here:
23.5% of AGI
State:
19.5% of AGI
(% of AGI for various income ranges: 11.0% for AGIs $10k-25k, 8.2% for AGIs $25k-50k, 9.5% for AGIs $50k-75k, 12.3% for AGIs $75k-100k, 10.5% for AGIs over 100k)
Charity contributions deductions: $2,551 (4% of AGI, reported on 20.9% of returns)
Here:
$2,551
State:
$3,719
Here:
3.5% of AGI
State:
3.4% of AGI
(% of AGI for various income ranges: 0.7% for AGIs $25k-50k, 1.6% for AGIs $50k-75k, 2.1% for AGIs $75k-100k, 1.6% for AGIs over 100k)
Total tax: $5,064 (reported on 77.0% of returns)
60951:
$5,064
State:
$9,882
(% of AGI for various income ranges: 4.1% for AGIs below $10k, 5.5% for AGIs $10k-25k, 6.7% for AGIs $25k-50k, 9.3% for AGIs $50k-75k, 9.8% for AGIs $75k-100k, 15.7% for AGIs over 100k)
Earned income credit: $1,700 (reported on 11.7% of returns)
Here:
$1,700
State:
$1,788
Percentage of individuals using paid preparers for their 2004 taxes: 77.5%
Here:
77%
State:
61%
(% for various income ranges: 72.5% for AGIs below $10k, 73.9% for AGIs $10k-25k, 80.0% for AGIs $25k-50k, 83.0% for AGIs $50k-75k, 73.5% for AGIs $75k-100k, 81.8% for AGIs over 100k)
Likely homosexual households (counted as self-reported same-sex unmarried-partner households)
Lesbian couples: 0.6% of all households
Gay men: 0.0% of all households
Household received Food Stamps/SNAP in the past 12 months: 40 Household did not receive Food Stamps/SNAP in the past 12 months: 281
Women who did not have a birth in the past 12 months: 121 (81 now married, 38 unmarried)
Housing units in zip code 60951 with a mortgage: 156 (11 second mortgage, 8 both second mortgage and home equity loan) Median monthly owner costs for units with a mortgage: $1,287 Median monthly owner costs for units without a mortgage: $549
Residents with income below the poverty level in 2022:
This zip code:
11.4%
Whole state:
11.9%
Residents with income below 50% of the poverty level in 2022:
This zip code:
4.3%
Whole state:
5.7%
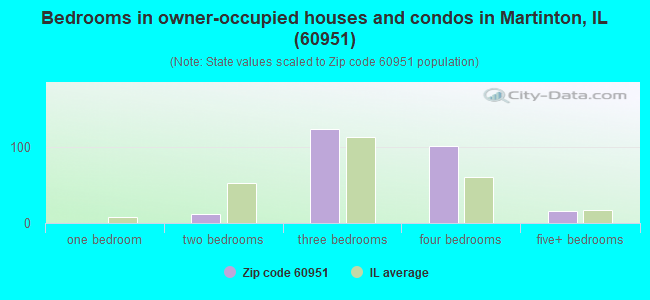
Median number of rooms in houses and condos:
Here:
7.3
State:
6.4
Median number of rooms in apartments:
Here:
4.0
State:
4.1
Notable locations in this zip code not listed on our city pages
Size of family households: 107 2-persons, 45 3-persons, 9 4-persons, 32 5-persons, 6 7-or-more-persons
Size of nonfamily households: 102 1-person, 18 2-persons
117 married couples with children.
11 single-parent households (7 men, 4 women).
95.2% of residents of 60951 zip code speak English at home.
2.9% of residents speak Spanish at home (80% very well, 20% well).
1.3% of residents speak other Indo-European language at home (100% very well).
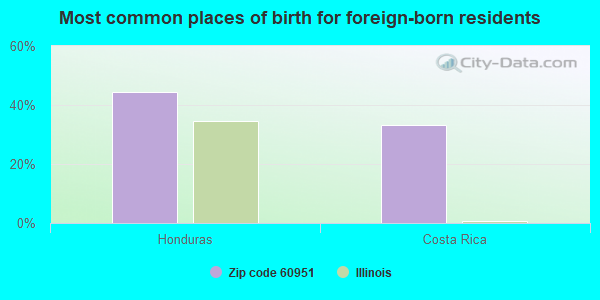
Foreign born population: 9 (1.2%) (89.0% of them are naturalized citizens)
This zip code:
1.2%
Whole state:
14.4%
44%Honduras
33%Costa Rica
16%American
16%German
11%Irish
10%French
10%French Canadian
8%English
4%Swedish
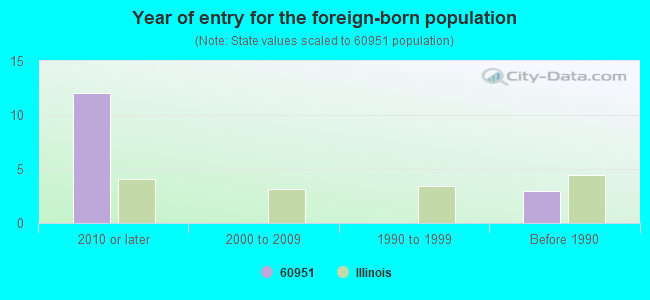
Year of entry for the foreign-born population
122010 or later
02000 to 2009
01990 to 1999
3Before 1990
Facilities with environmental interests located in this zip code:
MARTINTON FERTILIZER CO (103 NORTH STREET in MARTINTON, IL)
STATE MASTER (Illinois EPA Project) - AIR PROGRAM AIR MINOR (AIRS/AFS) Business SIC classification: NONCLASSIFIABLE ESTABLISHMENTS
MARTINTON FERT (RR 1 in MARTINTON, IL)
COMPLIANCE ACTIVITY (Tracking inspections of insecticide, fungicide, and rodenticide, and toxic substances)
Housing units lacking complete plumbing facilities: 5.1% Housing units lacking complete kitchen facilities: 0.9%
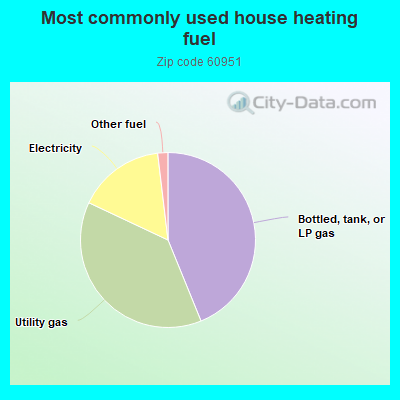
44.1%Bottled, tank, or LP gas
38.4%Utility gas
16.2%Electricity
1.9%Other fuel
Population in 1990: 1,004. Population change in the 1990s: +170 (+16.9%).
Place of birth for U.S.-born residents:
This state: 580
Northeast: 2
Midwest: 62
South: 62
West: 22
73% of the 60951 zip code residents lived in the same house 5 years ago. Out of people who lived in different houses, 52% lived in this county. Out of people who lived in different counties, 50% lived in Illinois.
89% of the 60951 zip code residents lived in the same house 1 year ago. Out of people who lived in different houses, 17% moved from this county. Out of people who lived in different houses, 71% moved from different county within same state. Out of people who lived in different houses, 13% moved from different state.
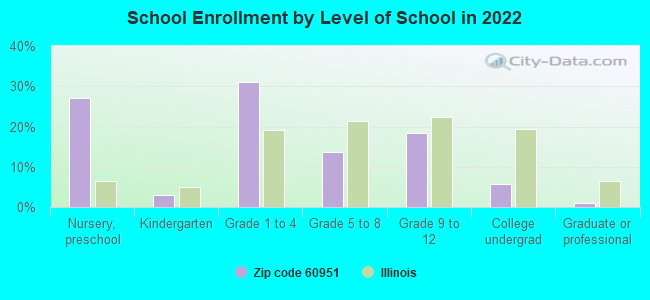
Private vs. public school enrollment:
Students in private schools in grades 1 to 8 (elementary and middle school): 13
Here:
28.2%
Illinois:
13.3%
Students in private schools in grades 9 to 12 (high school): 1
Here:
9.7%
Illinois:
9.9%
Students in private undergraduate colleges:
Here:
0.0%
Illinois:
27.4%
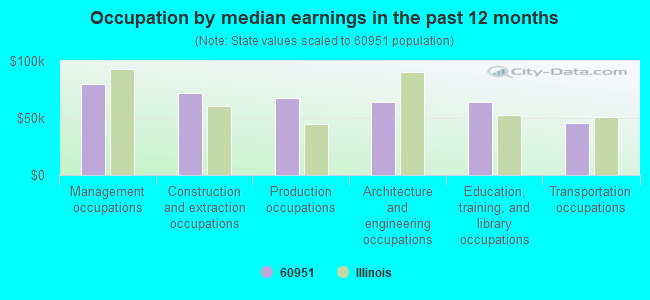
Occupation by median earnings in the past 12 months ($)
79,722Management occupations
71,881Construction and extraction occupations
67,436Production occupations
64,183Architecture and engineering occupations
64,038Education, training, and library occupations
45,177Transportation occupations
Top industries in this zip code by the number of employees in 2005:
Other Services (except Public Administration): General Automotive Repair (1-4 employees: 1 establishment)
Fatal accident statistics in 2013:
Fatal accident count: 1
Vehicles involved in fatal accidents: 1
Fatal accidents caused by drunken drivers: 0
Fatalities: 1
Persons involved in fatal accidents: 1
Pedestrians involved in fatal accidents: 0
Fatal accident statistics in 2011:
Fatal accident count: 1
Vehicles involved in fatal accidents: 1
Fatal accidents caused by drunken drivers: 1
Fatalities: 1
Persons involved in fatal accidents: 1
Pedestrians involved in fatal accidents: 1
2002 - 2018 National Fire Incident Reporting System (NFIRS) incidents
Based on the data from the years 2002 - 2018 the average number of fire incidents per year is 11. The highest number of reported fire incidents - 26 took place in 2018, and the least - 1 in 2003. The data has a growing trend.
When looking into fire subcategories, the most incidents belonged to: Structure Fires (51.0%), and Outside Fires (34.5%).
Fire incident types reported to NFIRS in Zip Code 60951

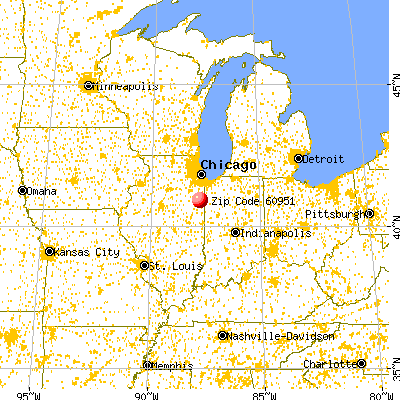


 Nearest zip codes: 60970, 60964, 60912, 60931, 60910, 60922.


 Based on the data from the years 2002 - 2018 the average number of fire incidents per year is 11. The highest number of reported fire incidents - 26 took place in 2018, and the least - 1 in 2003. The data has a growing trend.
 When looking into fire subcategories, the most incidents belonged to: Structure Fires (51.0%), and Outside Fires (34.5%).