Estimated zip code population in 2022: 2,410 Zip code population in 2010: 2,469 Zip code population in 2000: 2,537
Houses and condos: 1,091 Renter-occupied apartments: 195
% of renters here:
20%
State:
33%
March 2022 cost of living index in zip code 60953: 83.9 (less than average, U.S. average is 100)
Land area: 148.6 sq. mi. Water area: 0.0 sq. mi.
Population density: 16 people per square mile
(very low).
OSM Map
General Map
Google Map
MSN Map
OSM Map
General Map
Google Map
MSN Map
OSM Map
General Map
Google Map
MSN Map
OSM Map
General Map
Google Map
MSN Map
Please wait while loading the map...
Real estate property taxes paid for housing units in 2022:
This zip code:
2.0% ($1,839)
Illinois:
2.0% ($4,912)
Median real estate property taxes paid for housing units with mortgages in 2022: $1,577 (1.9%) Median real estate property taxes paid for housing units with no mortgage in 2022: $2,336 (2.1%)
Averages for the 2020 tax year for zip code 60953, filed in 2021:
Average Adjusted Gross Income (AGI) in 2020: $55,021 (Individual Income Tax Returns)
Here:
$55,021
State:
$82,626
Salary/wage: $42,314 (reported on 78.4% of returns)
Here:
$42,314
State:
$66,640
(% of AGI for various income ranges: 1126.7% for AGIs below $25k, 3571.4% for AGIs $25k-50k, 6439.0% for AGIs $50k-75k, 11100.0% for AGIs $75k-100k, 21843.3% for AGIs $100k-200k)
Taxable interest for individuals: $1,637 (reported on 37.3% of returns)
This zip code:
$1,637
Illinois:
$2,376
(% of AGI for various income ranges: 27.1% for AGIs below $25k, 37.6% for AGIs $25k-50k, 82.0% for AGIs $50k-75k, 187.5% for AGIs $75k-100k, 435.0% for AGIs $100k-200k)
Ordinary dividends: $2,814 (reported on 21.6% of returns)
Here:
$2,814
State:
$9,061
(% of AGI for various income ranges: 12.9% for AGIs below $25k, 21.0% for AGIs $25k-50k, 85.0% for AGIs $50k-75k, 167.5% for AGIs $75k-100k, 660.0% for AGIs $100k-200k)
Net capital gain/loss in AGI: +$10,676 (reported on 16.7% of returns)
Here:
+$10,676
State:
+$31,684
(% of AGI for various income ranges: 7.6% for AGIs below $25k, 10.5% for AGIs $25k-50k, 43.0% for AGIs $50k-75k, 52.5% for AGIs $75k-100k, 2855.0% for AGIs $100k-200k)
Profit/loss from business: +$7,187 (reported on 14.7% of returns)
Here:
+$7,187
State:
+$12,175
(% of AGI for various income ranges: 139.5% for AGIs below $25k, 138.1% for AGIs $25k-50k, 252.0% for AGIs $50k-75k, 405.0% for AGIs $100k-200k)
Taxable individual retirement arrangement distribution: $10,067 (reported on 11.8% of returns)
60953:
$10,067
Illinois:
$21,613
(% of AGI for various income ranges: 45.7% for AGIs below $25k, 138.6% for AGIs $25k-50k, 340.0% for AGIs $50k-75k, 801.7% for AGIs $100k-200k)
Total itemized deductions: $32,000 (reported on 2.9% of returns)
Here:
$32,000
State:
$34,948
(% of AGI for various income ranges: 960.0% for AGIs $50k-75k)
Taxes paid: $4,633 (reported on 2.9% of returns)
60953:
$4,633
State:
$8,563
(% of AGI for various income ranges: 139.0% for AGIs $50k-75k)
Earned income credit: $2,053 (reported on 18.6% of returns)
Here:
$2,053
State:
$2,311
(% of AGI for various income ranges: 106.7% for AGIs below $25k, 79.0% for AGIs $25k-50k)
Percentage of individuals using paid preparers for their 2020 taxes: 90.2%
Here:
90%
State:
93%
(% for various income ranges: 88.2% for AGIs below $25k, 92.9% for AGIs $25k-50k, 87.5% for AGIs $50k-75k, 87.5% for AGIs $75k-100k, 92.9% for AGIs $100k-200k, 100.0% for AGIs over 200k)
Averages for the 2012 tax year for zip code 60953, filed in 2013:
Average Adjusted Gross Income (AGI) in 2012: $57,538 (Individual Income Tax Returns)
Here:
$57,538
State:
$68,058
Salary/wage: $35,197 (reported on 82.1% of returns)
Here:
$35,197
State:
$55,396
(% of AGI for various income ranges: 70.9% for AGIs below $25k, 77.3% for AGIs $25k-50k, 63.7% for AGIs $50k-75k, 75.5% for AGIs $75k-100k, 54.5% for AGIs $100k-200k, 6.0% for AGIs over 200k)
Taxable interest for individuals: $1,093 (reported on 41.5% of returns)
This zip code:
$1,093
Illinois:
$1,969
(% of AGI for various income ranges: 2.2% for AGIs below $25k, 0.6% for AGIs $25k-50k, 0.9% for AGIs $50k-75k, 0.5% for AGIs $75k-100k, 0.7% for AGIs $100k-200k, 0.6% for AGIs over 200k)
Ordinary dividends: $1,762 (reported on 22.6% of returns)
Here:
$1,762
State:
$7,786
(% of AGI for various income ranges: 0.7% for AGIs below $25k, 0.2% for AGIs $25k-50k, 0.3% for AGIs $50k-75k, 0.3% for AGIs $75k-100k, 2.7% for AGIs $100k-200k)
Net capital gain/loss in AGI: +$9,813 (reported on 14.2% of returns)
Here:
+$9,813
State:
+$22,183
(% of AGI for various income ranges: 0.3% for AGIs $25k-50k, 0.6% for AGIs $50k-75k, 0.4% for AGIs $75k-100k, 12.0% for AGIs $100k-200k)
Profit/loss from business: +$6,947 (reported on 16.0% of returns)
Here:
+$6,947
State:
+$12,903
(% of AGI for various income ranges: 5.3% for AGIs below $25k, 3.4% for AGIs $25k-50k, 2.8% for AGIs $50k-75k, 2.7% for AGIs $100k-200k)
Taxable individual retirement arrangement distribution: $7,608 (reported on 11.3% of returns)
60953:
$7,608
Illinois:
$17,929
(% of AGI for various income ranges: 3.3% for AGIs below $25k, 1.5% for AGIs $25k-50k, 2.4% for AGIs $50k-75k, 3.1% for AGIs $100k-200k)
Self-employment retirement plans: $19,200 (reported on 1.9% of returns)
60953:
$19,200
Illinois:
$24,666
(% of AGI for various income ranges: 3.8% for AGIs $50k-75k)
Total itemized deductions: $19,689 (14% of AGI, reported on 17.0% of returns)
Here:
$19,689
State:
$26,433
Here:
13.5% of AGI
State:
19.2% of AGI
(% of AGI for various income ranges: 8.7% for AGIs $25k-50k, 6.9% for AGIs $50k-75k, 5.1% for AGIs $75k-100k, 14.2% for AGIs $100k-200k)
Charity contributions: $4,115 (reported on 12.3% of returns)
Here:
$4,115
State:
$4,525
(% of AGI for various income ranges: 0.8% for AGIs $25k-50k, 1.5% for AGIs $50k-75k, 2.8% for AGIs $100k-200k)
Taxes paid: $7,917 (reported on 17.0% of returns)
60953:
$7,917
State:
$11,968
(% of AGI for various income ranges: 1.7% for AGIs $25k-50k, 1.7% for AGIs $50k-75k, 2.0% for AGIs $75k-100k, 8.1% for AGIs $100k-200k)
Earned income credit: $2,167 (reported on 19.8% of returns)
Here:
$2,167
State:
$2,349
(% of AGI for various income ranges: 6.2% for AGIs below $25k, 1.4% for AGIs $25k-50k)
Percentage of individuals using paid preparers for their 2012 taxes: 75.5%
Here:
75%
State:
57%
(% for various income ranges: 68.2% for AGIs below $25k, 76.0% for AGIs $25k-50k, 81.2% for AGIs $50k-75k, 77.8% for AGIs $75k-100k, 88.9% for AGIs $100k-200k, 100.0% for AGIs over 200k)
Averages for the 2004 tax year for zip code 60953, filed in 2005:
Average Adjusted Gross Income (AGI) in 2004: $34,693 (Individual Income Tax Returns)
Here:
$34,693
State:
$54,625
Salary/wage: $28,928 (reported on 81.7% of returns)
Here:
$28,928
State:
$46,811
(% of AGI for various income ranges: 91.9% for AGIs below $10k, 70.4% for AGIs $10k-25k, 73.3% for AGIs $25k-50k, 79.4% for AGIs $50k-75k, 71.0% for AGIs $75k-100k, 42.4% for AGIs over 100k)
Taxable interest for individuals: $1,785 (reported on 52.2% of returns)
This zip code:
$1,785
Illinois:
$2,101
(% of AGI for various income ranges: 9.4% for AGIs below $10k, 5.1% for AGIs $10k-25k, 2.6% for AGIs $25k-50k, 0.9% for AGIs $50k-75k, 0.9% for AGIs $75k-100k, 3.4% for AGIs over 100k)
Taxable dividends: $1,736 (reported on 20.8% of returns)
Here:
$1,736
State:
$4,306
(% of AGI for various income ranges: 3.0% for AGIs below $10k, 0.8% for AGIs $10k-25k, 0.4% for AGIs $25k-50k, 0.3% for AGIs $50k-75k, 1.1% for AGIs $75k-100k, 2.6% for AGIs over 100k)
Net capital gain/loss: +$3,408 (reported on 16.0% of returns)
Here:
+$3,408
State:
+$17,321
(% of AGI for various income ranges: -2.6% for AGIs below $10k, 0.6% for AGIs $10k-25k, 0.5% for AGIs $25k-50k, 0.2% for AGIs $50k-75k, 1.0% for AGIs $75k-100k, 6.0% for AGIs over 100k)
Profit/loss from business: +$4,145 (reported on 14.5% of returns)
Here:
+$4,145
State:
+$11,771
(% of AGI for various income ranges: -3.1% for AGIs below $10k, 1.2% for AGIs $10k-25k, 2.9% for AGIs $25k-50k, 2.2% for AGIs $50k-75k, 1.7% for AGIs over 100k)
Profit/loss from farming: +$12,366 (reported on 9.8% of returns)
Here:
+$12,366
State:
+$2,327
(% of AGI for various income ranges: -5.6% for AGIs below $10k, 1.2% for AGIs $10k-25k, 3.4% for AGIs $25k-50k, 5.6% for AGIs $50k-75k, 5.9% for AGIs over 100k)
IRA payment deduction: $2,727 (reported on 2.9% of returns)
60953:
$2,727
Illinois:
$3,087
Self-employed pension: $3,300 (reported on 0.9% of returns)
Here:
$3,300
Illinois:
$16,965
Total itemized deductions: $15,447 (26% of AGI, reported on 16.6% of returns)
Here:
$15,447
State:
$20,239
Here:
26.2% of AGI
State:
19.5% of AGI
(% of AGI for various income ranges: 14.4% for AGIs below $10k, 9.6% for AGIs $10k-25k, 7.3% for AGIs $25k-50k, 7.2% for AGIs $50k-75k, 5.9% for AGIs $75k-100k, 6.1% for AGIs over 100k)
Charity contributions deductions: $3,267 (5% of AGI, reported on 13.1% of returns)
Here:
$3,267
State:
$3,719
Here:
5.2% of AGI
State:
3.4% of AGI
(% of AGI for various income ranges: 1.3% for AGIs $10k-25k, 1.1% for AGIs $25k-50k, 1.1% for AGIs $50k-75k, 1.9% for AGIs $75k-100k, 1.3% for AGIs over 100k)
Total tax: $4,846 (reported on 70.9% of returns)
60953:
$4,846
State:
$9,882
(% of AGI for various income ranges: 2.4% for AGIs below $10k, 3.6% for AGIs $10k-25k, 7.0% for AGIs $25k-50k, 8.7% for AGIs $50k-75k, 11.6% for AGIs $75k-100k, 19.3% for AGIs over 100k)
Earned income credit: $1,765 (reported on 17.1% of returns)
Here:
$1,765
State:
$1,788
Percentage of individuals using paid preparers for their 2004 taxes: 75.1%
Here:
75%
State:
61%
(% for various income ranges: 67.7% for AGIs below $10k, 77.4% for AGIs $10k-25k, 75.8% for AGIs $25k-50k, 78.3% for AGIs $50k-75k, 66.7% for AGIs $75k-100k, 93.3% for AGIs over 100k)
Household received Food Stamps/SNAP in the past 12 months: 181 Household did not receive Food Stamps/SNAP in the past 12 months: 786
Women who had a birth in the past 12 months: 43 (28 now married, 14 unmarried) Women who did not have a birth in the past 12 months: 494 (193 now married, 300 unmarried)
Housing units in zip code 60953 with a mortgage: 370 (23 second mortgage, 7 both second mortgage and home equity loan) Median monthly owner costs for units with a mortgage: $1,014 Median monthly owner costs for units without a mortgage: $501
Residents with income below the poverty level in 2022:
This zip code:
9.9%
Whole state:
11.9%
Residents with income below 50% of the poverty level in 2022:
This zip code:
6.2%
Whole state:
5.7%
Median number of rooms in houses and condos:
Here:
6.4
State:
6.4
Median number of rooms in apartments:
Here:
4.4
State:
4.1
Notable locations in this zip code not listed on our city pages
Notable locations in zip code 60953: Milford District Library (A), Stockland Fire Protection District (B), Milford Fire Protection District (C). Display/hide their locations on the map
Churches in zip code 60953 include: Sugar Creek Chapel (A), First Christian Church (B), First Methodist Episcopal Church (C), Nazarene Church (D), Our Saviour Evangelical Lutheran Church (E). Display/hide their locations on the map
Cemeteries: Vennum Cemetery (1), Amity Cemetery (2), Maple Grove Cemetery (3), Old Milford Cemetery (4), Schwer Cemetery (5), Saint Paul Lutheran Cemetery (6), Sugar Creek Chapel Cemetery (7). Display/hide their locations on the map
434 married couples with children.
109 single-parent households (9 men, 100 women).
98.3% of residents of 60953 zip code speak English at home.
0.5% of residents speak Spanish at home (42% very well, 58% not well).
0.7% of residents speak other Indo-European language at home (47% well, 53% not well).
Foreign born population: 44 (1.8%) (100.0% of them are naturalized citizens)
This zip code:
1.8%
Whole state:
14.4%
48%Greece
41%United Kingdom, excluding England and Scotland
39%Sweden
14%Belgium
36%German
16%English
14%American
5%European
2%Italian
2%Eastern European
1%French
Year of entry for the foreign-born population
1012010 or later
192000 to 2009
01990 to 1999
52Before 1990
Facilities with environmental interests located in this zip code:
MILFORD STP (EAST COUNTY HIGHWAY 9 in MILFORD, IL)
STATE MASTER (Illinois EPA Project) - National Pollutant Discharge Elimination System Permit National Pollutant Discharge Elimination System NON-MAJOR (Tracking pollutant discharge elimination systems) - permit National Pollutant Discharge Elimination System NON-MAJOR (Tracking pollutant discharge elimination systems) - permit Business SIC classification: SEWERAGE SYSTEMS Alternative names: MILFORD STP, VILLAGE OF, MILFORD, VILLAGE OF
MILFORD BULK PLANT (1ST RD NORTH, OFF STATE RTE. 1 in MILFORD, IL)
STATE MASTER (Illinois EPA Project) - AIR PROGRAM AIR MINOR (AIRS/AFS) CRITERIA AND HAZARDOUS AIR POLLUTANT INVENTORY (Inventory of air pollution sources) Business SIC classification: PETROLEUM BULK STATIONS AND TERMINALS Alternative names: GARY GILLINS, GILLINS OILS CO.
MILFORD GRADE SCHOOL (PO BOX 228 in MILFORD, IL)
(Geographic Names Information System) (National Center for Education Statistics) - STATE ID-3203828002001 Organizations: MILFORD COMM CONS SCH DIST 280 (SCHOOL DISTRICT)
MILFORD HIGH SCHOOL (PO BOX 257 in MILFORD, IL)
(Geographic Names Information System) (National Center for Education Statistics) - STATE ID-3203823300001 Organizations: MILFORD TWP HIGH SCH DIST 233 (SCHOOL DISTRICT)
HOWARD INDUSTRIES INC. (1 NORTH DIXIE HIGHWAY in MILFORD, IL)
AIR MINOR (AIRS/AFS) TRI REPORTER (Tracking of toxic chemicals releasing facilities) Business SIC classification: INDUSTRIAL AND COMMERCIAL FANS AND BLOWERS AND AIR PURIFICATION EQUIPMENT; MOTORS AND GENERATORS
ILLINOIS WASTE SYSTEMS LANDFILL (COUNTY ROAD 9 AT CHICAGO AND EASTERN in MILFORD, IL)
AIR MINOR (AIRS/AFS) CRITERIA AND HAZARDOUS AIR POLLUTANT INVENTORY (Inventory of air pollution sources) Business SIC classification: REFUSE SYSTEMS Business NAICS classification: SOLID WASTE LANDFILL.
RAVENS FARMS INC (RR 2 BOX 243 in MILFORD, IL)
National Pollutant Discharge Elimination System NON-MAJOR (Tracking pollutant discharge elimination systems) - permit
MSL INDUSTRIES INC (NORTH DIXIE HWY in MILFORD, IL)
Small Quantity Generators, between 100 kg and 1000 kg of hazardous waste/month (Resource Conservation and Recovery Act (tracking hazardous waste)) - notification
ILDOT BRG 038-0024 (FAP 332 UNDER RAILROAD in MILFORD, IL)
Small Quantity Generators, between 100 kg and 1000 kg of hazardous waste/month (Resource Conservation and Recovery Act (tracking hazardous waste)) - notification Organizations: IL DEPT OF TRANSPORTATION (CONTACT/OWNER)
REMINGTON HYBRID SEED CO INC (3MI N RTE 1/BOX 305 in MILFORD, IL)
Small Quantity Generators, between 100 kg and 1000 kg of hazardous waste/month (Resource Conservation and Recovery Act (tracking hazardous waste)) - notification
Housing units lacking complete plumbing facilities: 3.4% Housing units lacking complete kitchen facilities: 1.0%
59.6%Utility gas
20.3%Bottled, tank, or LP gas
18.6%Electricity
1.6%Other fuel
Population in 1990: 2,367. Population change in the 1990s: +170 (+7.2%).
Place of birth for U.S.-born residents:
This state: 1,940
Northeast: 27
Midwest: 200
South: 53
West: 21
66% of the 60953 zip code residents lived in the same house 5 years ago. Out of people who lived in different houses, 66% lived in this county. Out of people who lived in different counties, 50% lived in Illinois.
90% of the 60953 zip code residents lived in the same house 1 year ago. Out of people who lived in different houses, 81% moved from this county. Out of people who lived in different houses, 2% moved from different county within same state. Out of people who lived in different houses, 13% moved from different state.
Private vs. public school enrollment:
Students in private schools in grades 1 to 8 (elementary and middle school): 59
Here:
25.1%
Illinois:
13.3%
Students in private schools in grades 9 to 12 (high school):
Here:
0.0%
Illinois:
9.9%
Students in private undergraduate colleges:
Here:
0.0%
Illinois:
27.4%
Occupation by median earnings in the past 12 months ($)
73,301Management occupations
55,049Sales and related occupations
54,212Community and social service occupations
52,731Business and financial operations occupations
52,444Transportation occupations
49,404Health diagnosing and treating practitioners and other technical occupations
Top industries in this zip code by the number of employees in 2005:
Other Services (except Public Administration): Religious Organizations (10-19 employees: 1 establishment, 1-4 employees: 3 establishments)
Accommodation and Food Services: Full-Service Restaurants (10-19: 1, 1-4: 1)
Finance and Insurance: Commercial Banking (10-19: 1)
Wholesale Trade: Farm and Garden Machinery and Equipment Merchant Wholesalers (10-19: 1)
Wholesale Trade: Wholesale Trade Agents and Brokers (10-19: 1)
Health Care and Social Assistance: Residential Mental Retardation Facilities (10-19: 1)
Accommodation and Food Services: Limited-Service Restaurants (5-9: 1)
Fatal accident statistics in 2010:
Fatal accident count: 1
Vehicles involved in fatal accidents: 1
Fatal accidents caused by drunken drivers: 0
Fatalities: 1
Persons involved in fatal accidents: 1
Pedestrians involved in fatal accidents: 0
2002 - 2018 National Fire Incident Reporting System (NFIRS) incidents
Based on the data from the years 2002 - 2018 the average number of fire incidents per year is 6. The highest number of reported fire incidents - 19 took place in 2010, and the least - 1 in 2002. The data has a growing trend.
When looking into fire subcategories, the most incidents belonged to: Structure Fires (47.1%), and Outside Fires (31.4%).
Fire incident types reported to NFIRS in Zip Code 60953

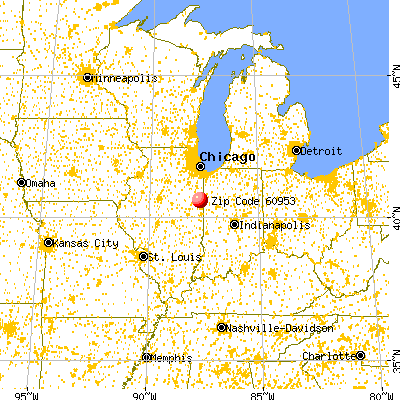


 Nearest zip codes: 60973, 60974, 60926, 60966, 60942, 60970.


 Based on the data from the years 2002 - 2018 the average number of fire incidents per year is 6. The highest number of reported fire incidents - 19 took place in 2010, and the least - 1 in 2002. The data has a growing trend.
 When looking into fire subcategories, the most incidents belonged to: Structure Fires (47.1%), and Outside Fires (31.4%).