Estimated zip code population in 2022: 1,851 Zip code population in 2010: 1,901 Zip code population in 2000: 2,045
Houses and condos: 725 Renter-occupied apartments: 63
% of renters here:
10%
State:
33%
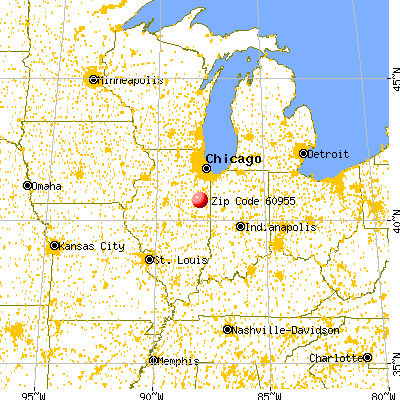
March 2022 cost of living index in zip code 60955: 73.9 (low, U.S. average is 100)
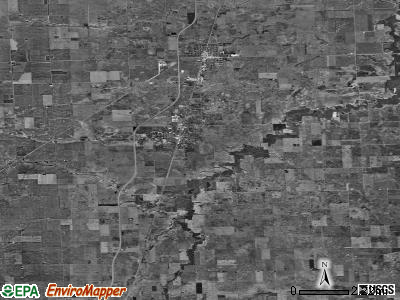
Land area: 87.1 sq. mi. Water area: 0.0 sq. mi.
Population density: 21 people per square mile
(very low).
OSM Map
General Map
Google Map
MSN Map
OSM Map
General Map
Google Map
MSN Map
OSM Map
General Map
Google Map
MSN Map
OSM Map
General Map
Google Map
MSN Map
Please wait while loading the map...
Real estate property taxes paid for housing units in 2022:
This zip code:
1.6% ($1,869)
Illinois:
2.0% ($4,912)
Median real estate property taxes paid for housing units with mortgages in 2022: $2,380 (1.6%) Median real estate property taxes paid for housing units with no mortgage in 2022: $1,726 (1.6%)
Business Search- 14 Million verified businesses
Males: 940
(50.8%)
Females: 910
(49.2%)
For population 25 years and over in 60955:
High school or higher: 74.0%
Bachelor's degree or higher: 11.3%
Graduate or professional degree: 3.3%
Unemployed: 5.8%
Mean travel time to work (commute): 21.6 minutes
For population 15 years and over in 60955:
Never married: 32.1%
Now married: 53.2%
Separated: 0.8%
Widowed: 7.2%
Divorced: 6.7%
Zip code 60955 compared to state average:
Median house value below state average.
Black race population percentage significantly below state average.
Hispanic race population percentage above state average.
Renting percentage significantly below state average.
Length of stay since moving in significantly above state average.
Number of college students significantly below state average.
Percentage of population with a bachelor's degree or higher significantly below state average.
Averages for the 2020 tax year for zip code 60955, filed in 2021:
Average Adjusted Gross Income (AGI) in 2020: $52,320 (Individual Income Tax Returns)
Here:
$52,320
State:
$82,626
Salary/wage: $40,171 (reported on 84.4% of returns)
Here:
$40,171
State:
$66,640
(% of AGI for various income ranges: 1461.4% for AGIs below $25k, 3863.8% for AGIs $25k-50k, 6827.5% for AGIs $50k-75k, 9352.0% for AGIs $75k-100k, 18418.0% for AGIs $100k-200k)
Taxable interest for individuals: $1,132 (reported on 34.4% of returns)
This zip code:
$1,132
Illinois:
$2,376
(% of AGI for various income ranges: 15.2% for AGIs below $25k, 23.3% for AGIs $25k-50k, 88.8% for AGIs $50k-75k, 162.0% for AGIs $75k-100k, 236.0% for AGIs $100k-200k)
Ordinary dividends: $3,512 (reported on 17.8% of returns)
Here:
$3,512
State:
$9,061
(% of AGI for various income ranges: 14.8% for AGIs below $25k, 29.5% for AGIs $25k-50k, 150.0% for AGIs $50k-75k, 192.0% for AGIs $75k-100k, 506.0% for AGIs $100k-200k)
Net capital gain/loss in AGI: +$7,350 (reported on 13.3% of returns)
Here:
+$7,350
State:
+$31,684
(% of AGI for various income ranges: 39.0% for AGIs $25k-50k, 216.0% for AGIs $75k-100k, 1386.0% for AGIs $100k-200k)
Profit/loss from business: +$4,190 (reported on 11.1% of returns)
Here:
+$4,190
State:
+$12,175
(% of AGI for various income ranges: 72.9% for AGIs below $25k, 22.4% for AGIs $25k-50k, 102.5% for AGIs $50k-75k, 274.0% for AGIs $100k-200k)
Taxable individual retirement arrangement distribution: $17,167 (reported on 10.0% of returns)
60955:
$17,167
Illinois:
$21,613
(% of AGI for various income ranges: 236.7% for AGIs $25k-50k, 2096.0% for AGIs $75k-100k)
Total itemized deductions: $30,900 (reported on 2.2% of returns)
Here:
$30,900
State:
$34,948
(% of AGI for various income ranges: 294.3% for AGIs below $25k)
Taxes paid: $4,900 (reported on 2.2% of returns)
60955:
$4,900
State:
$8,563
(% of AGI for various income ranges: 46.7% for AGIs below $25k)
Earned income credit: $2,329 (reported on 15.6% of returns)
Here:
$2,329
State:
$2,311
(% of AGI for various income ranges: 87.6% for AGIs below $25k, 67.6% for AGIs $25k-50k)
Percentage of individuals using paid preparers for their 2020 taxes: 92.2%
Here:
92%
State:
93%
(% for various income ranges: 90.0% for AGIs below $25k, 89.3% for AGIs $25k-50k, 100.0% for AGIs $50k-75k, 88.9% for AGIs $75k-100k, 100.0% for AGIs $100k-200k)
Averages for the 2012 tax year for zip code 60955, filed in 2013:
Average Adjusted Gross Income (AGI) in 2012: $44,998 (Individual Income Tax Returns)
Here:
$44,998
State:
$68,058
Salary/wage: $31,057 (reported on 85.3% of returns)
Here:
$31,057
State:
$55,396
(% of AGI for various income ranges: 82.0% for AGIs below $25k, 84.0% for AGIs $25k-50k, 60.6% for AGIs $50k-75k, 61.7% for AGIs $75k-100k, 33.2% for AGIs $100k-200k)
Taxable interest for individuals: $1,165 (reported on 35.8% of returns)
This zip code:
$1,165
Illinois:
$1,969
(% of AGI for various income ranges: 1.6% for AGIs below $25k, 0.6% for AGIs $25k-50k, 1.4% for AGIs $50k-75k, 0.6% for AGIs $75k-100k, 0.8% for AGIs $100k-200k)
Ordinary dividends: $2,712 (reported on 16.8% of returns)
Here:
$2,712
State:
$7,786
(% of AGI for various income ranges: 0.8% for AGIs below $25k, 0.4% for AGIs $25k-50k, 2.2% for AGIs $50k-75k, 1.4% for AGIs $100k-200k)
Net capital gain/loss in AGI: +$8,009 (reported on 11.6% of returns)
Here:
+$8,009
State:
+$22,183
(% of AGI for various income ranges: 0.7% for AGIs $50k-75k, 5.5% for AGIs $100k-200k)
Profit/loss from business: +$9,223 (reported on 13.7% of returns)
Here:
+$9,223
State:
+$12,903
(% of AGI for various income ranges: 4.8% for AGIs below $25k, 3.4% for AGIs $25k-50k, 2.8% for AGIs $50k-75k, 6.9% for AGIs $75k-100k)
Taxable individual retirement arrangement distribution: $8,489 (reported on 9.5% of returns)
60955:
$8,489
Illinois:
$17,929
(% of AGI for various income ranges: 2.0% for AGIs below $25k, 3.1% for AGIs $25k-50k, 5.7% for AGIs $75k-100k)
Total itemized deductions: $18,394 (20% of AGI, reported on 16.8% of returns)
Here:
$18,394
State:
$26,433
Here:
20.4% of AGI
State:
19.2% of AGI
(% of AGI for various income ranges: 7.0% for AGIs $25k-50k, 7.6% for AGIs $50k-75k, 8.1% for AGIs $75k-100k, 8.2% for AGIs $100k-200k)
Charity contributions: $4,267 (reported on 12.6% of returns)
Here:
$4,267
State:
$4,525
(% of AGI for various income ranges: 1.1% for AGIs below $25k, 1.3% for AGIs $50k-75k, 1.0% for AGIs $75k-100k, 2.1% for AGIs $100k-200k)
Taxes paid: $6,756 (reported on 16.8% of returns)
60955:
$6,756
State:
$11,968
(% of AGI for various income ranges: 1.1% for AGIs below $25k, 1.2% for AGIs $25k-50k, 2.6% for AGIs $50k-75k, 3.4% for AGIs $75k-100k, 3.5% for AGIs $100k-200k)
Earned income credit: $2,190 (reported on 22.1% of returns)
Here:
$2,190
State:
$2,349
(% of AGI for various income ranges: 6.4% for AGIs below $25k, 1.5% for AGIs $25k-50k)
Percentage of individuals using paid preparers for their 2012 taxes: 72.6%
Here:
73%
State:
57%
(% for various income ranges: 65.0% for AGIs below $25k, 70.4% for AGIs $25k-50k, 81.8% for AGIs $50k-75k, 87.5% for AGIs $75k-100k, 88.9% for AGIs $100k-200k)
Averages for the 2004 tax year for zip code 60955, filed in 2005:
Average Adjusted Gross Income (AGI) in 2004: $34,089 (Individual Income Tax Returns)
Here:
$34,089
State:
$54,625
Salary/wage: $28,736 (reported on 85.6% of returns)
Here:
$28,736
State:
$46,811
(% of AGI for various income ranges: 113.2% for AGIs below $10k, 80.1% for AGIs $10k-25k, 82.6% for AGIs $25k-50k, 72.6% for AGIs $50k-75k, 69.9% for AGIs $75k-100k, 44.3% for AGIs over 100k)
Taxable interest for individuals: $1,576 (reported on 47.5% of returns)
This zip code:
$1,576
Illinois:
$2,101
(% of AGI for various income ranges: 6.3% for AGIs below $10k, 3.6% for AGIs $10k-25k, 1.6% for AGIs $25k-50k, 2.0% for AGIs $50k-75k, 1.3% for AGIs $75k-100k, 2.4% for AGIs over 100k)
Taxable dividends: $1,326 (reported on 20.5% of returns)
Here:
$1,326
State:
$4,306
(% of AGI for various income ranges: 2.5% for AGIs below $10k, 0.8% for AGIs $10k-25k, 0.7% for AGIs $25k-50k, 1.5% for AGIs $50k-75k, 0.1% for AGIs $75k-100k, 0.4% for AGIs over 100k)
Net capital gain/loss: +$8,364 (reported on 15.5% of returns)
Here:
+$8,364
State:
+$17,321
(% of AGI for various income ranges: -1.4% for AGIs below $10k, 0.5% for AGIs $10k-25k, -0.1% for AGIs $25k-50k, 2.2% for AGIs $50k-75k, 2.1% for AGIs $75k-100k, 17.2% for AGIs over 100k)
Profit/loss from business: +$5,363 (reported on 12.2% of returns)
Here:
+$5,363
State:
+$11,771
(% of AGI for various income ranges: -2.3% for AGIs below $10k, 2.9% for AGIs $10k-25k, 0.8% for AGIs $25k-50k, 3.7% for AGIs $50k-75k, 3.2% for AGIs $75k-100k)
Profit/loss from farming: +$9,378 (reported on 10.6% of returns)
Here:
+$9,378
State:
+$2,327
(% of AGI for various income ranges: 2.2% for AGIs $10k-25k, 3.0% for AGIs $25k-50k, 5.7% for AGIs $50k-75k, 3.1% for AGIs $75k-100k)
IRA payment deduction: $3,056 (reported on 3.9% of returns)
60955:
$3,056
Illinois:
$3,087
Total itemized deductions: $14,886 (24% of AGI, reported on 16.1% of returns)
Here:
$14,886
State:
$20,239
Here:
23.9% of AGI
State:
19.5% of AGI
(% of AGI for various income ranges: 32.8% for AGIs below $10k, 5.1% for AGIs $10k-25k, 6.3% for AGIs $25k-50k, 5.7% for AGIs $50k-75k, 7.1% for AGIs $75k-100k, 8.2% for AGIs over 100k)
Charity contributions deductions: $2,374 (4% of AGI, reported on 12.4% of returns)
Here:
$2,374
State:
$3,719
Here:
3.6% of AGI
State:
3.4% of AGI
(% of AGI for various income ranges: 0.7% for AGIs $10k-25k, 0.8% for AGIs $25k-50k, 0.6% for AGIs $50k-75k, 0.4% for AGIs $75k-100k, 2.0% for AGIs over 100k)
Total tax: $4,710 (reported on 66.1% of returns)
60955:
$4,710
State:
$9,882
(% of AGI for various income ranges: 2.6% for AGIs below $10k, 3.1% for AGIs $10k-25k, 6.4% for AGIs $25k-50k, 9.7% for AGIs $50k-75k, 11.2% for AGIs $75k-100k, 17.3% for AGIs over 100k)
Earned income credit: $1,639 (reported on 21.0% of returns)
Here:
$1,639
State:
$1,788
Percentage of individuals using paid preparers for their 2004 taxes: 71.7%
Here:
72%
State:
61%
(% for various income ranges: 68.2% for AGIs below $10k, 65.0% for AGIs $10k-25k, 74.4% for AGIs $25k-50k, 78.6% for AGIs $50k-75k, 77.8% for AGIs $75k-100k, 91.4% for AGIs over 100k)
In group quarters: 26 (-1 institutionalized population)
Size of family households: 166 2-persons, 56 3-persons, 104 4-persons, 69 5-persons, 57 6-persons, 11 7-or-more-persons
Size of nonfamily households: 143 1-person, 16 2-persons
243 married couples with children.
175 single-parent households (175 women).
61.6% of residents of 60955 zip code speak English at home.
37.6% of residents speak Spanish at home (55% very well, 16% well, 23% not well, 6% not at all).
0.4% of residents speak other Indo-European language at home (38% very well, 25% well, 38% not at all).
0.1% of residents speak Asian or Pacific Island language at home (100% well).
Foreign born population: 374 (20.2%) (28.5% of them are naturalized citizens)
This zip code:
20.2%
Whole state:
14.4%
95%Honduras
2%Bolivia
2%Chile
16%German
7%American
3%English
2%Irish
2%Dutch
1%Italian
1%French
Year of entry for the foreign-born population
62010 or later
722000 to 2009
1691990 to 1999
117Before 1990
Major facilities with environmental interests located in this zip code:
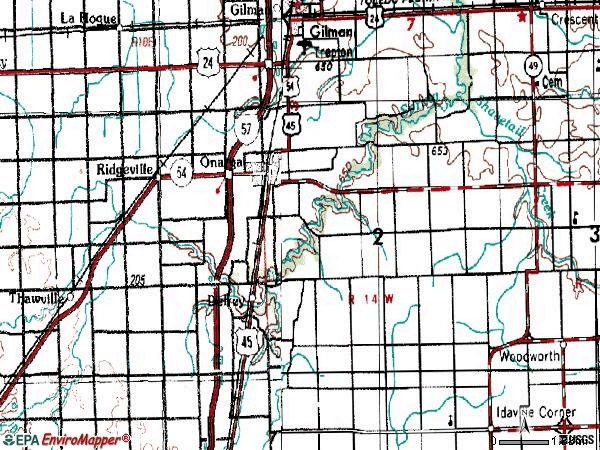
DEL REY FARMERS GRAIN CO (101 W SEMINARY ST in ONARGA, IL)
STATE MASTER (Illinois EPA Project) - AIR PROGRAM, STATE MASTER (Illinois EPA Project) - AIR PROGRAM AIR MINOR (AIRS/AFS) Business SIC classification: GRAIN AND FIELD BEANS
MILLENIUM MARKING (100 JACKSON ST in ONARGA, IL)
STATE MASTER (Illinois EPA Project) - SOLID WASTE PROGRAM, HAZARDOUS WASTE PROGRAM Small Quantity Generators, between 100 kg and 1000 kg of hazardous waste/month (Resource Conservation and Recovery Act (tracking hazardous waste)) - notification Business NAICS classification: MARKING DEVICE MANUFACTURING. Organizations: ERIC MCMILLAN (CONTACT/OPERATOR)
, CRAIG PETERSON (CONTACT/OWNER)
Alternative names: LOUIS MELIND CO, MELIND LOUIS CO
MOBIL OIL CORP (VILLAGE OF in ONARGA, IL)
STATE MASTER (Illinois EPA Project) - AIR PROGRAM AIR MINOR (AIRS/AFS) Business SIC classification: PETROLEUM BULK STATIONS AND TERMINALS
ONARGA ACADEMY - NEXUS INC (110 N LOCUST in ONARGA, IL)
STATE MASTER (Illinois EPA Project) - AIR PROGRAM AIR MINOR (AIRS/AFS) Business SIC classification: NONCLASSIFIABLE ESTABLISHMENTS
ONARGA CROP SERVICE (ONARGA in ONARGA, IL)
STATE MASTER (Illinois EPA Project) - AIR PROGRAM AIR MINOR (AIRS/AFS) Business SIC classification: FERTILIZERS, MIXING ONLY
ONARGA FIRE PROTECTION DISTRICT (500 BLOCK OF GRANT in ONARGA, IL)
STATE MASTER (Illinois EPA Project) - AIR PROGRAM AIR MINOR (AIRS/AFS) Business SIC classification: NONCLASSIFIABLE ESTABLISHMENTS
ONARGA WTP (WILSON AVENUE in ONARGA, IL)
STATE MASTER (Illinois EPA Project) - National Pollutant Discharge Elimination System Permit National Pollutant Discharge Elimination System NON-MAJOR (Tracking pollutant discharge elimination systems) - permit Business SIC classification: WATER SUPPLY Alternative names: ONARGA WTP, VILLAGE OF
IROQUOIS WEST MIDDLE SCHOOL (303 N EVERGREEN ST in ONARGA, IL)
(Geographic Names Information System) (National Center for Education Statistics) - STATE ID-3203801001001 Organizations: IROQUOIS WEST C U S DIST 10 (SCHOOL DISTRICT)
NEXUS EDUCATION CTR (206 E LINCOLN in ONARGA, IL)
(National Center for Education Statistics) - STATE ID-3203880106008 Organizations: IROQUOIS SPECIAL EDUCATION (SCHOOL DISTRICT)
A-WAY GRAIN CO (101 WEST SEMINARY in ONARGA, IL)
AIR MINOR (AIRS/AFS) CRITERIA AND HAZARDOUS AIR POLLUTANT INVENTORY (Inventory of air pollution sources) Business SIC classification: GRAIN AND FIELD BEANS
ILL BELL TEL CO ONARGA C D O (N SIDE OF LINCOLN E OF OAK in ONARGA, IL)
Small Quantity Generators, between 100 kg and 1000 kg of hazardous waste/month (Resource Conservation and Recovery Act (tracking hazardous waste)) - notification
ONARGA STP, VILLAGE OF (113 NORTH CHESTNUT STREET in ONARGA, IL)
National Pollutant Discharge Elimination System NON-MAJOR (Tracking pollutant discharge elimination systems) - permit Business SIC classification: SEWERAGE SYSTEMS
PENIEL CHRISTIAN SCHOOL (E SEMINARY AVE in ONARGA, IL)
COMPLIANCE ACTIVITY (Tracking inspections of insecticide, fungicide, and rodenticide, and toxic substances)
Housing units lacking complete plumbing facilities: 2.6% Housing units lacking complete kitchen facilities: 3.6%
59.9%Utility gas
18.1%Bottled, tank, or LP gas
16.2%Electricity
3.1%Wood
2.1%Other fuel
0.8%Fuel oil, kerosene, etc.
Population in 1990: 1,678. Population change in the 1990s: +367 (+21.9%).
Place of birth for U.S.-born residents:
This state: 1,325
Northeast: 4
Midwest: 58
South: 74
West: 3
67% of the 60955 zip code residents lived in the same house 5 years ago. Out of people who lived in different houses, 58% lived in this county. Out of people who lived in different counties, 50% lived in Illinois.
97% of the 60955 zip code residents lived in the same house 1 year ago. Out of people who lived in different houses, 33% moved from this county. Out of people who lived in different houses, 64% moved from different county within same state. Out of people who lived in different houses, 6% moved from different state.
Private vs. public school enrollment:
Students in private schools in grades 1 to 8 (elementary and middle school): 34
Here:
12.3%
Illinois:
13.3%
Students in private schools in grades 9 to 12 (high school): 22
Here:
13.9%
Illinois:
9.9%
Students in private undergraduate colleges: 7
Here:
31.2%
Illinois:
27.4%
Occupation by median earnings in the past 12 months ($)
62,326Health diagnosing and treating practitioners and other technical occupations
59,326Sales and related occupations
58,641Management occupations
46,473Material moving occupations
46,366Health technologists and technicians
43,727Installation, maintenance, and repair occupations
Top industries in this zip code by the number of employees in 2005:
Health Care and Social Assistance: Residential Mental Retardation Facilities (100-249 employees: 1 establishment)
Other Services (except Public Administration): Commercial and Industrial Machinery and Equipment (except Automotive and Electronic) Repair and Maintenance (5-9: 1)
Finance and Insurance: Commercial Banking (5-9: 1)
Professional, Scientific, and Technical Services: Tax Preparation Services (5-9: 1)
Finance and Insurance: Direct Property and Casualty Insurance Carriers (5-9: 1)
People in group quarters in 2010:
80 people in residential treatment centers for juveniles (non-correctional)
People in group quarters in 2000:
68 people in residential treatment centers for emotionally disturbed children
20 people in other workers' dormitories
Fatal accident statistics in 2010:
Fatal accident count: 1
Vehicles involved in fatal accidents: 1
Fatal accidents caused by drunken drivers: 0
Fatalities: 1
Persons involved in fatal accidents: 3
Pedestrians involved in fatal accidents: 0
2002 - 2018 National Fire Incident Reporting System (NFIRS) incidents
Based on the data from the years 2002 - 2018 the average number of fire incidents per year is 8. The highest number of reported fire incidents - 18 took place in 2012, and the least - 2 in 2006. The data has a growing trend.
When looking into fire subcategories, the most incidents belonged to: Structure Fires (34.8%), and Outside Fires (29.5%).
Fire incident types reported to NFIRS in Zip Code 60955


 Nearest zip codes: 60938, 60918, 60928, 60930, 60968, 60924.


 Based on the data from the years 2002 - 2018 the average number of fire incidents per year is 8. The highest number of reported fire incidents - 18 took place in 2012, and the least - 2 in 2006. The data has a growing trend.
 When looking into fire subcategories, the most incidents belonged to: Structure Fires (34.8%), and Outside Fires (29.5%).