Estimated zip code population in 2022: 1,485 Zip code population in 2010: 1,807 Zip code population in 2000: 1,686
Houses and condos: 627 Renter-occupied apartments: 113
% of renters here:
21%
State:
33%
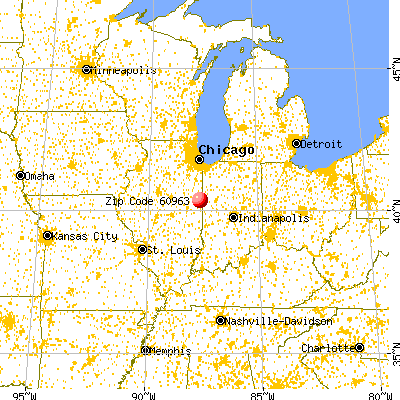
March 2022 cost of living index in zip code 60963: 84.3 (less than average, U.S. average is 100)
Land area: 77.9 sq. mi. Water area: 0.0 sq. mi.
Population density: 19 people per square mile
(very low).
OSM Map
General Map
Google Map
MSN Map
OSM Map
General Map
Google Map
MSN Map
OSM Map
General Map
Google Map
MSN Map
OSM Map
General Map
Google Map
MSN Map
Please wait while loading the map...
Real estate property taxes paid for housing units in 2022:
This zip code:
1.8% ($1,797)
Illinois:
2.0% ($4,912)
Median real estate property taxes paid for housing units with mortgages in 2022: $2,260 (2.1%) Median real estate property taxes paid for housing units with no mortgage in 2022: $1,421 (1.5%)
Business Search- 14 Million verified businesses
Males: 735
(49.5%)
Females: 750
(50.5%)
For population 25 years and over in 60963:
High school or higher: 93.3%
Bachelor's degree or higher: 20.6%
Graduate or professional degree: 3.7%
Unemployed: 2.0%
Mean travel time to work (commute): 23.1 minutes
For population 15 years and over in 60963:
Never married: 26.6%
Now married: 53.4%
Separated: 2.0%
Widowed: 8.2%
Divorced: 9.9%
Zip code 60963 compared to state average:
Median house value significantly below state average.
Unemployed percentage below state average.
Black race population percentage significantly below state average.
Foreign-born population percentage significantly below state average.
Renting percentage below state average.
Length of stay since moving in significantly above state average.
House age above state average.
Number of college students below state average.
Percentage of population with a bachelor's degree or higher below state average.
Averages for the 2020 tax year for zip code 60963, filed in 2021:
Average Adjusted Gross Income (AGI) in 2020: $53,989 (Individual Income Tax Returns)
Here:
$53,989
State:
$82,626
Salary/wage: $45,453 (reported on 77.3% of returns)
Here:
$45,453
State:
$66,640
(% of AGI for various income ranges: 964.7% for AGIs below $25k, 3643.3% for AGIs $25k-50k, 6801.2% for AGIs $50k-75k, 9052.0% for AGIs $75k-100k, 18196.0% for AGIs $100k-200k)
Taxable interest for individuals: $1,000 (reported on 30.7% of returns)
This zip code:
$1,000
Illinois:
$2,376
(% of AGI for various income ranges: 12.1% for AGIs below $25k, 10.0% for AGIs $25k-50k, 21.2% for AGIs $50k-75k, 42.0% for AGIs $75k-100k, 308.0% for AGIs $100k-200k)
Ordinary dividends: $2,092 (reported on 16.0% of returns)
Here:
$2,092
State:
$9,061
(% of AGI for various income ranges: 23.7% for AGIs below $25k, 57.5% for AGIs $50k-75k, 320.0% for AGIs $100k-200k)
Net capital gain/loss in AGI: +$6,100 (reported on 12.0% of returns)
Here:
+$6,100
State:
+$31,684
(% of AGI for various income ranges: 17.4% for AGIs below $25k, 88.8% for AGIs $50k-75k, 890.0% for AGIs $100k-200k)
Profit/loss from business: +$6,333 (reported on 12.0% of returns)
Here:
+$6,333
State:
+$12,175
(% of AGI for various income ranges: 57.9% for AGIs below $25k, 95.3% for AGIs $25k-50k, 215.0% for AGIs $50k-75k, 290.0% for AGIs $100k-200k)
Taxable individual retirement arrangement distribution: $12,157 (reported on 9.3% of returns)
60963:
$12,157
Illinois:
$21,613
(% of AGI for various income ranges: 71.6% for AGIs below $25k, 266.2% for AGIs $50k-75k, 1004.0% for AGIs $100k-200k)
Earned income credit: $2,179 (reported on 18.7% of returns)
Here:
$2,179
State:
$2,311
(% of AGI for various income ranges: 95.3% for AGIs below $25k, 82.7% for AGIs $25k-50k)
Percentage of individuals using paid preparers for their 2020 taxes: 97.3%
Here:
97%
State:
93%
(% for various income ranges: 96.2% for AGIs below $25k, 100.0% for AGIs $25k-50k, 100.0% for AGIs $50k-75k, 100.0% for AGIs $75k-100k, 90.9% for AGIs $100k-200k)
Averages for the 2012 tax year for zip code 60963, filed in 2013:
Average Adjusted Gross Income (AGI) in 2012: $49,391 (Individual Income Tax Returns)
Here:
$49,391
State:
$68,058
Salary/wage: $37,113 (reported on 79.7% of returns)
Here:
$37,113
State:
$55,396
(% of AGI for various income ranges: 69.5% for AGIs below $25k, 71.9% for AGIs $25k-50k, 68.6% for AGIs $50k-75k, 62.8% for AGIs $75k-100k, 45.2% for AGIs $100k-200k)
Taxable interest for individuals: $874 (reported on 34.2% of returns)
This zip code:
$874
Illinois:
$1,969
(% of AGI for various income ranges: 1.1% for AGIs below $25k, 0.4% for AGIs $25k-50k, 0.2% for AGIs $50k-75k, 0.5% for AGIs $75k-100k, 0.8% for AGIs $100k-200k)
Ordinary dividends: $2,358 (reported on 15.2% of returns)
Here:
$2,358
State:
$7,786
(% of AGI for various income ranges: 1.0% for AGIs below $25k, 1.0% for AGIs $25k-50k, 1.8% for AGIs $50k-75k, 0.3% for AGIs $100k-200k)
Net capital gain/loss in AGI: +$2,743 (reported on 8.9% of returns)
Here:
+$2,743
State:
+$22,183
Profit/loss from business: +$5,300 (reported on 17.7% of returns)
Here:
+$5,300
State:
+$12,903
(% of AGI for various income ranges: 3.7% for AGIs below $25k, 1.5% for AGIs $25k-50k, 2.1% for AGIs $50k-75k, 2.5% for AGIs $100k-200k)
Taxable individual retirement arrangement distribution: $6,633 (reported on 11.4% of returns)
60963:
$6,633
Illinois:
$17,929
(% of AGI for various income ranges: 3.0% for AGIs below $25k, 2.8% for AGIs $25k-50k, 3.9% for AGIs $50k-75k)
Total itemized deductions: $20,636 (19% of AGI, reported on 17.7% of returns)
Here:
$20,636
State:
$26,433
Here:
19.4% of AGI
State:
19.2% of AGI
(% of AGI for various income ranges: 7.9% for AGIs $25k-50k, 10.4% for AGIs $50k-75k, 6.7% for AGIs $75k-100k, 7.9% for AGIs $100k-200k)
Charity contributions: $4,036 (reported on 13.9% of returns)
Here:
$4,036
State:
$4,525
(% of AGI for various income ranges: 1.1% for AGIs $25k-50k, 1.8% for AGIs $50k-75k, 1.7% for AGIs $100k-200k)
Taxes paid: $7,093 (reported on 17.7% of returns)
60963:
$7,093
State:
$11,968
(% of AGI for various income ranges: 2.0% for AGIs $25k-50k, 1.9% for AGIs $50k-75k, 2.1% for AGIs $75k-100k, 4.1% for AGIs $100k-200k)
Earned income credit: $1,971 (reported on 17.7% of returns)
Here:
$1,971
State:
$2,349
(% of AGI for various income ranges: 5.3% for AGIs below $25k, 1.1% for AGIs $25k-50k)
Percentage of individuals using paid preparers for their 2012 taxes: 68.4%
Here:
68%
State:
57%
(% for various income ranges: 58.1% for AGIs below $25k, 70.0% for AGIs $25k-50k, 75.0% for AGIs $50k-75k, 75.0% for AGIs $75k-100k, 87.5% for AGIs $100k-200k)
Averages for the 2004 tax year for zip code 60963, filed in 2005:
Average Adjusted Gross Income (AGI) in 2004: $35,268 (Individual Income Tax Returns)
Here:
$35,268
State:
$54,625
Salary/wage: $30,048 (reported on 81.9% of returns)
Here:
$30,048
State:
$46,811
(% of AGI for various income ranges: 102.9% for AGIs below $10k, 65.7% for AGIs $10k-25k, 74.2% for AGIs $25k-50k, 71.6% for AGIs $50k-75k, 74.5% for AGIs $75k-100k, 47.2% for AGIs over 100k)
Taxable interest for individuals: $1,156 (reported on 47.8% of returns)
This zip code:
$1,156
Illinois:
$2,101
(% of AGI for various income ranges: 5.0% for AGIs below $10k, 2.8% for AGIs $10k-25k, 1.7% for AGIs $25k-50k, 0.6% for AGIs $50k-75k, 1.9% for AGIs $75k-100k, 0.8% for AGIs over 100k)
Taxable dividends: $1,787 (reported on 19.6% of returns)
Here:
$1,787
State:
$4,306
(% of AGI for various income ranges: 7.5% for AGIs below $10k, 2.0% for AGIs $10k-25k, 1.2% for AGIs $25k-50k, 0.4% for AGIs $50k-75k, 0.1% for AGIs $75k-100k, 0.4% for AGIs over 100k)
Net capital gain/loss: +$2,260 (reported on 16.1% of returns)
Here:
+$2,260
State:
+$17,321
(% of AGI for various income ranges: 0.6% for AGIs below $10k, 0.7% for AGIs $10k-25k, 0.2% for AGIs $25k-50k, 2.1% for AGIs $50k-75k, 0.4% for AGIs $75k-100k, 1.8% for AGIs over 100k)
Profit/loss from business: +$7,929 (reported on 16.1% of returns)
Here:
+$7,929
State:
+$11,771
(% of AGI for various income ranges: -3.2% for AGIs below $10k, 4.9% for AGIs $10k-25k, 2.0% for AGIs $25k-50k, 6.4% for AGIs $50k-75k, 4.7% for AGIs $75k-100k)
Profit/loss from farming: +$11,615 (reported on 6.6% of returns)
Here:
+$11,615
State:
+$2,327
IRA payment deduction: $2,800 (reported on 1.9% of returns)
60963:
$2,800
Illinois:
$3,087
Total itemized deductions: $14,164 (24% of AGI, reported on 17.7% of returns)
Here:
$14,164
State:
$20,239
Here:
24.3% of AGI
State:
19.5% of AGI
(% of AGI for various income ranges: 8.5% for AGIs $10k-25k, 5.9% for AGIs $25k-50k, 6.8% for AGIs $50k-75k, 9.4% for AGIs $75k-100k, 8.1% for AGIs over 100k)
Charity contributions deductions: $3,487 (6% of AGI, reported on 14.3% of returns)
Here:
$3,487
State:
$3,719
Here:
5.5% of AGI
State:
3.4% of AGI
(% of AGI for various income ranges: 1.0% for AGIs $10k-25k, 1.1% for AGIs $25k-50k, 1.5% for AGIs $50k-75k, 1.6% for AGIs $75k-100k, 2.7% for AGIs over 100k)
Total tax: $4,244 (reported on 77.2% of returns)
60963:
$4,244
State:
$9,882
(% of AGI for various income ranges: 2.2% for AGIs below $10k, 4.6% for AGIs $10k-25k, 6.9% for AGIs $25k-50k, 9.3% for AGIs $50k-75k, 11.3% for AGIs $75k-100k, 19.3% for AGIs over 100k)
Earned income credit: $1,479 (reported on 15.3% of returns)
Here:
$1,479
State:
$1,788
Percentage of individuals using paid preparers for their 2004 taxes: 71.4%
Here:
71%
State:
61%
(% for various income ranges: 69.8% for AGIs below $10k, 68.9% for AGIs $10k-25k, 71.3% for AGIs $25k-50k, 75.6% for AGIs $50k-75k, 66.7% for AGIs $75k-100k, 91.7% for AGIs over 100k)
Household received Food Stamps/SNAP in the past 12 months: 68 Household did not receive Food Stamps/SNAP in the past 12 months: 469
Women who had a birth in the past 12 months: 22 (0 now married, 22 unmarried) Women who did not have a birth in the past 12 months: 275 (151 now married, 122 unmarried)
Housing units in zip code 60963 with a mortgage: 201 Houses without a mortgage: 4
Median monthly owner costs for units with a mortgage: $1,012 Median monthly owner costs for units without a mortgage: $424
Residents with income below the poverty level in 2022:
This zip code:
9.8%
Whole state:
11.9%
Residents with income below 50% of the poverty level in 2022:
This zip code:
4.3%
Whole state:
5.7%
Median number of rooms in houses and condos:
Here:
6.3
State:
6.4
Median number of rooms in apartments:
Here:
5.6
State:
4.1
Notable locations in this zip code not listed on our city pages
Notable locations in zip code 60963: College Corners (A), Rossville Area Fire Protection District (B), Rossville Community Ambulance Service (C). Display/hide their locations on the map
Size of family households: 180 2-persons, 77 3-persons, 57 4-persons, 11 5-persons, 32 6-persons, 18 7-or-more-persons
Size of nonfamily households: 146 1-person, 15 2-persons
233 married couples with children.
73 single-parent households (30 men, 43 women).
97.4% of residents of 60963 zip code speak English at home.
0.8% of residents speak Spanish at home (18% very well, 82% well).
0.7% of residents speak other Indo-European language at home (67% very well, 22% well, 11% not well).
0.5% of residents speak Asian or Pacific Island language at home (100% very well).
Foreign born population: 21 (1.4%) (62.1% of them are naturalized citizens)
This zip code:
1.4%
Whole state:
14.4%
48%Bhutan
33%Brazil
10%Malaysia
5%Honduras
23%American
17%English
14%German
7%Irish
1%Dutch
1%Scottish
1%European
Year of entry for the foreign-born population
02010 or later
222000 to 2009
31990 to 1999
1Before 1990
Facilities with environmental interests located in this zip code:
CREATIVE PRODUCTS INC (ONE CREATIVE WAY in ROSSVILLE, IL)
STATE MASTER (Illinois EPA Project) - SOLID WASTE PROGRAM, HAZARDOUS WASTE PROGRAM, AIR PROGRAM AIR MINOR (AIRS/AFS) CRITERIA AND HAZARDOUS AIR POLLUTANT INVENTORY (Inventory of air pollution sources) HAZARDOUS WASTE BIENNIAL REPORTER (Resource Conservation and Recovery Act (tracking hazardous waste)) Large Quantity Generators, more that 1000 kg of hazardous waste/month (Resource Conservation and Recovery Act (tracking hazardous waste)) Business SIC classification: SHORTENING, TABLE OILS, MARGARINE, AND OTHER EDIBLE FATS AND OILS; NONCLASSIFIABLE ESTABLISHMENTS Business NAICS classification: ALL OTHER MISCELLANEOUS FOOD MANUFACTURING. Alternative names: CONAGRA STORE BRANDS
HEATON GRAIN CO (19097 E 3750 N RD in ROSSVILLE, IL)
STATE MASTER (Illinois EPA Project) - AIR PROGRAM AIR MINOR (AIRS/AFS) CRITERIA AND HAZARDOUS AIR POLLUTANT INVENTORY (Inventory of air pollution sources) Business SIC classification: GRAIN AND FIELD BEANS
KAUFMAN GRAIN CO (309 E ATTICA in ROSSVILLE, IL)
STATE MASTER (Illinois EPA Project) - AIR PROGRAM AIR MINOR (AIRS/AFS) CRITERIA AND HAZARDOUS AIR POLLUTANT INVENTORY (Inventory of air pollution sources) Business SIC classification: GRAIN AND FIELD BEANS
DAVANS BODYSHOP (615 S CHICAGO ST in ROSSVILLE, IL)
STATE MASTER (Illinois EPA Project) - HAZARDOUS WASTE PROGRAM Large Quantity Generators, more that 1000 kg of hazardous waste/month (Resource Conservation and Recovery Act (tracking hazardous waste)) - notification Organizations: DAVAN LYNNDEL (CONTACT/OWNER)
Alternative names: DAVANS BODY SHOP
DANNER CONSTRUCTION (1001 W ATTICA ST in ROSSVILLE, IL)
STATE MASTER (Illinois EPA Project) - HAZARDOUS WASTE PROGRAM Large Quantity Generators, more that 1000 kg of hazardous waste/month (Resource Conservation and Recovery Act (tracking hazardous waste)) - notification Organizations: DANNER JR ROBERT A (CONTACT/OWNER)
PORCH ROCKER ANTIQUES (212 THOMPSON in ROSSVILLE, IL)
STATE MASTER (Illinois EPA Project) - SOLID WASTE PROGRAM (Resource Conservation and Recovery Act (tracking hazardous waste))
ROSSVILLE AMOCO (207 N CHICAGO ST in ROSSVILLE, IL)
STATE MASTER (Illinois EPA Project) - SOLID WASTE PROGRAM (Resource Conservation and Recovery Act (tracking hazardous waste))
ROSSVILLE STP (14015 EAST 3550 NORTH ROAD in ROSSVILLE, IL)
STATE MASTER (Illinois EPA Project) - National Pollutant Discharge Elimination System Permit National Pollutant Discharge Elimination System NON-MAJOR (Tracking pollutant discharge elimination systems) - permit Business SIC classification: SEWERAGE SYSTEMS Alternative names: ROSSVILLE STP, VILLAGE OF
ROSSVILLE-ALVIN HIGH SCHOOL (350 N CHICAGO in ROSSVILLE, IL)
(Geographic Names Information System) (National Center for Education Statistics) - STATE ID-5409200700002 Organizations: ROSSVILLE-ALVIN CU SCH DIST 7 (SCHOOL DISTRICT)
ROSSVILLE-ALVIN ELEM SCHOOL (350 N CHICAGO in ROSSVILLE, IL)
(National Center for Education Statistics) - STATE ID-5409200702001 Organizations: ROSSVILLE-ALVIN CU SCH DIST 7 (SCHOOL DISTRICT)
AMOCO FERTILIZER PLANT (NW ON RT 1 AND STOP LIGHT in ROSSVILLE, IL)
(Resource Conservation and Recovery Act (tracking hazardous waste))
CONAGRA GROCERY PRODUCTS (P.O. BOX 125 in ROSSVILLE, IL)
National Pollutant Discharge Elimination System NON-MAJOR (Tracking pollutant discharge elimination systems) - permit Organizations: CREATIVE PRODUCTS INC. OF ROSS (CONTACT/OWNER)
Housing units lacking complete plumbing facilities: 2.6% Housing units lacking complete kitchen facilities: 5.9%
62.7%Utility gas
21.0%Electricity
14.6%Bottled, tank, or LP gas
1.3%Wood
Population in 1990: 2,082.
Place of birth for U.S.-born residents:
This state: 1,298
Northeast: 5
Midwest: 87
South: 36
West: 20
66% of the 60963 zip code residents lived in the same house 5 years ago. Out of people who lived in different houses, 66% lived in this county. Out of people who lived in different counties, 50% lived in Illinois.
93% of the 60963 zip code residents lived in the same house 1 year ago. Out of people who lived in different houses, 41% moved from this county. Out of people who lived in different houses, 38% moved from different county within same state. Out of people who lived in different houses, 10% moved from different state. Out of people who lived in different houses, 10% moved from abroad.
Private vs. public school enrollment:
Students in private schools in grades 1 to 8 (elementary and middle school):
Here:
0.0%
Illinois:
13.3%
Students in private schools in grades 9 to 12 (high school):
Here:
0.0%
Illinois:
9.9%
Students in private undergraduate colleges:
Here:
0.0%
Illinois:
27.4%
Occupation by median earnings in the past 12 months ($)
80,174Transportation occupations
65,530Health diagnosing and treating practitioners and other technical occupations
64,294Construction and extraction occupations
64,166Production occupations
63,093Business and financial operations occupations
62,396Installation, maintenance, and repair occupations
Top industries in this zip code by the number of employees in 2005:
Accommodation and Food Services: Full-Service Restaurants (10-19 employees: 1 establishment)
Other Services (except Public Administration): Religious Organizations (1-4: 5)
Health Care and Social Assistance: Offices of Dentists (5-9: 1)
Construction: Electrical Contractors (1-4: 2)
Construction: New Single-Family Housing Construction (except Operative Builders) (1-4: 2)
Professional, Scientific, and Technical Services: Engineering Services (1-4: 2)
Home Mortgage Disclosure Act Aggregated Statistics For Year 2009 (Based on 4 partial tracts)
A) FHA, FSA/RHS & VA Home Purchase Loans
B) Conventional Home Purchase Loans
C) Refinancings
D) Home Improvement Loans
F) Non-occupant Loans on < 5 Family Dwellings (A B C & D)
G) Loans On Manufactured Home Dwelling (A B C & D)
Number
Average Value
Number
Average Value
Number
Average Value
Number
Average Value
Number
Average Value
Number
Average Value
LOANS ORIGINATED
6
$104,383
10
$63,982
48
$104,726
10
$47,703
6
$48,498
2
$84,240
APPLICATIONS APPROVED, NOT ACCEPTED
0
$0
0
$0
6
$99,160
0
$0
0
$0
0
$0
APPLICATIONS DENIED
1
$86,720
3
$69,233
22
$96,463
3
$57,857
1
$47,900
2
$43,045
APPLICATIONS WITHDRAWN
1
$134,060
1
$136,620
15
$108,062
1
$93,120
0
$0
1
$101,720
FILES CLOSED FOR INCOMPLETENESS
0
$0
0
$0
3
$92,563
0
$0
0
$0
0
$0
Aggregated Statistics For Year 2008 (Based on 4 partial tracts)
A) FHA, FSA/RHS & VA Home Purchase Loans
B) Conventional Home Purchase Loans
C) Refinancings
D) Home Improvement Loans
F) Non-occupant Loans on < 5 Family Dwellings (A B C & D)
G) Loans On Manufactured Home Dwelling (A B C & D)
Number
Average Value
Number
Average Value
Number
Average Value
Number
Average Value
Number
Average Value
Number
Average Value
LOANS ORIGINATED
7
$95,184
23
$77,272
33
$85,322
15
$36,173
12
$45,920
3
$54,053
APPLICATIONS APPROVED, NOT ACCEPTED
1
$71,690
2
$92,060
2
$112,850
0
$0
0
$0
0
$0
APPLICATIONS DENIED
0
$0
7
$63,630
22
$97,350
11
$55,289
1
$43,630
2
$95,640
APPLICATIONS WITHDRAWN
0
$0
2
$71,270
6
$87,463
0
$0
0
$0
0
$0
FILES CLOSED FOR INCOMPLETENESS
0
$0
0
$0
1
$71,860
1
$13,190
0
$0
0
$0
Aggregated Statistics For Year 2007 (Based on 4 partial tracts)
A) FHA, FSA/RHS & VA Home Purchase Loans
B) Conventional Home Purchase Loans
C) Refinancings
D) Home Improvement Loans
F) Non-occupant Loans on < 5 Family Dwellings (A B C & D)
G) Loans On Manufactured Home Dwelling (A B C & D)
Number
Average Value
Number
Average Value
Number
Average Value
Number
Average Value
Number
Average Value
Number
Average Value
LOANS ORIGINATED
5
$74,182
18
$93,936
35
$85,610
15
$37,181
9
$67,890
3
$107,393
APPLICATIONS APPROVED, NOT ACCEPTED
0
$0
2
$87,400
9
$89,039
2
$27,665
0
$0
0
$0
APPLICATIONS DENIED
2
$55,620
8
$104,721
32
$88,191
17
$56,482
2
$49,030
4
$58,158
APPLICATIONS WITHDRAWN
0
$0
4
$152,535
13
$108,109
2
$53,625
1
$74,620
1
$68,100
FILES CLOSED FOR INCOMPLETENESS
0
$0
0
$0
3
$121,313
0
$0
0
$0
0
$0
Aggregated Statistics For Year 2006 (Based on 4 partial tracts)
A) FHA, FSA/RHS & VA Home Purchase Loans
B) Conventional Home Purchase Loans
C) Refinancings
D) Home Improvement Loans
F) Non-occupant Loans on < 5 Family Dwellings (A B C & D)
G) Loans On Manufactured Home Dwelling (A B C & D)
Number
Average Value
Number
Average Value
Number
Average Value
Number
Average Value
Number
Average Value
Number
Average Value
LOANS ORIGINATED
6
$80,055
31
$80,568
39
$77,946
19
$26,636
8
$49,345
4
$70,565
APPLICATIONS APPROVED, NOT ACCEPTED
1
$123,430
4
$68,632
7
$93,880
1
$21,360
0
$0
2
$85,570
APPLICATIONS DENIED
0
$0
14
$63,769
23
$79,884
9
$69,217
1
$105,100
2
$69,165
APPLICATIONS WITHDRAWN
0
$0
5
$71,908
19
$102,253
1
$70,910
0
$0
1
$83,880
FILES CLOSED FOR INCOMPLETENESS
0
$0
2
$72,060
6
$103,705
0
$0
0
$0
0
$0
Aggregated Statistics For Year 2005 (Based on 4 partial tracts)
A) FHA, FSA/RHS & VA Home Purchase Loans
B) Conventional Home Purchase Loans
C) Refinancings
D) Home Improvement Loans
F) Non-occupant Loans on < 5 Family Dwellings (A B C & D)
G) Loans On Manufactured Home Dwelling (A B C & D)
Number
Average Value
Number
Average Value
Number
Average Value
Number
Average Value
Number
Average Value
Number
Average Value
LOANS ORIGINATED
6
$70,372
38
$84,887
38
$84,999
17
$25,771
9
$39,860
3
$63,317
APPLICATIONS APPROVED, NOT ACCEPTED
0
$0
4
$54,950
5
$95,204
2
$75,300
0
$0
1
$78,310
APPLICATIONS DENIED
2
$72,955
14
$70,224
43
$92,899
12
$28,569
3
$92,530
3
$48,277
APPLICATIONS WITHDRAWN
0
$0
3
$84,980
20
$103,312
2
$55,655
1
$104,250
1
$29,230
FILES CLOSED FOR INCOMPLETENESS
0
$0
2
$87,195
2
$79,035
2
$42,705
0
$0
0
$0
Aggregated Statistics For Year 2004 (Based on 4 partial tracts)
A) FHA, FSA/RHS & VA Home Purchase Loans
B) Conventional Home Purchase Loans
C) Refinancings
D) Home Improvement Loans
F) Non-occupant Loans on < 5 Family Dwellings (A B C & D)
G) Loans On Manufactured Home Dwelling (A B C & D)
Detailed PMIC statistics for the following Tracts:0101.00
, 0103.00
2002 - 2018 National Fire Incident Reporting System (NFIRS) incidents
Based on the data from the years 2002 - 2018 the average number of fire incidents per year is 12. The highest number of reported fire incidents - 23 took place in 2004, and the least - 0 in 2005. The data has a growing trend.
When looking into fire subcategories, the most incidents belonged to: Structure Fires (38.3%), and Outside Fires (37.8%).
Fire incident types reported to NFIRS in Zip Code 60963


 Nearest zip codes: 61811, 61848, 60942, 61814, 61865, 60973.


 Based on the data from the years 2002 - 2018 the average number of fire incidents per year is 12. The highest number of reported fire incidents - 23 took place in 2004, and the least - 0 in 2005. The data has a growing trend.
 When looking into fire subcategories, the most incidents belonged to: Structure Fires (38.3%), and Outside Fires (37.8%).