Estimated zip code population in 2022: 2,489 Zip code population in 2010: 2,620 Zip code population in 2000: 2,579
Houses and condos: 1,071 Renter-occupied apartments: 210
% of renters here:
21%
State:
33%
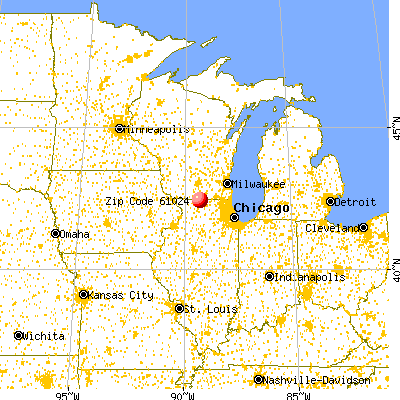
March 2022 cost of living index in zip code 61024: 84.6 (less than average, U.S. average is 100)
Land area: 62.5 sq. mi. Water area: 0.1 sq. mi.
Population density: 40 people per square mile
(very low).
OSM Map
General Map
Google Map
MSN Map
OSM Map
General Map
Google Map
MSN Map
OSM Map
General Map
Google Map
MSN Map
OSM Map
General Map
Google Map
MSN Map
Please wait while loading the map...
Real estate property taxes paid for housing units in 2022:
This zip code:
2.4% ($3,995)
Illinois:
2.0% ($4,912)
Median real estate property taxes paid for housing units with mortgages in 2022: $4,168 (2.6%) Median real estate property taxes paid for housing units with no mortgage in 2022: $3,722 (1.9%)
Business Search- 14 Million verified businesses
Males: 1,299
(52.2%)
Females: 1,189
(47.8%)
For population 25 years and over in 61024:
High school or higher: 92.8%
Bachelor's degree or higher: 20.1%
Graduate or professional degree: 9.6%
Unemployed: 1.7%
Mean travel time to work (commute): 25.5 minutes
For population 15 years and over in 61024:
Never married: 26.7%
Now married: 54.5%
Separated: 3.2%
Widowed: 5.2%
Divorced: 10.4%
Zip code 61024 compared to state average:
Unemployed percentage below state average.
Black race population percentage significantly below state average.
Hispanic race population percentage significantly below state average.
Median age above state average.
Foreign-born population percentage significantly below state average.
Renting percentage below state average.
Length of stay since moving in significantly above state average.
Percentage of population with a bachelor's degree or higher below state average.
Averages for the 2020 tax year for zip code 61024, filed in 2021:
Average Adjusted Gross Income (AGI) in 2020: $65,105 (Individual Income Tax Returns)
Here:
$65,105
State:
$82,626
Salary/wage: $54,518 (reported on 81.2% of returns)
Here:
$54,518
State:
$66,640
(% of AGI for various income ranges: 1212.8% for AGIs below $25k, 3423.0% for AGIs $25k-50k, 5980.0% for AGIs $50k-75k, 9268.9% for AGIs $75k-100k, 13930.6% for AGIs $100k-200k)
Taxable interest for individuals: $892 (reported on 37.5% of returns)
This zip code:
$892
Illinois:
$2,376
(% of AGI for various income ranges: 22.4% for AGIs below $25k, 20.4% for AGIs $25k-50k, 41.3% for AGIs $50k-75k, 64.4% for AGIs $75k-100k, 88.8% for AGIs $100k-200k)
Ordinary dividends: $2,762 (reported on 20.3% of returns)
Here:
$2,762
State:
$9,061
(% of AGI for various income ranges: 19.2% for AGIs below $25k, 33.5% for AGIs $25k-50k, 64.0% for AGIs $50k-75k, 26.7% for AGIs $75k-100k, 230.6% for AGIs $100k-200k)
Net capital gain/loss in AGI: +$10,591 (reported on 17.2% of returns)
Here:
+$10,591
State:
+$31,684
(% of AGI for various income ranges: 5.2% for AGIs below $25k, 33.9% for AGIs $25k-50k, 32.7% for AGIs $50k-75k, 174.4% for AGIs $75k-100k, 550.6% for AGIs $100k-200k)
Profit/loss from business: +$6,783 (reported on 14.1% of returns)
Here:
+$6,783
State:
+$12,175
(% of AGI for various income ranges: 117.6% for AGIs below $25k, 111.3% for AGIs $25k-50k, 132.7% for AGIs $50k-75k, 112.2% for AGIs $75k-100k, 231.9% for AGIs $100k-200k)
Taxable individual retirement arrangement distribution: $14,440 (reported on 11.7% of returns)
61024:
$14,440
Illinois:
$21,613
(% of AGI for various income ranges: 106.0% for AGIs below $25k, 124.8% for AGIs $25k-50k, 376.7% for AGIs $50k-75k, 655.6% for AGIs $100k-200k)
Total itemized deductions: $29,300 (reported on 4.7% of returns)
Here:
$29,300
State:
$34,948
(% of AGI for various income ranges: 439.6% for AGIs $25k-50k, 466.9% for AGIs $100k-200k)
Charity contributions: $6,575 (reported on 3.1% of returns)
Here:
$6,575
State:
$13,122
(% of AGI for various income ranges: 292.2% for AGIs $75k-100k)
Taxes paid: $6,517 (reported on 4.7% of returns)
61024:
$6,517
State:
$8,563
(% of AGI for various income ranges: 77.8% for AGIs $25k-50k, 132.5% for AGIs $100k-200k)
Earned income credit: $1,920 (reported on 11.7% of returns)
Here:
$1,920
State:
$2,311
(% of AGI for various income ranges: 70.4% for AGIs below $25k, 48.7% for AGIs $25k-50k)
Percentage of individuals using paid preparers for their 2020 taxes: 95.3%
Here:
95%
State:
93%
(% for various income ranges: 91.7% for AGIs below $25k, 96.7% for AGIs $25k-50k, 95.2% for AGIs $50k-75k, 92.9% for AGIs $75k-100k, 100.0% for AGIs $100k-200k, 100.0% for AGIs over 200k)
Averages for the 2012 tax year for zip code 61024, filed in 2013:
Average Adjusted Gross Income (AGI) in 2012: $58,154 (Individual Income Tax Returns)
Here:
$58,154
State:
$68,058
Salary/wage: $48,858 (reported on 83.3% of returns)
Here:
$48,858
State:
$55,396
(% of AGI for various income ranges: 71.8% for AGIs below $25k, 76.1% for AGIs $25k-50k, 74.1% for AGIs $50k-75k, 75.7% for AGIs $75k-100k, 77.5% for AGIs $100k-200k, 42.7% for AGIs over 200k)
Taxable interest for individuals: $1,335 (reported on 41.3% of returns)
This zip code:
$1,335
Illinois:
$1,969
(% of AGI for various income ranges: 2.6% for AGIs below $25k, 1.1% for AGIs $25k-50k, 1.0% for AGIs $50k-75k, 0.9% for AGIs $75k-100k, 0.3% for AGIs $100k-200k, 1.1% for AGIs over 200k)
Ordinary dividends: $1,925 (reported on 22.2% of returns)
Here:
$1,925
State:
$7,786
(% of AGI for various income ranges: 1.2% for AGIs below $25k, 0.6% for AGIs $25k-50k, 0.5% for AGIs $50k-75k, 0.5% for AGIs $75k-100k, 1.4% for AGIs $100k-200k)
Net capital gain/loss in AGI: +$6,132 (reported on 15.1% of returns)
Here:
+$6,132
State:
+$22,183
(% of AGI for various income ranges: 0.3% for AGIs $25k-50k, 1.1% for AGIs $50k-75k, 0.2% for AGIs $75k-100k, 4.9% for AGIs $100k-200k)
Profit/loss from business: +$6,210 (reported on 15.9% of returns)
Here:
+$6,210
State:
+$12,903
(% of AGI for various income ranges: 7.0% for AGIs below $25k, 2.0% for AGIs $25k-50k, 1.2% for AGIs $50k-75k, 1.2% for AGIs $75k-100k, 2.0% for AGIs $100k-200k)
Taxable individual retirement arrangement distribution: $10,861 (reported on 14.3% of returns)
61024:
$10,861
Illinois:
$17,929
(% of AGI for various income ranges: 5.3% for AGIs below $25k, 3.5% for AGIs $25k-50k, 3.7% for AGIs $50k-75k, 4.1% for AGIs $75k-100k, 1.6% for AGIs $100k-200k)
Total itemized deductions: $21,254 (21% of AGI, reported on 36.5% of returns)
Here:
$21,254
State:
$26,433
Here:
21.2% of AGI
State:
19.2% of AGI
(% of AGI for various income ranges: 12.6% for AGIs below $25k, 11.8% for AGIs $25k-50k, 14.1% for AGIs $50k-75k, 15.0% for AGIs $75k-100k, 13.8% for AGIs $100k-200k, 11.6% for AGIs over 200k)
Charity contributions: $2,850 (reported on 28.6% of returns)
Here:
$2,850
State:
$4,525
(% of AGI for various income ranges: 0.7% for AGIs below $25k, 1.0% for AGIs $25k-50k, 1.5% for AGIs $50k-75k, 1.4% for AGIs $75k-100k, 1.8% for AGIs $100k-200k, 1.3% for AGIs over 200k)
Taxes paid: $9,002 (reported on 36.5% of returns)
61024:
$9,002
State:
$11,968
(% of AGI for various income ranges: 3.1% for AGIs below $25k, 4.0% for AGIs $25k-50k, 5.3% for AGIs $50k-75k, 5.8% for AGIs $75k-100k, 6.7% for AGIs $100k-200k, 6.5% for AGIs over 200k)
Earned income credit: $1,788 (reported on 13.5% of returns)
Here:
$1,788
State:
$2,349
(% of AGI for various income ranges: 5.0% for AGIs below $25k, 0.6% for AGIs $25k-50k)
Percentage of individuals using paid preparers for their 2012 taxes: 61.9%
Here:
62%
State:
57%
(% for various income ranges: 56.5% for AGIs below $25k, 60.0% for AGIs $25k-50k, 65.2% for AGIs $50k-75k, 71.4% for AGIs $75k-100k, 66.7% for AGIs $100k-200k, 66.7% for AGIs over 200k)
Averages for the 2004 tax year for zip code 61024, filed in 2005:
Average Adjusted Gross Income (AGI) in 2004: $42,747 (Individual Income Tax Returns)
Here:
$42,747
State:
$54,625
Salary/wage: $39,061 (reported on 83.9% of returns)
Here:
$39,061
State:
$46,811
(% of AGI for various income ranges: 126.7% for AGIs below $10k, 71.3% for AGIs $10k-25k, 76.1% for AGIs $25k-50k, 82.8% for AGIs $50k-75k, 84.9% for AGIs $75k-100k, 62.2% for AGIs over 100k)
Taxable interest for individuals: $1,395 (reported on 54.5% of returns)
This zip code:
$1,395
Illinois:
$2,101
(% of AGI for various income ranges: 11.9% for AGIs below $10k, 5.2% for AGIs $10k-25k, 2.3% for AGIs $25k-50k, 0.9% for AGIs $50k-75k, 1.3% for AGIs $75k-100k, 0.9% for AGIs over 100k)
Taxable dividends: $1,297 (reported on 24.7% of returns)
Here:
$1,297
State:
$4,306
(% of AGI for various income ranges: 5.2% for AGIs below $10k, 1.1% for AGIs $10k-25k, 1.3% for AGIs $25k-50k, 0.5% for AGIs $50k-75k, 0.5% for AGIs $75k-100k, 0.4% for AGIs over 100k)
Net capital gain/loss: +$10,991 (reported on 17.9% of returns)
Here:
+$10,991
State:
+$17,321
(% of AGI for various income ranges: 0.4% for AGIs below $10k, -0.3% for AGIs $10k-25k, 0.4% for AGIs $25k-50k, 2.0% for AGIs $50k-75k, 0.8% for AGIs $75k-100k, 15.7% for AGIs over 100k)
Profit/loss from business: +$6,900 (reported on 15.2% of returns)
Here:
+$6,900
State:
+$11,771
(% of AGI for various income ranges: -5.3% for AGIs below $10k, 2.4% for AGIs $10k-25k, 2.8% for AGIs $25k-50k, 2.1% for AGIs $50k-75k, 3.1% for AGIs $75k-100k, 2.5% for AGIs over 100k)
IRA payment deduction: $2,971 (reported on 3.0% of returns)
61024:
$2,971
Illinois:
$3,087
(% of AGI for various income ranges: 0.9% for AGIs $10k-25k, 0.2% for AGIs $50k-75k, 0.4% for AGIs $75k-100k)
Total itemized deductions: $15,854 (22% of AGI, reported on 32.4% of returns)
Here:
$15,854
State:
$20,239
Here:
22.3% of AGI
State:
19.5% of AGI
(% of AGI for various income ranges: 28.0% for AGIs below $10k, 8.8% for AGIs $10k-25k, 12.6% for AGIs $25k-50k, 12.3% for AGIs $50k-75k, 12.3% for AGIs $75k-100k, 11.0% for AGIs over 100k)
Charity contributions deductions: $2,566 (3% of AGI, reported on 27.6% of returns)
Here:
$2,566
State:
$3,719
Here:
3.5% of AGI
State:
3.4% of AGI
(% of AGI for various income ranges: 1.0% for AGIs below $10k, 1.1% for AGIs $10k-25k, 1.3% for AGIs $25k-50k, 1.7% for AGIs $50k-75k, 1.8% for AGIs $75k-100k, 2.0% for AGIs over 100k)
Total tax: $5,694 (reported on 76.4% of returns)
61024:
$5,694
State:
$9,882
(% of AGI for various income ranges: 4.3% for AGIs below $10k, 4.0% for AGIs $10k-25k, 6.4% for AGIs $25k-50k, 8.6% for AGIs $50k-75k, 10.0% for AGIs $75k-100k, 17.1% for AGIs over 100k)
Earned income credit: $1,504 (reported on 10.2% of returns)
Here:
$1,504
State:
$1,788
Percentage of individuals using paid preparers for their 2004 taxes: 63.4%
Here:
63%
State:
61%
(% for various income ranges: 54.1% for AGIs below $10k, 63.2% for AGIs $10k-25k, 64.6% for AGIs $25k-50k, 72.0% for AGIs $50k-75k, 63.8% for AGIs $75k-100k, 70.1% for AGIs over 100k)
Household received Food Stamps/SNAP in the past 12 months: 101 Household did not receive Food Stamps/SNAP in the past 12 months: 881
Women who had a birth in the past 12 months: 38 (30 now married, 7 unmarried) Women who did not have a birth in the past 12 months: 502 (202 now married, 299 unmarried)
Housing units in zip code 61024 with a mortgage: 530 (51 second mortgage, 52 both second mortgage and home equity loan) Median monthly owner costs for units with a mortgage: $1,291 Median monthly owner costs for units without a mortgage: $648
Residents with income below the poverty level in 2022:
This zip code:
4.0%
Whole state:
11.9%
Residents with income below 50% of the poverty level in 2022:
This zip code:
2.0%
Whole state:
5.7%
Median number of rooms in houses and condos:
Here:
6.4
State:
6.4
Median number of rooms in apartments:
Here:
4.1
State:
4.1
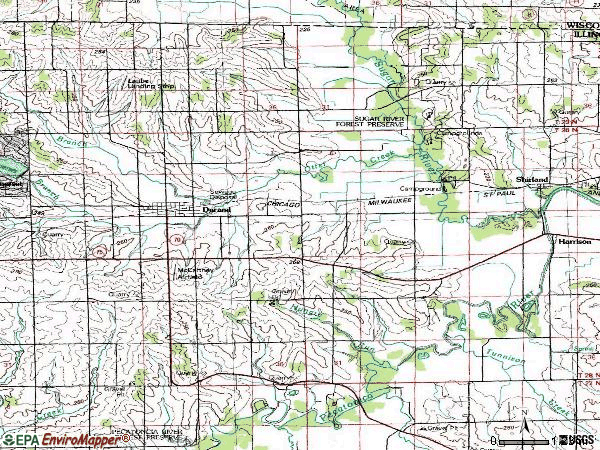
Notable locations in this zip code not listed on our city pages
Notable locations in zip code 61024: Durand City Hall (A), Winnebago County Fire Protection District 1 Station 1 (B). Display/hide their locations on the map
Cemeteries: Harrison Cemetery (1), Bethel Church Cemetery (2), Oakland Cemetery (3), Saint Marys Cemetery (4), Hanford Cemetery (5), Laona Cemetery (6), Durand Cemetery (7). Display/hide their locations on the map
Parks in zip code 61024 include: Trask Bridge Forest Preserve (1), Hartley Memorial Woods Nature Preserve (2), Hartley Forest Preserve (3). Display/hide their locations on the map
In group quarters: 74 (-1 institutionalized population)
Size of family households: 288 2-persons, 94 3-persons, 97 4-persons, 82 5-persons, 11 6-persons, 18 7-or-more-persons
Size of nonfamily households: 342 1-person, 45 2-persons, 6 4-persons
431 married couples with children.
84 single-parent households (14 men, 70 women).
98.0% of residents of 61024 zip code speak English at home.
0.7% of residents speak Spanish at home (71% very well, 29% not well).
0.7% of residents speak other Indo-European language at home (100% very well).
Foreign born population: 40 (1.6%) (100.0% of them are naturalized citizens)
This zip code:
1.6%
Whole state:
14.4%
50%Greece
48%Malaysia
5%Germany
31%German
10%English
10%Irish
8%Italian
7%Swedish
4%American
2%Norwegian
Year of entry for the foreign-born population
02010 or later
02000 to 2009
01990 to 1999
38Before 1990
Facilities with environmental interests located in this zip code:
ROCKFORD BLACKTOP CONSTRUCTION CO (12893 TRASK BRIDGE ROAD in DURAND, IL)
STATE MASTER (Illinois EPA Project) - AIR PROGRAM STATE MASTER (Illinois EPA Project) - National Pollutant Discharge Elimination System Permit AIR MINOR (AIRS/AFS) AIR SYNTHETIC MINOR (AIRS/AFS) CRITERIA AND HAZARDOUS AIR POLLUTANT INVENTORY (Inventory of air pollution sources) National Pollutant Discharge Elimination System NON-MAJOR (Tracking pollutant discharge elimination systems) - permit Business SIC classification: CRUSHED AND BROKEN LIMESTONE; CONSTRUCTION SAND AND GRAVEL; ASPHALT PAVING MIXTURES AND BLOCKS Business NAICS classification: ASPHALT PAVING MIXTURE AND BLOCK MANUFACTURING. Alternative names: ROCKFORD BLACKTOP-FARM 110, ROCKFORD SAND & GRAVEL COMPANY, ROCKFORD SAND & GRAVEL - FARM QUARRY
ACF ORGANICS (119 OAK ST in DURAND, IL)
STATE MASTER (Illinois EPA Project) - SOLID WASTE PROGRAM, HAZARDOUS WASTE PROGRAM, AIR PROGRAM AIR MINOR (AIRS/AFS) CRITERIA AND HAZARDOUS AIR POLLUTANT INVENTORY (Inventory of air pollution sources) Conditionally Exempt Small Quantity Generators, less than 100 kg/month of hazardous waste (Resource Conservation and Recovery Act (tracking hazardous waste)) - notification Business SIC classification: DRUGS, DRUG PROPRIETARIES, AND DRUGGISTS' SUNDRIES Organizations: HUBER PAUL (CONTACT/OWNER)
RAY SATNESS TRUCKING INC (14020 FRITZ RD. in DURAND, IL)
STATE MASTER (Illinois EPA Project) - SOLID WASTE PROGRAM National Pollutant Discharge Elimination System NON-MAJOR (Tracking pollutant discharge elimination systems) - permit Organizations: SATNESS TRUCKING INC.?RAY (CONTACT/OWNER)
Alternative names: SATNESS, RAY TRUCKING, INC., SATNESS TRUCKING INC.?RAY
ROGERS READY MIX & MATERIALS (PIEPER AND GOEKE RD in DURAND, IL)
STATE MASTER (Illinois EPA Project) - AIR PROGRAM AIR MINOR (AIRS/AFS) CRITERIA AND HAZARDOUS AIR POLLUTANT INVENTORY (Inventory of air pollution sources) Business SIC classification: READY-MIXED CONCRETE
ROGERS READY MIX & MATERIALS INC (109 PEPPER ST. in DURAND, IL)
STATE MASTER (Illinois EPA Project) - SOLID WASTE PROGRAM, AIR PROGRAM AIR MINOR (AIRS/AFS) CRITERIA AND HAZARDOUS AIR POLLUTANT INVENTORY (Inventory of air pollution sources) Business SIC classification: READY-MIXED CONCRETE Business NAICS classification: READY-MIX CONCRETE MANUFACTURING.
KINNEY OIL (423 CENTER ST in DURAND, IL)
STATE MASTER (Illinois EPA Project) - SOLID WASTE PROGRAM, SCRAP TIRE MANAGEMENT Small Quantity Generators, between 100 kg and 1000 kg of hazardous waste/month (Resource Conservation and Recovery Act (tracking hazardous waste)) Organizations: GREG HANSON (CONTACT/OPERATOR)
, MIKE KENNEY (CONTACT/OWNER)
Alternative names: KENNEY OIL
KINNEY OIL CO (RR 2 in DURAND, IL)
STATE MASTER (Illinois EPA Project) - AIR PROGRAM AIR MINOR (AIRS/AFS) Business SIC classification: PETROLEUM BULK STATIONS AND TERMINALS
MATTESON SVC CTR (MAIN AND MULVAIN ST in DURAND, IL)
STATE MASTER (Illinois EPA Project) - HAZARDOUS WASTE PROGRAM, SOLID WASTE PROGRAM Conditionally Exempt Small Quantity Generators, less than 100 kg/month of hazardous waste (Resource Conservation and Recovery Act (tracking hazardous waste)) - notification Organizations: MATTESON GLENN M (CONTACT/OWNER)
OTTER CREEK LAKE UTILITY (EAST LAKE SUMMERSET ROAD in DURAND, IL)
National Pollutant Discharge Elimination System NON-MAJOR (Tracking pollutant discharge elimination systems) - permit Business SIC classification: COMBINATION UTILITIES Alternative names: OTTER CREEK LAKE UTILITY DIST.
MCCARTNEY A C (RTE 70 AND 75 in DURAND, IL)
Small Quantity Generators, between 100 kg and 1000 kg of hazardous waste/month (Resource Conservation and Recovery Act (tracking hazardous waste)) - notification Organizations: MCCARTNEY J W (CONTACT/OWNER)
Housing units lacking complete kitchen facilities: 0.3%
51.6%Utility gas
26.0%Bottled, tank, or LP gas
16.0%Electricity
3.9%Wood
1.3%Other fuel
1.1%No fuel used
Population in 1990: 2,633.
Place of birth for U.S.-born residents:
This state: 1,782
Northeast: 46
Midwest: 474
South: 89
West: 52
67% of the 61024 zip code residents lived in the same house 5 years ago. Out of people who lived in different houses, 64% lived in this county. Out of people who lived in different counties, 50% lived in Illinois.
90% of the 61024 zip code residents lived in the same house 1 year ago. Out of people who lived in different houses, 51% moved from this county. Out of people who lived in different houses, 28% moved from different county within same state. Out of people who lived in different houses, 14% moved from different state. Out of people who lived in different houses, 6% moved from abroad.
Private vs. public school enrollment:
Students in private schools in grades 1 to 8 (elementary and middle school): 5
Here:
2.6%
Illinois:
13.3%
Students in private schools in grades 9 to 12 (high school): 18
Here:
9.6%
Illinois:
9.9%
Students in private undergraduate colleges: 25
Here:
21.2%
Illinois:
27.4%
Occupation by median earnings in the past 12 months ($)
93,797Business and financial operations occupations
72,118Architecture and engineering occupations
69,860Management occupations
69,189Installation, maintenance, and repair occupations
67,024Computer and mathematical occupations
66,354Sales and related occupations
Top industries in this zip code by the number of employees in 2005:
Health Care and Social Assistance: Nursing Care Facilities (50-99 employees: 1 establishment)
Finance and Insurance: Commercial Banking (20-49: 1)
Accommodation and Food Services: Full-Service Restaurants (10-19: 1, 1-4: 1)
Construction: Structural Steel and Precast Concrete Contractors (10-19: 1)
Construction: New Single-Family Housing Construction (except Operative Builders) (10-19: 1)
Wholesale Trade: Farm and Garden Machinery and Equipment Merchant Wholesalers (10-19: 1)
People in group quarters in 2010:
70 people in nursing facilities/skilled-nursing facilities
7 people in group homes for juveniles (non-correctional)
People in group quarters in 2000:
88 people in nursing homes
38 people in homes for abused, dependent, and neglected children
Fatal accident statistics in 2014:
Fatal accident count: 2
Vehicles involved in fatal accidents: 2
Fatal accidents caused by drunken drivers: 1
Fatalities: 2
Persons involved in fatal accidents: 5
Pedestrians involved in fatal accidents: 0
Fatal accident statistics in 2011:
Fatal accident count: 1
Vehicles involved in fatal accidents: 1
Fatal accidents caused by drunken drivers: 1
Fatalities: 1
Persons involved in fatal accidents: 2
Pedestrians involved in fatal accidents: 0
Home Mortgage Disclosure Act Aggregated Statistics For Year 2009 (Based on 2 partial tracts)
A) FHA, FSA/RHS & VA Home Purchase Loans
B) Conventional Home Purchase Loans
C) Refinancings
D) Home Improvement Loans
E) Loans on Dwellings For 5+ Families
F) Non-occupant Loans on < 5 Family Dwellings (A B C & D)
G) Loans On Manufactured Home Dwelling (A B C & D)
Number
Average Value
Number
Average Value
Number
Average Value
Number
Average Value
Number
Average Value
Number
Average Value
Number
Average Value
LOANS ORIGINATED
6
$139,310
36
$157,482
322
$139,100
6
$70,167
1
$181,660
45
$150,834
1
$27,000
APPLICATIONS APPROVED, NOT ACCEPTED
0
$0
4
$204,055
31
$139,567
0
$0
0
$0
4
$187,792
0
$0
APPLICATIONS DENIED
1
$115,380
5
$103,348
65
$170,061
4
$57,380
0
$0
9
$160,926
0
$0
APPLICATIONS WITHDRAWN
5
$75,116
2
$256,525
37
$144,369
0
$0
0
$0
1
$92,060
0
$0
FILES CLOSED FOR INCOMPLETENESS
2
$128,265
1
$138,700
25
$156,174
2
$235,045
0
$0
2
$255,915
0
$0
Aggregated Statistics For Year 2008 (Based on 2 partial tracts)
A) FHA, FSA/RHS & VA Home Purchase Loans
B) Conventional Home Purchase Loans
C) Refinancings
D) Home Improvement Loans
F) Non-occupant Loans on < 5 Family Dwellings (A B C & D)
G) Loans On Manufactured Home Dwelling (A B C & D)
Number
Average Value
Number
Average Value
Number
Average Value
Number
Average Value
Number
Average Value
Number
Average Value
LOANS ORIGINATED
9
$155,061
29
$145,849
151
$135,729
18
$52,914
22
$144,945
0
$0
APPLICATIONS APPROVED, NOT ACCEPTED
0
$0
4
$219,398
25
$156,567
0
$0
2
$316,055
0
$0
APPLICATIONS DENIED
2
$158,950
6
$93,692
68
$137,920
4
$9,512
2
$326,490
1
$115,380
APPLICATIONS WITHDRAWN
1
$195,160
7
$213,743
31
$156,236
5
$81,008
2
$66,280
0
$0
FILES CLOSED FOR INCOMPLETENESS
1
$81,010
1
$103,100
25
$157,893
0
$0
2
$166,925
0
$0
Aggregated Statistics For Year 2007 (Based on 2 partial tracts)
A) FHA, FSA/RHS & VA Home Purchase Loans
B) Conventional Home Purchase Loans
C) Refinancings
D) Home Improvement Loans
F) Non-occupant Loans on < 5 Family Dwellings (A B C & D)
Number
Average Value
Number
Average Value
Number
Average Value
Number
Average Value
Number
Average Value
LOANS ORIGINATED
4
$127,958
82
$130,643
140
$134,637
22
$42,959
29
$120,201
APPLICATIONS APPROVED, NOT ACCEPTED
1
$122,740
10
$154,407
23
$133,093
5
$22,584
6
$131,537
APPLICATIONS DENIED
1
$58,920
9
$140,742
55
$161,392
16
$47,639
4
$110,772
APPLICATIONS WITHDRAWN
0
$0
11
$136,018
33
$176,894
4
$19,945
6
$121,103
FILES CLOSED FOR INCOMPLETENESS
0
$0
2
$278,005
10
$200,925
0
$0
0
$0
Aggregated Statistics For Year 2006 (Based on 2 partial tracts)
A) FHA, FSA/RHS & VA Home Purchase Loans
B) Conventional Home Purchase Loans
C) Refinancings
D) Home Improvement Loans
F) Non-occupant Loans on < 5 Family Dwellings (A B C & D)
G) Loans On Manufactured Home Dwelling (A B C & D)
Number
Average Value
Number
Average Value
Number
Average Value
Number
Average Value
Number
Average Value
Number
Average Value
LOANS ORIGINATED
12
$142,481
137
$129,961
150
$138,402
32
$35,480
41
$150,731
1
$27,000
APPLICATIONS APPROVED, NOT ACCEPTED
0
$0
16
$83,847
16
$111,156
2
$67,505
7
$59,266
0
$0
APPLICATIONS DENIED
2
$118,445
22
$121,345
76
$137,792
11
$54,564
4
$92,055
1
$176,750
APPLICATIONS WITHDRAWN
0
$0
22
$152,532
37
$154,354
2
$127,035
9
$174,427
0
$0
FILES CLOSED FOR INCOMPLETENESS
0
$0
4
$239,958
17
$111,766
0
$0
0
$0
0
$0
Aggregated Statistics For Year 2005 (Based on 2 partial tracts)
A) FHA, FSA/RHS & VA Home Purchase Loans
B) Conventional Home Purchase Loans
C) Refinancings
D) Home Improvement Loans
F) Non-occupant Loans on < 5 Family Dwellings (A B C & D)
G) Loans On Manufactured Home Dwelling (A B C & D)
Number
Average Value
Number
Average Value
Number
Average Value
Number
Average Value
Number
Average Value
Number
Average Value
LOANS ORIGINATED
7
$109,239
140
$135,917
147
$147,689
18
$45,141
44
$178,336
1
$73,640
APPLICATIONS APPROVED, NOT ACCEPTED
2
$155,265
11
$138,250
31
$125,551
1
$7,360
5
$113,658
0
$0
APPLICATIONS DENIED
2
$160,175
22
$143,606
92
$127,116
21
$50,207
7
$179,200
0
$0
APPLICATIONS WITHDRAWN
1
$99,420
14
$101,699
64
$138,658
5
$172,572
5
$111,202
0
$0
FILES CLOSED FOR INCOMPLETENESS
0
$0
4
$184,110
11
$146,284
1
$319,120
1
$549,880
0
$0
Aggregated Statistics For Year 2004 (Based on 2 partial tracts)
A) FHA, FSA/RHS & VA Home Purchase Loans
B) Conventional Home Purchase Loans
C) Refinancings
D) Home Improvement Loans
E) Loans on Dwellings For 5+ Families
F) Non-occupant Loans on < 5 Family Dwellings (A B C & D)
G) Loans On Manufactured Home Dwelling (A B C & D)
Number
Average Value
Number
Average Value
Number
Average Value
Number
Average Value
Number
Average Value
Number
Average Value
Number
Average Value
LOANS ORIGINATED
9
$103,783
123
$109,428
194
$104,778
27
$60,779
0
$0
41
$115,346
0
$0
APPLICATIONS APPROVED, NOT ACCEPTED
1
$130,100
4
$103,715
23
$94,030
4
$18,410
0
$0
1
$58,920
1
$61,370
APPLICATIONS DENIED
1
$143,610
16
$109,162
87
$109,168
17
$94,076
0
$0
2
$109,240
0
$0
APPLICATIONS WITHDRAWN
2
$168,155
12
$154,652
43
$119,029
1
$71,190
0
$0
2
$125,810
0
$0
FILES CLOSED FOR INCOMPLETENESS
1
$72,420
1
$111,690
21
$134,196
0
$0
1
$811,310
0
$0
0
$0
Aggregated Statistics For Year 2003 (Based on 2 partial tracts)
A) FHA, FSA/RHS & VA Home Purchase Loans
B) Conventional Home Purchase Loans
C) Refinancings
D) Home Improvement Loans
F) Non-occupant Loans on < 5 Family Dwellings (A B C & D)
Number
Average Value
Number
Average Value
Number
Average Value
Number
Average Value
Number
Average Value
LOANS ORIGINATED
9
$107,329
104
$121,949
539
$112,112
15
$22,339
55
$118,790
APPLICATIONS APPROVED, NOT ACCEPTED
0
$0
9
$59,324
43
$107,240
2
$17,795
2
$110,465
APPLICATIONS DENIED
1
$144,830
15
$121,021
98
$111,468
9
$36,959
0
$0
APPLICATIONS WITHDRAWN
0
$0
17
$160,717
79
$130,042
0
$0
4
$178,588
FILES CLOSED FOR INCOMPLETENESS
0
$0
4
$67,815
16
$142,302
2
$27,005
0
$0
Aggregated Statistics For Year 2002 (Based on 2 partial tracts)
A) FHA, FSA/RHS & VA Home Purchase Loans
B) Conventional Home Purchase Loans
C) Refinancings
D) Home Improvement Loans
F) Non-occupant Loans on < 5 Family Dwellings (A B C & D)
Number
Average Value
Number
Average Value
Number
Average Value
Number
Average Value
Number
Average Value
LOANS ORIGINATED
9
$125,604
79
$113,729
382
$109,698
23
$18,891
27
$118,740
APPLICATIONS APPROVED, NOT ACCEPTED
1
$115,380
7
$105,381
41
$106,035
4
$16,878
5
$127,158
APPLICATIONS DENIED
1
$181,660
16
$116,756
71
$83,290
1
$1,230
1
$122,740
APPLICATIONS WITHDRAWN
0
$0
16
$104,099
39
$109,333
0
$0
5
$86,654
FILES CLOSED FOR INCOMPLETENESS
1
$112,920
0
$0
5
$87,882
0
$0
0
$0
Aggregated Statistics For Year 2001 (Based on 2 partial tracts)
A) FHA, FSA/RHS & VA Home Purchase Loans
B) Conventional Home Purchase Loans
C) Refinancings
D) Home Improvement Loans
F) Non-occupant Loans on < 5 Family Dwellings (A B C & D)
Number
Average Value
Number
Average Value
Number
Average Value
Number
Average Value
Number
Average Value
LOANS ORIGINATED
7
$105,907
81
$100,238
355
$105,249
21
$39,160
23
$83,783
APPLICATIONS APPROVED, NOT ACCEPTED
0
$0
10
$161,158
27
$98,874
2
$67,505
4
$122,128
APPLICATIONS DENIED
0
$0
14
$91,441
61
$89,520
10
$20,989
6
$50,118
APPLICATIONS WITHDRAWN
0
$0
10
$82,481
49
$100,421
5
$37,312
1
$153,430
FILES CLOSED FOR INCOMPLETENESS
0
$0
1
$73,640
10
$126,177
1
$18,410
1
$166,930
Aggregated Statistics For Year 2000 (Based on 2 partial tracts)
A) FHA, FSA/RHS & VA Home Purchase Loans
B) Conventional Home Purchase Loans
C) Refinancings
D) Home Improvement Loans
F) Non-occupant Loans on < 5 Family Dwellings (A B C & D)
Number
Average Value
Number
Average Value
Number
Average Value
Number
Average Value
Number
Average Value
LOANS ORIGINATED
10
$98,560
93
$105,081
80
$90,383
18
$20,798
17
$115,448
APPLICATIONS APPROVED, NOT ACCEPTED
0
$0
11
$102,990
5
$87,146
12
$21,684
0
$0
APPLICATIONS DENIED
0
$0
15
$95,410
41
$70,680
7
$30,686
0
$0
APPLICATIONS WITHDRAWN
0
$0
12
$149,845
32
$100,148
1
$98,190
1
$110,470
FILES CLOSED FOR INCOMPLETENESS
0
$0
2
$165,700
15
$71,107
0
$0
2
$182,270
Aggregated Statistics For Year 1999 (Based on 1 partial tract)
A) FHA, FSA/RHS & VA Home Purchase Loans
B) Conventional Home Purchase Loans
C) Refinancings
D) Home Improvement Loans
E) Loans on Dwellings For 5+ Families
F) Non-occupant Loans on < 5 Family Dwellings (A B C & D)
Detailed PMIC statistics for the following Tracts:0041.00
2002 - 2018 National Fire Incident Reporting System (NFIRS) incidents
According to the data from the years 2002 - 2018 the average number of fires per year is 21. The highest number of reported fire incidents - 35 took place in 2012, and the least - 6 in 2013. The data has an increasing trend.
When looking into fire subcategories, the most incidents belonged to: Outside Fires (57.8%), and Structure Fires (32.1%).
Fire incident types reported to NFIRS in Zip Code 61024


 Nearest zip codes: 61079, 61019, 61063, 61072, 53520, 61088.


 According to the data from the years 2002 - 2018 the average number of fires per year is 21. The highest number of reported fire incidents - 35 took place in 2012, and the least - 6 in 2013. The data has an increasing trend.
 When looking into fire subcategories, the most incidents belonged to: Outside Fires (57.8%), and Structure Fires (32.1%).