Estimated zip code population in 2022: 1,720 Zip code population in 2010: 1,656 Zip code population in 2000: 1,750
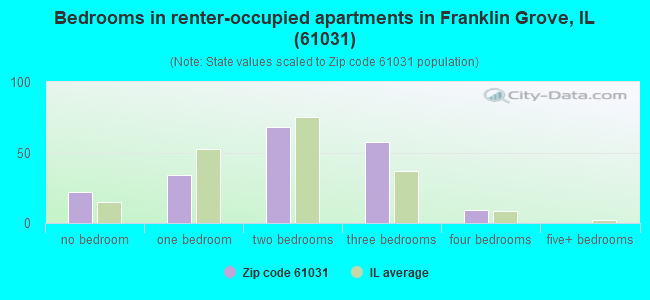
Houses and condos: 655 Renter-occupied apartments: 191
% of renters here:
30%
State:
33%
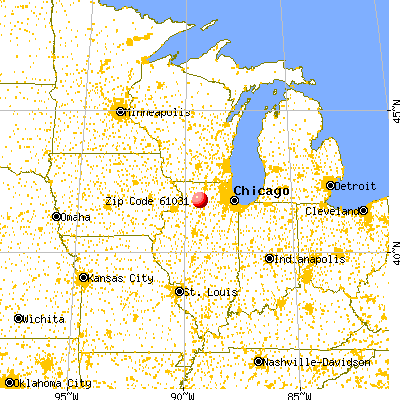
March 2022 cost of living index in zip code 61031: 84.4 (less than average, U.S. average is 100)
Land area: 46.4 sq. mi. Water area: 0.0 sq. mi.
Population density: 37 people per square mile
(very low).
OSM Map
General Map
Google Map
MSN Map
OSM Map
General Map
Google Map
MSN Map
OSM Map
General Map
Google Map
MSN Map
OSM Map
General Map
Google Map
MSN Map
Please wait while loading the map...
Real estate property taxes paid for housing units in 2022:
This zip code:
1.6% ($2,137)
Illinois:
2.0% ($4,912)
Median real estate property taxes paid for housing units with mortgages in 2022: $2,112 (1.8%) Median real estate property taxes paid for housing units with no mortgage in 2022: $2,164 (1.4%)
Business Search- 14 Million verified businesses
Males: 799
(46.4%)
Females: 921
(53.6%)
For population 25 years and over in 61031:
High school or higher: 93.5%
Bachelor's degree or higher: 22.4%
Graduate or professional degree: 4.0%
Unemployed: 1.0%
Mean travel time to work (commute): 31.1 minutes
For population 15 years and over in 61031:
Never married: 35.3%
Now married: 43.4%
Separated: 2.2%
Widowed: 11.6%
Divorced: 7.4%
Zip code 61031 compared to state average:
Median house value below state average.
Unemployed percentage significantly below state average.
Black race population percentage significantly below state average.
Median age above state average.
Foreign-born population percentage significantly below state average.
Length of stay since moving in significantly above state average.
Percentage of population with a bachelor's degree or higher below state average.
Estimated median house/condo value in 2022: $133,113
61031:
$133,113
Illinois:
$251,600
According to our research of Illinois and other state lists, there was 1 registered sex offender living in 61031 zip code as of May 28, 2024. The ratio of all residents to sex offenders in zip code 61031 is 1,652 to 1. The ratio of registered sex offenders to all residents in this zip code is lower than the state average.
Median resident age:
This zip code:
43.1 years
Illinois median age:
39.1 years
Average household size:
This zip code:
2.6 people
Illinois:
2.4 people
Averages for the 2020 tax year for zip code 61031, filed in 2021:
Average Adjusted Gross Income (AGI) in 2020: $61,393 (Individual Income Tax Returns)
Here:
$61,393
State:
$82,626
Salary/wage: $52,870 (reported on 77.9% of returns)
Here:
$52,870
State:
$66,640
(% of AGI for various income ranges: 1259.3% for AGIs below $25k, 3317.9% for AGIs $25k-50k, 5338.8% for AGIs $50k-75k, 8408.3% for AGIs $75k-100k, 17387.1% for AGIs $100k-200k)
Taxable interest for individuals: $979 (reported on 35.3% of returns)
This zip code:
$979
Illinois:
$2,376
(% of AGI for various income ranges: 18.7% for AGIs below $25k, 10.7% for AGIs $25k-50k, 106.2% for AGIs $50k-75k, 58.3% for AGIs $75k-100k, 102.9% for AGIs $100k-200k)
Ordinary dividends: $1,600 (reported on 19.1% of returns)
Here:
$1,600
State:
$9,061
(% of AGI for various income ranges: 6.0% for AGIs below $25k, 20.7% for AGIs $25k-50k, 43.8% for AGIs $50k-75k, 105.0% for AGIs $75k-100k, 102.9% for AGIs $100k-200k)
Net capital gain/loss in AGI: +$2,808 (reported on 17.6% of returns)
Here:
+$2,808
State:
+$31,684
(% of AGI for various income ranges: 18.7% for AGIs below $25k, 122.5% for AGIs $50k-75k, 110.0% for AGIs $75k-100k, 207.1% for AGIs $100k-200k)
Profit/loss from business: +$7,940 (reported on 14.7% of returns)
Here:
+$7,940
State:
+$12,175
(% of AGI for various income ranges: 56.7% for AGIs below $25k, 82.1% for AGIs $25k-50k, 343.8% for AGIs $50k-75k, 455.7% for AGIs $100k-200k)
Taxable individual retirement arrangement distribution: $12,150 (reported on 14.7% of returns)
61031:
$12,150
Illinois:
$21,613
(% of AGI for various income ranges: 108.7% for AGIs below $25k, 297.9% for AGIs $25k-50k, 1058.3% for AGIs $75k-100k)
Total itemized deductions: $26,100 (reported on 2.9% of returns)
Here:
$26,100
State:
$34,948
(% of AGI for various income ranges: 372.9% for AGIs $25k-50k)
Taxes paid: $6,533 (reported on 4.4% of returns)
61031:
$6,533
State:
$8,563
(% of AGI for various income ranges: 245.0% for AGIs $50k-75k)
Earned income credit: $2,310 (reported on 14.7% of returns)
Here:
$2,310
State:
$2,311
(% of AGI for various income ranges: 84.7% for AGIs below $25k, 74.3% for AGIs $25k-50k)
Percentage of individuals using paid preparers for their 2020 taxes: 94.1%
Here:
94%
State:
93%
(% for various income ranges: 90.0% for AGIs below $25k, 94.1% for AGIs $25k-50k, 100.0% for AGIs $50k-75k, 88.9% for AGIs $75k-100k, 100.0% for AGIs $100k-200k, 100.0% for AGIs over 200k)
Averages for the 2012 tax year for zip code 61031, filed in 2013:
Average Adjusted Gross Income (AGI) in 2012: $54,259 (Individual Income Tax Returns)
Here:
$54,259
State:
$68,058
Salary/wage: $40,700 (reported on 82.2% of returns)
Here:
$40,700
State:
$55,396
(% of AGI for various income ranges: 73.7% for AGIs below $25k, 73.1% for AGIs $25k-50k, 68.1% for AGIs $50k-75k, 75.9% for AGIs $75k-100k, 47.4% for AGIs $100k-200k)
Taxable interest for individuals: $1,145 (reported on 39.7% of returns)
This zip code:
$1,145
Illinois:
$1,969
(% of AGI for various income ranges: 1.8% for AGIs below $25k, 0.8% for AGIs $25k-50k, 0.7% for AGIs $50k-75k, 0.5% for AGIs $75k-100k, 0.9% for AGIs $100k-200k)
Ordinary dividends: $2,400 (reported on 19.2% of returns)
Here:
$2,400
State:
$7,786
(% of AGI for various income ranges: 2.5% for AGIs below $25k, 1.2% for AGIs $50k-75k, 0.4% for AGIs $75k-100k, 0.8% for AGIs $100k-200k)
Net capital gain/loss in AGI: +$2,089 (reported on 12.3% of returns)
Here:
+$2,089
State:
+$22,183
(% of AGI for various income ranges: 0.3% for AGIs below $25k, 1.0% for AGIs $100k-200k)
Profit/loss from business: +$3,846 (reported on 17.8% of returns)
Here:
+$3,846
State:
+$12,903
(% of AGI for various income ranges: 3.0% for AGIs below $25k, 4.5% for AGIs $25k-50k, 2.5% for AGIs $75k-100k)
Taxable individual retirement arrangement distribution: $11,244 (reported on 12.3% of returns)
61031:
$11,244
Illinois:
$17,929
(% of AGI for various income ranges: 3.4% for AGIs below $25k, 6.9% for AGIs $25k-50k, 7.9% for AGIs $75k-100k)
Total itemized deductions: $19,505 (19% of AGI, reported on 28.8% of returns)
Here:
$19,505
State:
$26,433
Here:
19.4% of AGI
State:
19.2% of AGI
(% of AGI for various income ranges: 10.2% for AGIs below $25k, 9.1% for AGIs $25k-50k, 9.1% for AGIs $50k-75k, 12.4% for AGIs $75k-100k, 10.4% for AGIs $100k-200k)
Charity contributions: $3,227 (reported on 20.5% of returns)
Here:
$3,227
State:
$4,525
(% of AGI for various income ranges: 0.7% for AGIs $25k-50k, 1.0% for AGIs $50k-75k, 2.3% for AGIs $75k-100k, 1.3% for AGIs $100k-200k)
Taxes paid: $7,238 (reported on 28.8% of returns)
61031:
$7,238
State:
$11,968
(% of AGI for various income ranges: 2.1% for AGIs below $25k, 2.4% for AGIs $25k-50k, 2.9% for AGIs $50k-75k, 4.8% for AGIs $75k-100k, 4.6% for AGIs $100k-200k)
Earned income credit: $2,167 (reported on 16.4% of returns)
Here:
$2,167
State:
$2,349
(% of AGI for various income ranges: 6.4% for AGIs below $25k, 1.0% for AGIs $25k-50k)
Percentage of individuals using paid preparers for their 2012 taxes: 53.4%
Here:
53%
State:
57%
(% for various income ranges: 44.8% for AGIs below $25k, 57.1% for AGIs $25k-50k, 50.0% for AGIs $50k-75k, 62.5% for AGIs $75k-100k, 70.0% for AGIs $100k-200k)
Averages for the 2004 tax year for zip code 61031, filed in 2005:
Average Adjusted Gross Income (AGI) in 2004: $43,350 (Individual Income Tax Returns)
Here:
$43,350
State:
$54,625
Salary/wage: $37,401 (reported on 86.5% of returns)
Here:
$37,401
State:
$46,811
(% of AGI for various income ranges: 149.2% for AGIs below $10k, 72.8% for AGIs $10k-25k, 79.1% for AGIs $25k-50k, 80.8% for AGIs $50k-75k, 73.8% for AGIs $75k-100k, 60.1% for AGIs over 100k)
Taxable interest for individuals: $1,315 (reported on 48.7% of returns)
This zip code:
$1,315
Illinois:
$2,101
(% of AGI for various income ranges: 8.2% for AGIs below $10k, 3.1% for AGIs $10k-25k, 1.7% for AGIs $25k-50k, 0.6% for AGIs $50k-75k, 0.7% for AGIs $75k-100k, 2.2% for AGIs over 100k)
Taxable dividends: $1,059 (reported on 23.3% of returns)
Here:
$1,059
State:
$4,306
(% of AGI for various income ranges: 2.2% for AGIs $10k-25k, 0.6% for AGIs $25k-50k, 0.3% for AGIs $50k-75k, 0.3% for AGIs $75k-100k, 0.2% for AGIs over 100k)
Net capital gain/loss: +$1,303 (reported on 15.2% of returns)
Here:
+$1,303
State:
+$17,321
(% of AGI for various income ranges: 0.0% for AGIs $10k-25k, 0.2% for AGIs $25k-50k, -0.1% for AGIs $50k-75k, 0.0% for AGIs $75k-100k, 2.5% for AGIs over 100k)
Profit/loss from business: +$2,322 (reported on 13.4% of returns)
Here:
+$2,322
State:
+$11,771
(% of AGI for various income ranges: 4.4% for AGIs $10k-25k, -0.4% for AGIs $25k-50k, -0.2% for AGIs $50k-75k, 1.9% for AGIs $75k-100k)
Profit/loss from farming: +$9,861 (reported on 5.5% of returns)
Here:
+$9,861
State:
+$2,327
IRA payment deduction: $3,083 (reported on 1.8% of returns)
61031:
$3,083
Illinois:
$3,087
Total itemized deductions: $16,172 (23% of AGI, reported on 26.0% of returns)
Here:
$16,172
State:
$20,239
Here:
23.3% of AGI
State:
19.5% of AGI
(% of AGI for various income ranges: 13.6% for AGIs $10k-25k, 7.9% for AGIs $25k-50k, 8.1% for AGIs $50k-75k, 12.7% for AGIs $75k-100k, 9.0% for AGIs over 100k)
Charity contributions deductions: $2,372 (3% of AGI, reported on 19.8% of returns)
Here:
$2,372
State:
$3,719
Here:
3.2% of AGI
State:
3.4% of AGI
(% of AGI for various income ranges: 0.9% for AGIs $10k-25k, 1.0% for AGIs $25k-50k, 0.7% for AGIs $50k-75k, 1.4% for AGIs $75k-100k, 1.6% for AGIs over 100k)
Total tax: $5,449 (reported on 77.7% of returns)
61031:
$5,449
State:
$9,882
(% of AGI for various income ranges: 4.7% for AGIs $10k-25k, 6.3% for AGIs $25k-50k, 9.0% for AGIs $50k-75k, 11.6% for AGIs $75k-100k, 17.1% for AGIs over 100k)
Earned income credit: $1,562 (reported on 11.2% of returns)
Here:
$1,562
State:
$1,788
Percentage of individuals using paid preparers for their 2004 taxes: 60.8%
Here:
61%
State:
61%
(% for various income ranges: 44.6% for AGIs below $10k, 57.5% for AGIs $10k-25k, 58.9% for AGIs $25k-50k, 62.7% for AGIs $50k-75k, 75.8% for AGIs $75k-100k, 80.0% for AGIs over 100k)
Household received Food Stamps/SNAP in the past 12 months: 93 Household did not receive Food Stamps/SNAP in the past 12 months: 537
Women who had a birth in the past 12 months: 30 (10 now married, 20 unmarried) Women who did not have a birth in the past 12 months: 351 (119 now married, 231 unmarried)
Housing units in zip code 61031 with a mortgage: 220 (14 second mortgage, 1 home equity loan, 7 both second mortgage and home equity loan) Houses without a mortgage: 8
Median monthly owner costs for units with a mortgage: $1,040 Median monthly owner costs for units without a mortgage: $585
Residents with income below the poverty level in 2022:
This zip code:
6.1%
Whole state:
11.9%
Residents with income below 50% of the poverty level in 2022:
This zip code:
2.7%
Whole state:
5.7%
Median number of rooms in houses and condos:
Here:
6.5
State:
6.4
Median number of rooms in apartments:
Here:
4.3
State:
4.1
Notable locations in this zip code not listed on our city pages
Notable locations in zip code 61031: Sundial Farms (A), Colwell Farms (B), Heng Farm (C), B and B Farms (D), Franklin Grove Public Library (E), Franklin Grove Fire Department (F). Display/hide their locations on the map
Churches in zip code 61031 include: Church of the Brethren (A), First Presbyterian Church (B), Saint Pauls Lutheran Church (C). Display/hide their locations on the map
Parks in zip code 61031 include: Atlasta Park (1), Franklin Creek Nature Preserve (2), Franklin Creek State Park (3), Mill Springs Day Use Area (4). Display/hide their locations on the map
In group quarters: 103 (-1 institutionalized population)
Size of family households: 167 2-persons, 142 3-persons, 82 4-persons, 36 5-persons, 4 6-persons
Size of nonfamily households: 177 1-person, 17 2-persons
211 married couples with children.
109 single-parent households (12 men, 97 women).
97.3% of residents of 61031 zip code speak English at home.
2.1% of residents speak Spanish at home (66% very well, 20% well, 14% not well).
0.1% of residents speak Asian or Pacific Island language at home (100% very well).
0.1% of residents speak other language at home (100% well).
Foreign born population: 36 (2.1%) (89.0% of them are naturalized citizens)
This zip code:
2.1%
Whole state:
14.4%
75%Honduras
8%Ukraine
3%Thailand
39%German
12%Irish
8%American
5%English
3%European
2%Norwegian
1%Italian
Year of entry for the foreign-born population
42010 or later
62000 to 2009
121990 to 1999
25Before 1990
Facilities with environmental interests located in this zip code:
LOGAN BOB TRACTOR CO (1BLK N OF STATE ST & MIDDLE ST in FRANKLIN GROVE, IL)
(Resource Conservation and Recovery Act (tracking hazardous waste))
HENG FARM (1817 STATE ROUTE 38 in FRANKLIN GROVE, IL)
ENFORCEMENT/COMPLIANCE ACTIVITY (Integrated Compliance Information System)
Housing units lacking complete kitchen facilities: 1.1%
59.5%Utility gas
23.3%Electricity
17.5%Bottled, tank, or LP gas
Population in 1990: 2,070.
Place of birth for U.S.-born residents:
This state: 1,355
Northeast: 3
Midwest: 243
South: 34
West: 30
59% of the 61031 zip code residents lived in the same house 5 years ago. Out of people who lived in different houses, 67% lived in this county. Out of people who lived in different counties, 50% lived in Illinois.
88% of the 61031 zip code residents lived in the same house 1 year ago. Out of people who lived in different houses, 40% moved from this county. Out of people who lived in different houses, 35% moved from different county within same state. Out of people who lived in different houses, 26% moved from different state.
Private vs. public school enrollment:
Students in private schools in grades 1 to 8 (elementary and middle school): 28
Here:
13.8%
Illinois:
13.3%
Students in private schools in grades 9 to 12 (high school): 9
Here:
15.0%
Illinois:
9.9%
Students in private undergraduate colleges:
Here:
0.0%
Illinois:
27.4%
Occupation by median earnings in the past 12 months ($)
91,587Arts, design, entertainment, sports, and media occupations
83,662Fire fighting and prevention, and other protective service workers including supervisors
82,563Architecture and engineering occupations
80,752Business and financial operations occupations
65,161Installation, maintenance, and repair occupations
63,075Construction and extraction occupations
Top industries in this zip code by the number of employees in 2005:
Health Care and Social Assistance: Nursing Care Facilities (100-249 employees: 1 establishment)
Real Estate and Rental and Leasing: Lessors of Residential Buildings and Dwellings (20-49: 1)
Information: Directory and Mailing List Publishers (10-19: 1)
Real Estate and Rental and Leasing: Video Tape and Disc Rental (10-19: 1)
Real Estate and Rental and Leasing: Offices of Real Estate Appraisers (10-19: 1)
Finance and Insurance: Direct Property and Casualty Insurance Carriers (5-9: 1)
Finance and Insurance: Commercial Banking (5-9: 1)
Construction: Electrical Contractors (5-9: 1)
People in group quarters in 2010:
98 people in nursing facilities/skilled-nursing facilities
6 people in group homes intended for adults
People in group quarters in 2000:
113 people in nursing homes
6 people in other nonhousehold living situations
Fatal accident statistics in 2014:
Fatal accident count: 1
Vehicles involved in fatal accidents: 1
Fatal accidents caused by drunken drivers: 0
Fatalities: 1
Persons involved in fatal accidents: 1
Pedestrians involved in fatal accidents: 0
Fatal accident statistics in 2013:
Fatal accident count: 1
Vehicles involved in fatal accidents: 1
Fatal accidents caused by drunken drivers: 0
Fatalities: 1
Persons involved in fatal accidents: 1
Pedestrians involved in fatal accidents: 0
2002 - 2018 National Fire Incident Reporting System (NFIRS) incidents
According to the data from the years 2002 - 2018 the average number of fires per year is 11. The highest number of reported fire incidents - 23 took place in 2003, and the least - 1 in 2008. The data has an increasing trend.
When looking into fire subcategories, the most incidents belonged to: Outside Fires (51.6%), and Structure Fires (31.8%).
Fire incident types reported to NFIRS in Zip Code 61031


 Nearest zip codes: 61057, 61331, 61006, 61324, 61310, 61021.


 According to the data from the years 2002 - 2018 the average number of fires per year is 11. The highest number of reported fire incidents - 23 took place in 2003, and the least - 1 in 2008. The data has an increasing trend.
 When looking into fire subcategories, the most incidents belonged to: Outside Fires (51.6%), and Structure Fires (31.8%).