Estimated zip code population in 2022: 10,533 Zip code population in 2010: 11,156 Zip code population in 2000: 7,161
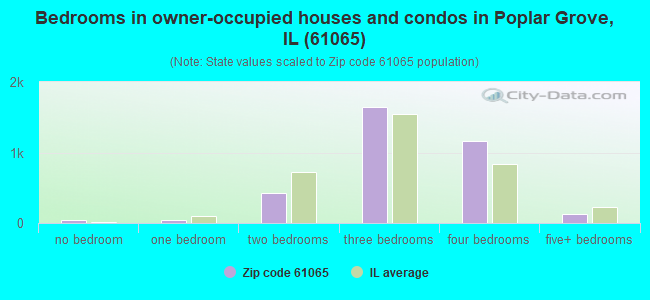
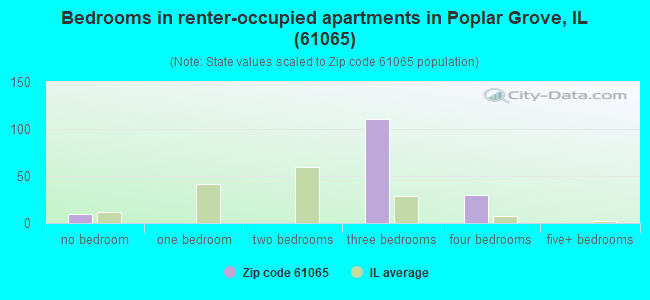
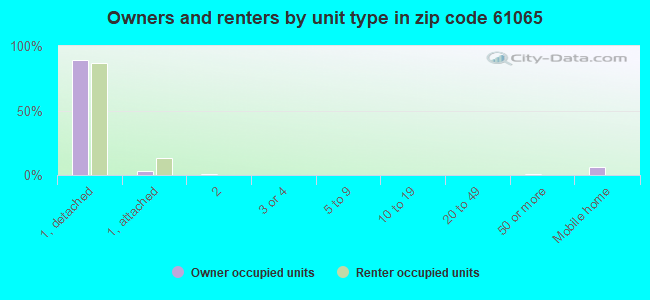
Houses and condos: 3,845 Renter-occupied apartments: 158
% of renters here:
4%
State:
33%
March 2022 cost of living index in zip code 61065: 86.3 (less than average, U.S. average is 100)
Land area: 51.1 sq. mi. Water area: 0.4 sq. mi.
Population density: 206 people per square mile
(very low).
OSM Map
General Map
Google Map
MSN Map
OSM Map
General Map
Google Map
MSN Map
OSM Map
General Map
Google Map
MSN Map
OSM Map
General Map
Google Map
MSN Map
Please wait while loading the map...
Real estate property taxes paid for housing units in 2022:
This zip code:
2.0% ($4,102)
Illinois:
2.0% ($4,912)
Median real estate property taxes paid for housing units with mortgages in 2022: $4,103 (2.1%) Median real estate property taxes paid for housing units with no mortgage in 2022: $3,813 (1.8%)
Business Search- 14 Million verified businesses
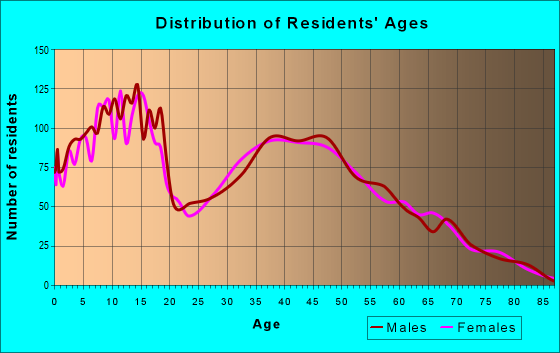
Males: 5,421
(51.5%)
Females: 5,112
(48.5%)
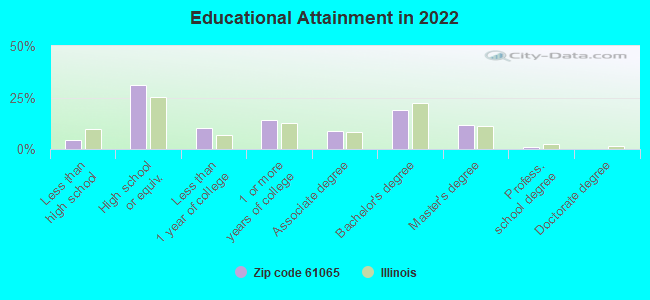
For population 25 years and over in 61065:
High school or higher: 95.5%
Bachelor's degree or higher: 31.5%
Graduate or professional degree: 12.4%
Unemployed: 4.9%
Mean travel time to work (commute): 34.1 minutes
For population 15 years and over in 61065:
Never married: 29.3%
Now married: 61.1%
Separated: 0.4%
Widowed: 2.7%
Divorced: 6.5%
Zip code 61065 compared to state average:
Black race population percentage below state average.
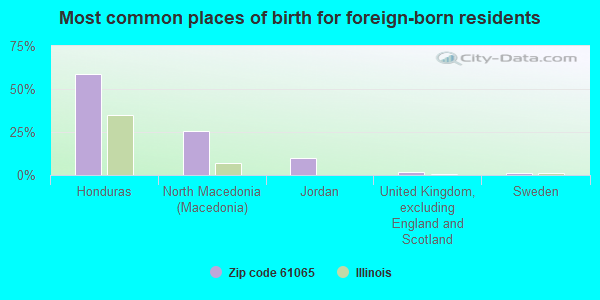
Foreign-born population percentage significantly below state average.
Renting percentage significantly below state average.
Estimated median house/condo value in 2022: $200,354
61065:
$200,354
Illinois:
$251,600
According to our research of Illinois and other state lists, there were 13 registered sex offenders living in 61065 zip code as of May 28, 2024. The ratio of all residents to sex offenders in zip code 61065 is 802 to 1. The ratio of registered sex offenders to all residents in this zip code is near the state average.
Median resident age:
This zip code:
36.7 years
Illinois median age:
39.1 years
Average household size:
This zip code:
2.9 people
Illinois:
2.4 people
Averages for the 2020 tax year for zip code 61065, filed in 2021:
Average Adjusted Gross Income (AGI) in 2020: $65,382 (Individual Income Tax Returns)
Here:
$65,382
State:
$82,626
Salary/wage: $59,158 (reported on 85.0% of returns)
Here:
$59,158
State:
$66,640
(% of AGI for various income ranges: 1051.8% for AGIs below $25k, 3339.9% for AGIs $25k-50k, 6165.2% for AGIs $50k-75k, 8934.4% for AGIs $75k-100k, 15495.8% for AGIs $100k-200k, 54104.3% for AGIs over 200k)
Taxable interest for individuals: $793 (reported on 25.6% of returns)
This zip code:
$793
Illinois:
$2,376
(% of AGI for various income ranges: 14.8% for AGIs below $25k, 22.7% for AGIs $25k-50k, 15.8% for AGIs $50k-75k, 36.0% for AGIs $75k-100k, 40.6% for AGIs $100k-200k, 194.3% for AGIs over 200k)
Ordinary dividends: $3,018 (reported on 15.3% of returns)
Here:
$3,018
State:
$9,061
(% of AGI for various income ranges: 18.6% for AGIs below $25k, 28.8% for AGIs $25k-50k, 44.2% for AGIs $50k-75k, 49.0% for AGIs $75k-100k, 87.8% for AGIs $100k-200k, 1231.4% for AGIs over 200k)
Net capital gain/loss in AGI: +$8,449 (reported on 13.5% of returns)
Here:
+$8,449
State:
+$31,684
(% of AGI for various income ranges: 3.8% for AGIs below $25k, 13.9% for AGIs $25k-50k, 44.3% for AGIs $50k-75k, 88.6% for AGIs $75k-100k, 315.2% for AGIs $100k-200k, 4487.1% for AGIs over 200k)
Profit/loss from business: +$7,947 (reported on 12.7% of returns)
Here:
+$7,947
State:
+$12,175
(% of AGI for various income ranges: 102.1% for AGIs below $25k, 88.7% for AGIs $25k-50k, 113.9% for AGIs $50k-75k, 117.4% for AGIs $75k-100k, 174.2% for AGIs $100k-200k, 1197.1% for AGIs over 200k)
Taxable individual retirement arrangement distribution: $16,229 (reported on 8.4% of returns)
61065:
$16,229
Illinois:
$21,613
(% of AGI for various income ranges: 45.6% for AGIs below $25k, 103.0% for AGIs $25k-50k, 130.4% for AGIs $50k-75k, 202.8% for AGIs $75k-100k, 599.5% for AGIs $100k-200k)
Total itemized deductions: $25,078 (reported on 6.0% of returns)
Here:
$25,078
State:
$34,948
(% of AGI for various income ranges: 108.4% for AGIs $25k-50k, 222.7% for AGIs $50k-75k, 275.8% for AGIs $75k-100k, 365.5% for AGIs $100k-200k, 2457.1% for AGIs over 200k)
Charity contributions: $5,780 (reported on 4.7% of returns)
Here:
$5,780
State:
$13,122
(% of AGI for various income ranges: 11.6% for AGIs $25k-50k, 28.8% for AGIs $50k-75k, 35.8% for AGIs $75k-100k, 65.2% for AGIs $100k-200k, 770.0% for AGIs over 200k)
Taxes paid: $8,509 (reported on 6.0% of returns)
61065:
$8,509
State:
$8,563
(% of AGI for various income ranges: 33.4% for AGIs $25k-50k, 66.9% for AGIs $50k-75k, 102.0% for AGIs $75k-100k, 130.6% for AGIs $100k-200k, 845.7% for AGIs over 200k)
Earned income credit: $2,261 (reported on 12.3% of returns)
Here:
$2,261
State:
$2,311
(% of AGI for various income ranges: 73.7% for AGIs below $25k, 61.6% for AGIs $25k-50k)
Percentage of individuals using paid preparers for their 2020 taxes: 95.3%
Here:
95%
State:
93%
(% for various income ranges: 94.2% for AGIs below $25k, 95.9% for AGIs $25k-50k, 95.2% for AGIs $50k-75k, 95.4% for AGIs $75k-100k, 96.8% for AGIs $100k-200k, 94.1% for AGIs over 200k)
Averages for the 2012 tax year for zip code 61065, filed in 2013:
Average Adjusted Gross Income (AGI) in 2012: $57,192 (Individual Income Tax Returns)
Here:
$57,192
State:
$68,058
Salary/wage: $50,655 (reported on 86.9% of returns)
Here:
$50,655
State:
$55,396
(% of AGI for various income ranges: 73.1% for AGIs below $25k, 80.4% for AGIs $25k-50k, 81.3% for AGIs $50k-75k, 83.5% for AGIs $75k-100k, 81.1% for AGIs $100k-200k, 50.7% for AGIs over 200k)
Taxable interest for individuals: $1,006 (reported on 32.8% of returns)
This zip code:
$1,006
Illinois:
$1,969
(% of AGI for various income ranges: 0.9% for AGIs below $25k, 0.5% for AGIs $25k-50k, 0.4% for AGIs $50k-75k, 0.4% for AGIs $75k-100k, 0.3% for AGIs $100k-200k, 1.6% for AGIs over 200k)
Ordinary dividends: $3,523 (reported on 15.6% of returns)
Here:
$3,523
State:
$7,786
(% of AGI for various income ranges: 1.2% for AGIs below $25k, 0.8% for AGIs $25k-50k, 0.6% for AGIs $50k-75k, 0.3% for AGIs $75k-100k, 0.8% for AGIs $100k-200k, 2.7% for AGIs over 200k)
Net capital gain/loss in AGI: +$8,459 (reported on 12.1% of returns)
Here:
+$8,459
State:
+$22,183
(% of AGI for various income ranges: 0.4% for AGIs $25k-50k, 0.2% for AGIs $50k-75k, 0.2% for AGIs $75k-100k, 0.4% for AGIs $100k-200k, 11.9% for AGIs over 200k)
Profit/loss from business: +$7,373 (reported on 13.1% of returns)
Here:
+$7,373
State:
+$12,903
(% of AGI for various income ranges: 5.2% for AGIs below $25k, 1.6% for AGIs $25k-50k, 1.9% for AGIs $50k-75k, 1.0% for AGIs $75k-100k, 0.7% for AGIs $100k-200k, 2.9% for AGIs over 200k)
Taxable individual retirement arrangement distribution: $15,845 (reported on 10.2% of returns)
61065:
$15,845
Illinois:
$17,929
(% of AGI for various income ranges: 4.1% for AGIs below $25k, 2.5% for AGIs $25k-50k, 1.6% for AGIs $50k-75k, 2.3% for AGIs $75k-100k, 3.2% for AGIs $100k-200k, 4.1% for AGIs over 200k)
Total itemized deductions: $20,323 (22% of AGI, reported on 42.6% of returns)
Here:
$20,323
State:
$26,433
Here:
22.3% of AGI
State:
19.2% of AGI
(% of AGI for various income ranges: 14.4% for AGIs below $25k, 12.9% for AGIs $25k-50k, 15.2% for AGIs $50k-75k, 16.8% for AGIs $75k-100k, 16.2% for AGIs $100k-200k, 13.1% for AGIs over 200k)
Charity contributions: $2,639 (reported on 32.4% of returns)
Here:
$2,639
State:
$4,525
(% of AGI for various income ranges: 1.0% for AGIs below $25k, 1.0% for AGIs $25k-50k, 1.1% for AGIs $50k-75k, 1.4% for AGIs $75k-100k, 1.6% for AGIs $100k-200k, 2.8% for AGIs over 200k)
Taxes paid: $8,741 (reported on 42.6% of returns)
61065:
$8,741
State:
$11,968
(% of AGI for various income ranges: 4.0% for AGIs below $25k, 4.3% for AGIs $25k-50k, 5.7% for AGIs $50k-75k, 7.1% for AGIs $75k-100k, 8.2% for AGIs $100k-200k, 6.8% for AGIs over 200k)
Earned income credit: $2,257 (reported on 16.0% of returns)
Here:
$2,257
State:
$2,349
(% of AGI for various income ranges: 6.5% for AGIs below $25k, 1.3% for AGIs $25k-50k)
Percentage of individuals using paid preparers for their 2012 taxes: 52.4%
Here:
52%
State:
57%
(% for various income ranges: 46.3% for AGIs below $25k, 50.5% for AGIs $25k-50k, 57.0% for AGIs $50k-75k, 56.2% for AGIs $75k-100k, 57.6% for AGIs $100k-200k, 80.0% for AGIs over 200k)
Averages for the 2004 tax year for zip code 61065, filed in 2005:
Average Adjusted Gross Income (AGI) in 2004: $49,620 (Individual Income Tax Returns)
Here:
$49,620
State:
$54,625
Salary/wage: $45,249 (reported on 90.3% of returns)
Here:
$45,249
State:
$46,811
(% of AGI for various income ranges: 218.5% for AGIs below $10k, 77.9% for AGIs $10k-25k, 83.4% for AGIs $25k-50k, 88.5% for AGIs $50k-75k, 88.1% for AGIs $75k-100k, 68.1% for AGIs over 100k)
Taxable interest for individuals: $1,350 (reported on 41.4% of returns)
This zip code:
$1,350
Illinois:
$2,101
(% of AGI for various income ranges: 17.9% for AGIs below $10k, 2.1% for AGIs $10k-25k, 1.0% for AGIs $25k-50k, 0.7% for AGIs $50k-75k, 0.7% for AGIs $75k-100k, 1.3% for AGIs over 100k)
Taxable dividends: $1,794 (reported on 19.9% of returns)
Here:
$1,794
State:
$4,306
(% of AGI for various income ranges: 4.1% for AGIs below $10k, 1.9% for AGIs $10k-25k, 0.8% for AGIs $25k-50k, 0.3% for AGIs $50k-75k, 0.4% for AGIs $75k-100k, 1.0% for AGIs over 100k)
Net capital gain/loss: +$8,992 (reported on 15.5% of returns)
Here:
+$8,992
State:
+$17,321
(% of AGI for various income ranges: -2.3% for AGIs below $10k, 0.3% for AGIs $10k-25k, 0.4% for AGIs $25k-50k, 0.7% for AGIs $50k-75k, 1.2% for AGIs $75k-100k, 8.5% for AGIs over 100k)
Profit/loss from business: +$6,818 (reported on 13.7% of returns)
Here:
+$6,818
State:
+$11,771
(% of AGI for various income ranges: 11.2% for AGIs below $10k, 5.6% for AGIs $10k-25k, 2.0% for AGIs $25k-50k, 1.1% for AGIs $50k-75k, 1.0% for AGIs $75k-100k, 2.3% for AGIs over 100k)
IRA payment deduction: $2,859 (reported on 1.9% of returns)
61065:
$2,859
Illinois:
$3,087
(% of AGI for various income ranges: 0.2% for AGIs $25k-50k, 0.1% for AGIs $50k-75k, 0.1% for AGIs $75k-100k, 0.1% for AGIs over 100k)
Self-employed pension: $9,760 (reported on 0.6% of returns)
Here:
$9,760
Illinois:
$16,965
Total itemized deductions: $17,002 (24% of AGI, reported on 49.6% of returns)
Here:
$17,002
State:
$20,239
Here:
24.0% of AGI
State:
19.5% of AGI
(% of AGI for various income ranges: 28.5% for AGIs below $10k, 18.2% for AGIs $10k-25k, 17.4% for AGIs $25k-50k, 19.1% for AGIs $50k-75k, 16.4% for AGIs $75k-100k, 14.5% for AGIs over 100k)
Charity contributions deductions: $2,228 (3% of AGI, reported on 41.8% of returns)
Here:
$2,228
State:
$3,719
Here:
3.0% of AGI
State:
3.4% of AGI
(% of AGI for various income ranges: 1.2% for AGIs below $10k, 1.3% for AGIs $10k-25k, 1.5% for AGIs $25k-50k, 1.7% for AGIs $50k-75k, 1.7% for AGIs $75k-100k, 2.7% for AGIs over 100k)
Total tax: $6,153 (reported on 76.2% of returns)
61065:
$6,153
State:
$9,882
(% of AGI for various income ranges: 5.3% for AGIs below $10k, 4.0% for AGIs $10k-25k, 5.9% for AGIs $25k-50k, 6.9% for AGIs $50k-75k, 9.3% for AGIs $75k-100k, 15.9% for AGIs over 100k)
Earned income credit: $1,659 (reported on 10.5% of returns)
Here:
$1,659
State:
$1,788
Percentage of individuals using paid preparers for their 2004 taxes: 59.5%
Here:
60%
State:
61%
(% for various income ranges: 44.2% for AGIs below $10k, 60.8% for AGIs $10k-25k, 65.5% for AGIs $25k-50k, 61.0% for AGIs $50k-75k, 60.2% for AGIs $75k-100k, 66.5% for AGIs over 100k)
Household received Food Stamps/SNAP in the past 12 months: 404 Household did not receive Food Stamps/SNAP in the past 12 months: 3,160
Women who had a birth in the past 12 months: 78 (78 now married, 0 unmarried) Women who did not have a birth in the past 12 months: 2,455 (1,369 now married, 1,071 unmarried)
Housing units in zip code 61065 with a mortgage: 2,528 (197 second mortgage, 8 home equity loan, 169 both second mortgage and home equity loan) Median monthly owner costs for units with a mortgage: $1,511 Median monthly owner costs for units without a mortgage: $758
Residents with income below the poverty level in 2022:
This zip code:
7.5%
Whole state:
11.9%
Residents with income below 50% of the poverty level in 2022:
This zip code:
3.2%
Whole state:
5.7%
Median number of rooms in houses and condos:
Here:
6.5
State:
6.4
Median number of rooms in apartments:
Here:
6.0
State:
4.1
Notable locations in this zip code not listed on our city pages
Notable locations in zip code 61065: Johnson Farms (A), Hillcrest Farm (B), Kinnikinnick Farms (C), Worley Farms (D), North Boone Fire District 3 Station 1 (E), Capron Rescue Squad (F), Stonegate Nursery (G). Display/hide their locations on the map
Cemeteries: Blaine Cemetery (1), South Poplar Grove Cemetery (2), Popular Grove Cemetery (3), Ewins Cemetery (4), Drake Cemetery (5), Stone School Cemetery (6). Display/hide their locations on the map
Size of family households: 1,072 2-persons, 460 3-persons, 815 4-persons, 370 5-persons, 36 6-persons, 61 7-or-more-persons
Size of nonfamily households: 617 1-person, 75 2-persons, 35 4-persons
1,868 married couples with children.
545 single-parent households (215 men, 330 women).
91.1% of residents of 61065 zip code speak English at home.
6.6% of residents speak Spanish at home (82% very well, 18% well).
1.2% of residents speak other Indo-European language at home (23% very well, 69% well, 8% not well).
0.3% of residents speak other language at home (100% very well).
Foreign born population: 328 (3.1%) (27.0% of them are naturalized citizens)
This zip code:
3.1%
Whole state:
14.4%
59%Honduras
26%North Macedonia (Macedonia)
10%Jordan
2%United Kingdom, excluding England and Scotland
1%Sweden
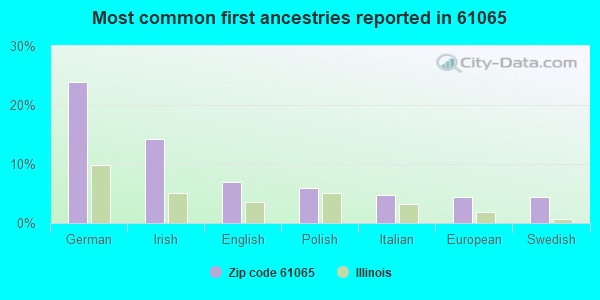
24%German
14%Irish
7%English
6%Polish
5%Italian
4%European
4%Swedish
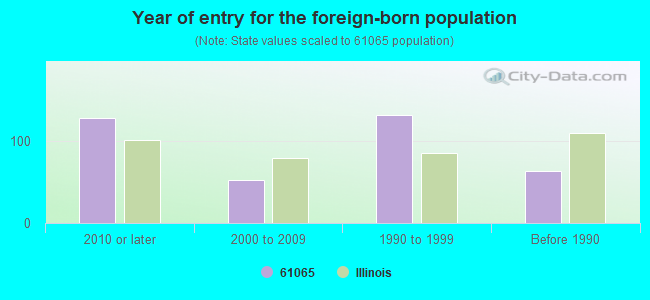
Year of entry for the foreign-born population
1282010 or later
522000 to 2009
1321990 to 1999
63Before 1990
Major facilities with environmental interests located in this zip code:
KASPER TRUCKING INC (15101 RTE 76 in POPLAR GROVE, IL)
STATE MASTER (Illinois EPA Project) - National Pollutant Discharge Elimination System Permit National Pollutant Discharge Elimination System NON-MAJOR (Tracking pollutant discharge elimination systems) - permit TRANSPORTER (Resource Conservation and Recovery Act (tracking hazardous waste)) Organizations: KASPER TRUCKING INC. (CONTACT/OWNER)
POPLAR GROVE, VILLAGE OF (255 W GROVE ST in POPLAR GROVE, IL)
STATE MASTER (Illinois EPA Project) - HAZARDOUS WASTE PROGRAM HAZARDOUS WASTE BIENNIAL REPORTER (Resource Conservation and Recovery Act (tracking hazardous waste)) (Resource Conservation and Recovery Act (tracking hazardous waste)) Organizations: VILLAGE OF POPLAR GROVE (CONTACT/OWNER)
Alternative names: VILLAGE OF POPLAR GROVE
MOR AGRA GRAIN HANDLING INC (102 N STATE in POPLAR GROVE, IL)
STATE MASTER (Illinois EPA Project) - SCRAP TIRE MANAGEMENT, AIR PROGRAM, SOLID WASTE PROGRAM AIR MINOR (AIRS/AFS) CRITERIA AND HAZARDOUS AIR POLLUTANT INVENTORY (Inventory of air pollution sources) Business SIC classification: GRAIN AND FIELD BEANS Alternative names: GARDEN PRAIRIE GRAIN HANDLING LIMITED, GARDEN PRAIRIE GRAIN HANDLING LTD
POLYONICS RUBBER CO INC (100 E PARK ST in POPLAR GROVE, IL)
STATE MASTER (Illinois EPA Project) - AIR PROGRAM, SOLID WASTE PROGRAM AIR MINOR (AIRS/AFS) CRITERIA AND HAZARDOUS AIR POLLUTANT INVENTORY (Inventory of air pollution sources) Business SIC classification: MOLDED, EXTRUDED, AND LATHE-CUT MECHANICAL RUBBER GOODS Business NAICS classification: RUBBER PRODUCT MANUFACTURING FOR MECHANICAL USE.
ROCKFORD SAND AND GRAVEL INC (11619 ROUTE 76 in POPLAR GROVE, IL)
STATE MASTER (Illinois EPA Project) - AIR PROGRAM AIR MINOR (AIRS/AFS) CRITERIA AND HAZARDOUS AIR POLLUTANT INVENTORY (Inventory of air pollution sources) Business SIC classification: CONSTRUCTION SAND AND GRAVEL
OAKLAWN MOBILE HOME PARK (13038 ROUTE 76 in POPLAR GROVE, IL)
STATE MASTER (Illinois EPA Project) - National Pollutant Discharge Elimination System Permit National Pollutant Discharge Elimination System NON-MAJOR (Tracking pollutant discharge elimination systems) - permit Business SIC classification: OPERATORS OF RESIDENTIAL MOBILE HOME SITES
POPLAR GROVE STP (IL ROUTE 76 NEAR BEAVER CREEK in POPLAR GROVE, IL)
STATE MASTER (Illinois EPA Project) - National Pollutant Discharge Elimination System Permit National Pollutant Discharge Elimination System NON-MAJOR (Tracking pollutant discharge elimination systems) - permit Business SIC classification: SEWERAGE SYSTEMS Alternative names: POPLAR GROVE SOUTH WWTP, POPLAR GROVE STP, VILLAGE OF
CONSUMERS IL WATER-CANDLEWICK (4427 CANDLEWICK DRIVE in POPLAR GROVE, IL)
STATE MASTER (Illinois EPA Project) - National Pollutant Discharge Elimination System Permit National Pollutant Discharge Elimination System NON-MAJOR (Tracking pollutant discharge elimination systems) - permit Business SIC classification: COMBINATION UTILITIES Alternative names: AQUA IL INC-CANDLEWICK LAKE, CONSUMER IL WATER-CANDLEWICK
RENO NOVAK (12345 REGINALD DRIVE in POPLAR GROVE, IL)
STATE MASTER (Illinois EPA Project) - AIR PROGRAM AIR MINOR (AIRS/AFS) Business SIC classification: NONCLASSIFIABLE ESTABLISHMENTS
NORTH BOONE COMMUNITY UNIT SD #200 (100 RAY STREET in POPLAR GROVE, IL)
(Integrated Compliance Information System) - ICIS-05-1986-0115, FORMAL ENFORCEMENT ACTION COMPLIANCE ACTIVITY (Tracking inspections of insecticide, fungicide, and rodenticide, and toxic substances) Business SIC classification: ELEMENTARY AND SECONDARY SCHOOLS Alternative names: NORTH BOONE COMM UNIT DIST #20
NORTH BOONE HIGH SCHOOL (17641 POPLAR GROVE in POPLAR GROVE, IL)
(Geographic Names Information System) (National Center for Education Statistics) - STATE ID-0400420000003 Organizations: NORTH BOONE C U SCH DIST 200 (SCHOOL DISTRICT)
PLANE WORKS (11621 RTE 76 in POPLAR GROVE, IL)
STATE MASTER (Illinois EPA Project) - HAZARDOUS WASTE PROGRAM Conditionally Exempt Small Quantity Generators, less than 100 kg/month of hazardous waste (Resource Conservation and Recovery Act (tracking hazardous waste)) - notification Organizations: PLANE WORKS INC (CONTACT/OWNER)
POPLAR GROVE AIRMOTIVE (11619 RT 76 in POPLAR GROVE, IL)
STATE MASTER (Illinois EPA Project) - HAZARDOUS WASTE PROGRAM Small Quantity Generators, between 100 kg and 1000 kg of hazardous waste/month (Resource Conservation and Recovery Act (tracking hazardous waste)) - notification Organizations: THOMAS STEPHEN AND CHRISTINA (CONTACT/OWNER)
Housing units lacking complete kitchen facilities: 1.4%
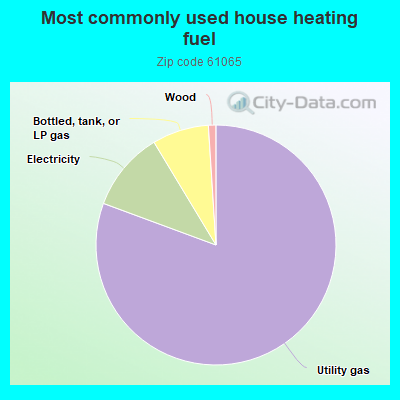
80.4%Utility gas
10.7%Electricity
7.6%Bottled, tank, or LP gas
1.0%Wood
Population in 1990: 2,593. Population change in the 1990s: +4,568 (+176.2%).
Place of birth for U.S.-born residents:
This state: 8,156
Northeast: 83
Midwest: 1,540
South: 282
West: 76
48% of the 61065 zip code residents lived in the same house 5 years ago. Out of people who lived in different houses, 28% lived in this county. Out of people who lived in different counties, 50% lived in Illinois.
87% of the 61065 zip code residents lived in the same house 1 year ago. Out of people who lived in different houses, 7% moved from this county. Out of people who lived in different houses, 69% moved from different county within same state. Out of people who lived in different houses, 32% moved from different state.
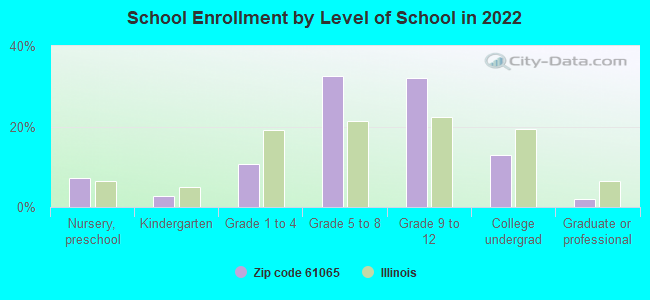
Private vs. public school enrollment:
Students in private schools in grades 1 to 8 (elementary and middle school): 216
Here:
17.4%
Illinois:
13.3%
Students in private schools in grades 9 to 12 (high school): 67
Here:
7.4%
Illinois:
9.9%
Students in private undergraduate colleges: 142
Here:
37.9%
Illinois:
27.4%
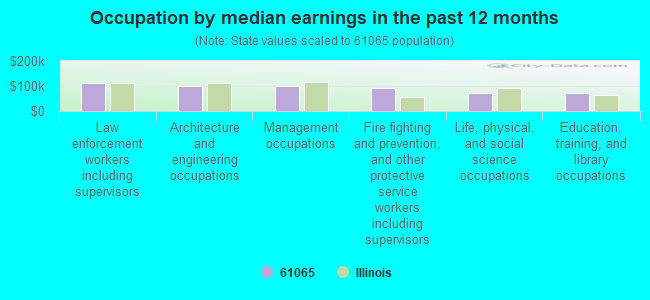
Occupation by median earnings in the past 12 months ($)
111,050Law enforcement workers including supervisors
101,576Architecture and engineering occupations
100,675Management occupations
92,165Fire fighting and prevention, and other protective service workers including supervisors
72,702Life, physical, and social science occupations
70,264Education, training, and library occupations
Top industries in this zip code by the number of employees in 2005:
Arts, Entertainment, and Recreation: Fitness and Recreational Sports Centers (20-49 employees: 1 establishment, 1-4 employees: 3 establishments)
Other Services (except Public Administration): Other Similar Organizations (except Business, Professional, Labor, and Political Organizations) (20-49: 1)
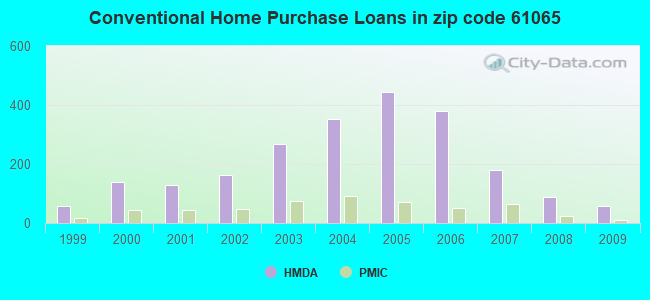
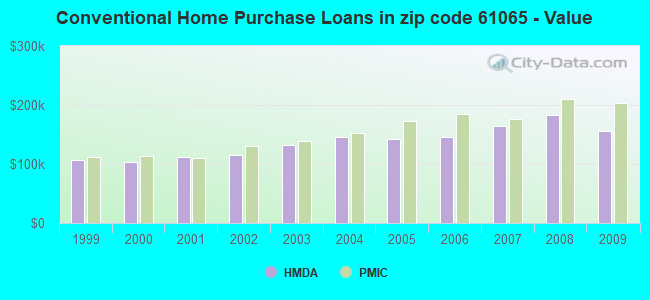
Detailed PMIC statistics for the following Tracts:0106.00
2002 - 2018 National Fire Incident Reporting System (NFIRS) incidents
Based on the data from the years 2002 - 2018 the average number of fire incidents per year is 15. The highest number of fires - 29 took place in 2012, and the least - 1 in 2003. The data has a growing trend.
When looking into fire subcategories, the most reports belonged to: Outside Fires (41.9%), and Structure Fires (27.3%).
Fire incident types reported to NFIRS in Zip Code 61065
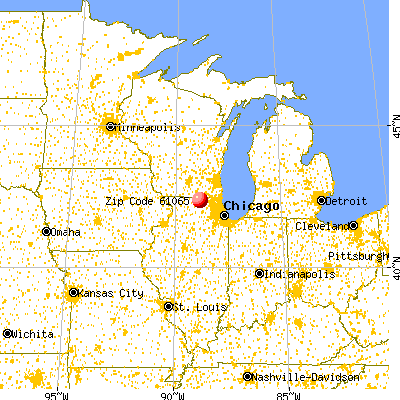


 Nearest zip codes: 61011, 61012, 53525, 61008, 61073, 61038.


 Based on the data from the years 2002 - 2018 the average number of fire incidents per year is 15. The highest number of fires - 29 took place in 2012, and the least - 1 in 2003. The data has a growing trend.
 When looking into fire subcategories, the most reports belonged to: Outside Fires (41.9%), and Structure Fires (27.3%).