Estimated zip code population in 2022: 1,369 Zip code population in 2010: 1,130 Zip code population in 2000: 1,117
Houses and condos: 620 Renter-occupied apartments: 32
% of renters here:
6%
State:
33%
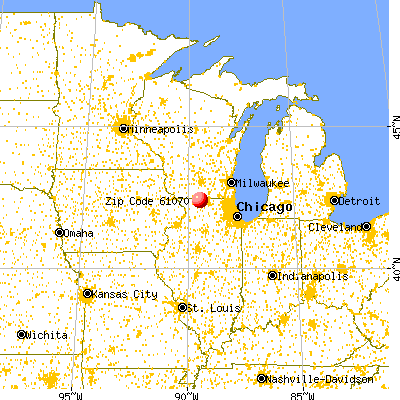
March 2022 cost of living index in zip code 61070: 85.9 (less than average, U.S. average is 100)
Land area: 34.7 sq. mi. Water area: 0.0 sq. mi.
Population density: 39 people per square mile
(very low).
OSM Map
General Map
Google Map
MSN Map
OSM Map
General Map
Google Map
MSN Map
OSM Map
General Map
Google Map
MSN Map
OSM Map
General Map
Google Map
MSN Map
Please wait while loading the map...
Real estate property taxes paid for housing units in 2022:
This zip code:
2.0% ($3,719)
Illinois:
2.0% ($4,912)
Median real estate property taxes paid for housing units with mortgages in 2022: $3,941 (1.9%) Median real estate property taxes paid for housing units with no mortgage in 2022: $3,508 (2.2%)
Business Search- 14 Million verified businesses
Males: 644
(47.0%)
Females: 725
(53.0%)
For population 25 years and over in 61070:
High school or higher: 96.7%
Bachelor's degree or higher: 29.1%
Graduate or professional degree: 10.2%
Unemployed: 2.6%
Mean travel time to work (commute): 36.0 minutes
For population 15 years and over in 61070:
Never married: 17.0%
Now married: 56.5%
Separated: 0.3%
Widowed: 13.6%
Divorced: 12.6%
Zip code 61070 compared to state average:
Unemployed percentage below state average.
Black race population percentage significantly below state average.
Hispanic race population percentage significantly below state average.
Median age significantly above state average.
Foreign-born population percentage significantly below state average.
Renting percentage significantly below state average.
Length of stay since moving in significantly above state average.
Estimated median house/condo value in 2022: $186,674
61070:
$186,674
Illinois:
$251,600
According to our research of Illinois and other state lists, there were 2 registered sex offenders living in 61070 zip code as of May 28, 2024. The ratio of all residents to sex offenders in zip code 61070 is 729 to 1. The ratio of registered sex offenders to all residents in this zip code is near the state average.
Median resident age:
This zip code:
53.2 years
Illinois median age:
39.1 years
Average household size:
This zip code:
2.5 people
Illinois:
2.4 people
Averages for the 2020 tax year for zip code 61070, filed in 2021:
Average Adjusted Gross Income (AGI) in 2020: $70,131 (Individual Income Tax Returns)
Here:
$70,131
State:
$82,626
Salary/wage: $59,490 (reported on 78.8% of returns)
Here:
$59,490
State:
$66,640
(% of AGI for various income ranges: 1172.2% for AGIs below $25k, 3486.7% for AGIs $25k-50k, 6308.0% for AGIs $50k-75k, 8790.0% for AGIs $75k-100k, 19325.7% for AGIs $100k-200k)
Taxable interest for individuals: $1,659 (reported on 42.3% of returns)
This zip code:
$1,659
Illinois:
$2,376
(% of AGI for various income ranges: 37.8% for AGIs below $25k, 34.4% for AGIs $25k-50k, 140.0% for AGIs $50k-75k, 220.0% for AGIs $75k-100k, 202.9% for AGIs $100k-200k)
Ordinary dividends: $2,492 (reported on 25.0% of returns)
Here:
$2,492
State:
$9,061
(% of AGI for various income ranges: 26.7% for AGIs $25k-50k, 222.0% for AGIs $50k-75k, 270.0% for AGIs $100k-200k)
Net capital gain/loss in AGI: +$3,264 (reported on 21.2% of returns)
Here:
+$3,264
State:
+$31,684
(% of AGI for various income ranges: 71.1% for AGIs $25k-50k, 98.0% for AGIs $50k-75k, 351.4% for AGIs $100k-200k)
Profit/loss from business: +$3,614 (reported on 13.5% of returns)
Here:
+$3,614
State:
+$12,175
(% of AGI for various income ranges: 204.4% for AGIs $25k-50k, 98.6% for AGIs $100k-200k)
Taxable individual retirement arrangement distribution: $11,043 (reported on 13.5% of returns)
61070:
$11,043
Illinois:
$21,613
(% of AGI for various income ranges: 285.6% for AGIs $25k-50k, 1290.0% for AGIs $75k-100k)
Total itemized deductions: $32,050 (reported on 3.8% of returns)
Here:
$32,050
State:
$34,948
(% of AGI for various income ranges: 1282.0% for AGIs $50k-75k)
Taxes paid: $8,800 (reported on 3.8% of returns)
61070:
$8,800
State:
$8,563
(% of AGI for various income ranges: 352.0% for AGIs $50k-75k)
Earned income credit: $2,440 (reported on 9.6% of returns)
Here:
$2,440
State:
$2,311
(% of AGI for various income ranges: 135.6% for AGIs below $25k)
Percentage of individuals using paid preparers for their 2020 taxes: 96.2%
Here:
96%
State:
93%
(% for various income ranges: 92.9% for AGIs below $25k, 100.0% for AGIs $25k-50k, 100.0% for AGIs $50k-75k, 100.0% for AGIs $75k-100k, 92.3% for AGIs $100k-200k)
Averages for the 2012 tax year for zip code 61070, filed in 2013:
Average Adjusted Gross Income (AGI) in 2012: $53,317 (Individual Income Tax Returns)
Here:
$53,317
State:
$68,058
Salary/wage: $46,582 (reported on 83.0% of returns)
Here:
$46,582
State:
$55,396
(% of AGI for various income ranges: 74.6% for AGIs below $25k, 75.1% for AGIs $25k-50k, 70.7% for AGIs $50k-75k, 74.9% for AGIs $75k-100k, 70.8% for AGIs $100k-200k)
Taxable interest for individuals: $2,217 (reported on 43.4% of returns)
This zip code:
$2,217
Illinois:
$1,969
(% of AGI for various income ranges: 2.7% for AGIs below $25k, 0.7% for AGIs $25k-50k, 2.3% for AGIs $50k-75k, 0.6% for AGIs $75k-100k, 2.5% for AGIs $100k-200k)
Ordinary dividends: $1,423 (reported on 24.5% of returns)
Here:
$1,423
State:
$7,786
(% of AGI for various income ranges: 1.2% for AGIs below $25k, 1.4% for AGIs $25k-50k, 0.9% for AGIs $50k-75k, 0.5% for AGIs $100k-200k)
Net capital gain/loss in AGI: +$2,020 (reported on 18.9% of returns)
Here:
+$2,020
State:
+$22,183
(% of AGI for various income ranges: 1.8% for AGIs $50k-75k, 1.2% for AGIs $100k-200k)
Profit/loss from business: +$5,671 (reported on 13.2% of returns)
Here:
+$5,671
State:
+$12,903
(% of AGI for various income ranges: 6.1% for AGIs below $25k, 2.7% for AGIs $25k-50k, 2.7% for AGIs $75k-100k)
Taxable individual retirement arrangement distribution: $12,100 (reported on 9.4% of returns)
61070:
$12,100
Illinois:
$17,929
Total itemized deductions: $17,944 (20% of AGI, reported on 34.0% of returns)
Here:
$17,944
State:
$26,433
Here:
20.5% of AGI
State:
19.2% of AGI
(% of AGI for various income ranges: 12.7% for AGIs $25k-50k, 12.2% for AGIs $50k-75k, 12.5% for AGIs $75k-100k, 12.2% for AGIs $100k-200k)
Charity contributions: $3,300 (reported on 26.4% of returns)
Here:
$3,300
State:
$4,525
(% of AGI for various income ranges: 2.1% for AGIs below $25k, 1.4% for AGIs $50k-75k, 2.1% for AGIs $75k-100k, 2.0% for AGIs $100k-200k)
Taxes paid: $7,400 (reported on 34.0% of returns)
61070:
$7,400
State:
$11,968
(% of AGI for various income ranges: 3.1% for AGIs $25k-50k, 3.9% for AGIs $50k-75k, 5.5% for AGIs $75k-100k, 6.2% for AGIs $100k-200k)
Earned income credit: $2,200 (reported on 11.3% of returns)
Here:
$2,200
State:
$2,349
(% of AGI for various income ranges: 6.3% for AGIs below $25k)
Percentage of individuals using paid preparers for their 2012 taxes: 66.0%
Here:
66%
State:
57%
(% for various income ranges: 52.6% for AGIs below $25k, 63.6% for AGIs $25k-50k, 77.8% for AGIs $50k-75k, 71.4% for AGIs $75k-100k, 85.7% for AGIs $100k-200k)
Averages for the 2004 tax year for zip code 61070, filed in 2005:
Average Adjusted Gross Income (AGI) in 2004: $45,543 (Individual Income Tax Returns)
Here:
$45,543
State:
$54,625
Salary/wage: $40,559 (reported on 82.7% of returns)
Here:
$40,559
State:
$46,811
(% of AGI for various income ranges: 125.3% for AGIs below $10k, 71.1% for AGIs $10k-25k, 76.0% for AGIs $25k-50k, 80.6% for AGIs $50k-75k, 78.2% for AGIs $75k-100k, 58.3% for AGIs over 100k)
Taxable interest for individuals: $1,661 (reported on 60.3% of returns)
This zip code:
$1,661
Illinois:
$2,101
(% of AGI for various income ranges: 19.2% for AGIs below $10k, 7.1% for AGIs $10k-25k, 2.8% for AGIs $25k-50k, 1.2% for AGIs $50k-75k, 1.5% for AGIs $75k-100k, 1.2% for AGIs over 100k)
Taxable dividends: $1,641 (reported on 27.9% of returns)
Here:
$1,641
State:
$4,306
(% of AGI for various income ranges: 7.1% for AGIs below $10k, 2.4% for AGIs $10k-25k, 1.1% for AGIs $25k-50k, 0.3% for AGIs $50k-75k, 0.6% for AGIs $75k-100k, 1.3% for AGIs over 100k)
Net capital gain/loss: +$6,033 (reported on 23.5% of returns)
Here:
+$6,033
State:
+$17,321
(% of AGI for various income ranges: -4.9% for AGIs below $10k, 1.4% for AGIs $10k-25k, 1.2% for AGIs $25k-50k, 4.3% for AGIs $50k-75k, -0.1% for AGIs $75k-100k, 6.6% for AGIs over 100k)
Profit/loss from business: +$2,619 (reported on 16.2% of returns)
Here:
+$2,619
State:
+$11,771
(% of AGI for various income ranges: 4.9% for AGIs below $10k, 0.5% for AGIs $10k-25k, 3.5% for AGIs $25k-50k, -0.0% for AGIs $50k-75k, 0.8% for AGIs $75k-100k)
IRA payment deduction: $3,231 (reported on 5.0% of returns)
61070:
$3,231
Illinois:
$3,087
Total itemized deductions: $17,447 (23% of AGI, reported on 32.8% of returns)
Here:
$17,447
State:
$20,239
Here:
22.9% of AGI
State:
19.5% of AGI
(% of AGI for various income ranges: 27.6% for AGIs $10k-25k, 9.7% for AGIs $25k-50k, 11.3% for AGIs $50k-75k, 11.1% for AGIs $75k-100k, 14.0% for AGIs over 100k)
Charity contributions deductions: $3,252 (4% of AGI, reported on 25.2% of returns)
Here:
$3,252
State:
$3,719
Here:
4.0% of AGI
State:
3.4% of AGI
(% of AGI for various income ranges: 6.2% for AGIs below $10k, 1.7% for AGIs $25k-50k, 1.9% for AGIs $50k-75k, 1.8% for AGIs $75k-100k, 2.0% for AGIs over 100k)
Total tax: $6,010 (reported on 79.0% of returns)
61070:
$6,010
State:
$9,882
(% of AGI for various income ranges: 4.5% for AGIs below $10k, 4.1% for AGIs $10k-25k, 6.7% for AGIs $25k-50k, 7.7% for AGIs $50k-75k, 10.8% for AGIs $75k-100k, 18.1% for AGIs over 100k)
Earned income credit: $1,522 (reported on 8.9% of returns)
Here:
$1,522
State:
$1,788
Percentage of individuals using paid preparers for their 2004 taxes: 70.3%
Here:
70%
State:
61%
(% for various income ranges: 69.2% for AGIs below $10k, 67.4% for AGIs $10k-25k, 70.2% for AGIs $25k-50k, 70.6% for AGIs $50k-75k, 73.1% for AGIs $75k-100k, 77.4% for AGIs over 100k)
Household received Food Stamps/SNAP in the past 12 months: 37 Household did not receive Food Stamps/SNAP in the past 12 months: 496
Women who had a birth in the past 12 months: 27 (13 now married, 14 unmarried) Women who did not have a birth in the past 12 months: 191 (80 now married, 110 unmarried)
Housing units in zip code 61070 with a mortgage: 259 (11 second mortgage, 12 both second mortgage and home equity loan) Houses without a mortgage: 16
Median monthly owner costs for units with a mortgage: $1,521 Median monthly owner costs for units without a mortgage: $713
Residents with income below the poverty level in 2022:
This zip code:
7.2%
Whole state:
11.9%
Residents with income below 50% of the poverty level in 2022:
This zip code:
5.7%
Whole state:
5.7%
Median number of rooms in houses and condos:
Here:
7.1
State:
6.4
Median number of rooms in apartments:
Here:
4.0
State:
4.1
Notable locations in this zip code not listed on our city pages
Size of family households: 188 2-persons, 91 3-persons, 91 4-persons, 12 5-persons, 6 6-persons, 5 7-or-more-persons
Size of nonfamily households: 140 1-person, 2 2-persons
96 married couples with children.
87 single-parent households (39 men, 48 women).
98.5% of residents of 61070 zip code speak English at home.
1.1% of residents speak Spanish at home (53% very well, 47% not well).
0.5% of residents speak other Indo-European language at home (100% very well).
Foreign born population: 4 (0.4%) (0.0% of them are naturalized citizens)
:
0.4%
Whole state:
14.4%
100%Bhutan
27%German
14%Scottish
12%American
11%English
8%Norwegian
5%Czech
5%Swedish
Year of entry for the foreign-born population
02010 or later
02000 to 2009
41990 to 1999
0Before 1990
Facilities with environmental interests located in this zip code:
CONMAT INC (ROUTE 75 N in ROCK CITY, IL)
STATE MASTER (Illinois EPA Project) - AIR PROGRAM AIR MINOR (AIRS/AFS) CRITERIA AND HAZARDOUS AIR POLLUTANT INVENTORY (Inventory of air pollution sources) Business SIC classification: CRUSHED AND BROKEN LIMESTONE
ALBERT BARKER (ROUTE 75 in ROCK CITY, IL)
STATE MASTER (Illinois EPA Project) - AIR PROGRAM AIR MINOR (AIRS/AFS) Business SIC classification: CRUSHED AND BROKEN LIMESTONE
REES CONSTRUCTION CO INC (FORWELL BRIDGE ROAD in ROCK CITY, IL)
STATE MASTER (Illinois EPA Project) - AIR PROGRAM AIR MINOR (AIRS/AFS) Business SIC classification: NONCLASSIFIABLE ESTABLISHMENTS
ILLINI PROTEIN (10014 N. ROCK CITY RD. in ROCK CITY, IL)
(Integrated Compliance Information System) - ICIS-05-1997-0221, FORMAL ENFORCEMENT ACTION TRI REPORTER (Tracking of toxic chemicals releasing facilities) Business SIC classification: DRY, CONDENSED, AND EVAPORATED DAIRY PRODUCTS Alternative names: BERNER CHEESE CORP.
ROCK CITY STP (ROUTE 75 in ROCK CITY, IL)
National Pollutant Discharge Elimination System NON-MAJOR (Tracking pollutant discharge elimination systems) - permit National Pollutant Discharge Elimination System NON-MAJOR (Tracking pollutant discharge elimination systems) - permit Business SIC classification: SEWERAGE SYSTEMS Alternative names: ROCK CITY STP, VILLAGE OF
45.0%Bottled, tank, or LP gas
37.3%Utility gas
15.1%Electricity
1.3%Wood
1.1%Other fuel
Population in 1990: 1,420.
Place of birth for U.S.-born residents:
This state: 880
Northeast: 4
Midwest: 356
South: 114
West: 7
68% of the 61070 zip code residents lived in the same house 5 years ago. Out of people who lived in different houses, 58% lived in this county. Out of people who lived in different counties, 50% lived in Illinois.
91% of the 61070 zip code residents lived in the same house 1 year ago. Out of people who lived in different houses, 88% moved from this county. Out of people who lived in different houses, 1% moved from different county within same state. Out of people who lived in different houses, 3% moved from different state. Out of people who lived in different houses, 2% moved from abroad.
Private vs. public school enrollment:
Students in private schools in grades 1 to 8 (elementary and middle school):
Here:
0.0%
Illinois:
13.3%
Students in private schools in grades 9 to 12 (high school): 4
Here:
14.7%
Illinois:
9.9%
Students in private undergraduate colleges: 14
Here:
15.4%
Illinois:
27.4%
Occupation by median earnings in the past 12 months ($)
103,553Business and financial operations occupations
98,532Construction and extraction occupations
78,188Management occupations
70,247Transportation occupations
69,827Sales and related occupations
63,022Production occupations
Top industries in this zip code by the number of employees in 2005:
Construction: Poured Concrete Foundation and Structure Contractors (1-4 employees: 1 establishment)
Finance and Insurance: Direct Health and Medical Insurance Carriers (1-4: 1)
Construction: Plumbing, Heating, and Air-Conditioning Contractors (1-4: 1)
Finance and Insurance: Insurance Agencies and Brokerages (1-4: 1)
2002 - 2018 National Fire Incident Reporting System (NFIRS) incidents
Based on the data from the years 2002 - 2018 the average number of fire incidents per year is 10. The highest number of fires - 23 took place in 2007, and the least - 1 in 2004. The data has a dropping trend.
When looking into fire subcategories, the most reports belonged to: Outside Fires (46.7%), and Structure Fires (40.0%).
Fire incident types reported to NFIRS in Zip Code 61070


 Nearest zip codes: 61019, 61018, 61067, 53550, 61060, 61063.


 Based on the data from the years 2002 - 2018 the average number of fire incidents per year is 10. The highest number of fires - 23 took place in 2007, and the least - 1 in 2004. The data has a dropping trend.
 When looking into fire subcategories, the most reports belonged to: Outside Fires (46.7%), and Structure Fires (40.0%).