Estimated zip code population in 2022: 1,157 Zip code population in 2010: 1,219 Zip code population in 2000: 301
Houses and condos: 554 Renter-occupied apartments: 313
% of renters here:
61%
State:
33%
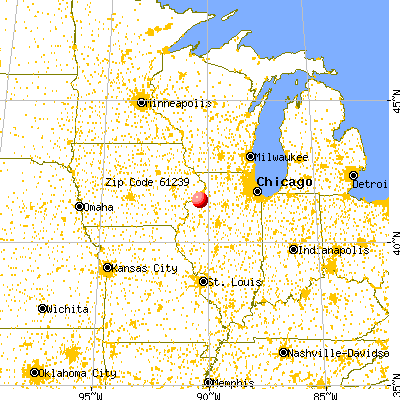
March 2022 cost of living index in zip code 61239: 85.4 (less than average, U.S. average is 100)
Land area: 1.7 sq. mi. Water area: 0.1 sq. mi.
Population density: 692 people per square mile
(low).
OSM Map
General Map
Google Map
MSN Map
OSM Map
General Map
Google Map
MSN Map
OSM Map
General Map
Google Map
MSN Map
OSM Map
General Map
Google Map
MSN Map
Please wait while loading the map...
Real estate property taxes paid for housing units in 2022:
This zip code:
1.7% ($1,734)
Illinois:
2.0% ($4,912)
Median real estate property taxes paid for housing units with mortgages in 2022: $1,493 (1.6%) Median real estate property taxes paid for housing units with no mortgage in 2022: $2,807 (1.8%)
Business Search- 14 Million verified businesses
Males: 533
(46.1%)
Females: 624
(53.9%)
For population 25 years and over in 61239:
High school or higher: 71.4%
Bachelor's degree or higher: 5.9%
Graduate or professional degree: 1.2%
Unemployed: 7.1%
Mean travel time to work (commute): 19.8 minutes
For population 15 years and over in 61239:
Never married: 42.6%
Now married: 38.2%
Separated: 1.7%
Widowed: 3.0%
Divorced: 14.4%
Zip code 61239 compared to state average:
Median household income below state average.
Median house value significantly below state average.
Median age below state average.
Foreign-born population percentage below state average.
Renting percentage above state average.
Length of stay since moving in significantly above state average.
House age below state average.
Number of college students significantly below state average.
Percentage of population with a bachelor's degree or higher significantly below state average.
Estimated median house/condo value in 2022: $100,914
61239:
$100,914
Illinois:
$251,600
Median resident age:
This zip code:
35.1 years
Illinois median age:
39.1 years
Average household size:
This zip code:
2.2 people
Illinois:
2.4 people
Averages for the 2020 tax year for zip code 61239, filed in 2021:
Average Adjusted Gross Income (AGI) in 2020: $39,402 (Individual Income Tax Returns)
Here:
$39,402
State:
$82,626
Salary/wage: $32,955 (reported on 84.6% of returns)
Here:
$32,955
State:
$66,640
(% of AGI for various income ranges: 1103.9% for AGIs below $25k, 3100.7% for AGIs $25k-50k, 4536.2% for AGIs $50k-75k, 8803.3% for AGIs $100k-200k)
Taxable interest for individuals: $590 (reported on 19.2% of returns)
This zip code:
$590
Illinois:
$2,376
(% of AGI for various income ranges: 6.7% for AGIs below $25k, 6.0% for AGIs $25k-50k, 13.8% for AGIs $50k-75k, 90.0% for AGIs $100k-200k)
Ordinary dividends: $1,475 (reported on 7.7% of returns)
Here:
$1,475
State:
$9,061
(% of AGI for various income ranges: 73.8% for AGIs $50k-75k)
Net capital gain/loss in AGI: +$1,750 (reported on 7.7% of returns)
Here:
+$1,750
State:
+$31,684
(% of AGI for various income ranges: 87.5% for AGIs $50k-75k)
Profit/loss from business: +$3,000 (reported on 11.5% of returns)
Here:
+$3,000
State:
+$12,175
(% of AGI for various income ranges: 57.2% for AGIs below $25k, 51.3% for AGIs $25k-50k)
Taxable individual retirement arrangement distribution: $7,333 (reported on 5.8% of returns)
61239:
$7,333
Illinois:
$21,613
(% of AGI for various income ranges: 146.7% for AGIs $25k-50k)
Earned income credit: $3,300 (reported on 26.9% of returns)
Here:
$3,300
State:
$2,311
(% of AGI for various income ranges: 180.0% for AGIs below $25k, 92.0% for AGIs $25k-50k)
Percentage of individuals using paid preparers for their 2020 taxes: 98.1%
Here:
98%
State:
93%
(% for various income ranges: 95.2% for AGIs below $25k, 100.0% for AGIs $25k-50k, 100.0% for AGIs $50k-75k, 100.0% for AGIs $75k-100k, 100.0% for AGIs $100k-200k)
Averages for the 2012 tax year for zip code 61239, filed in 2013:
Average Adjusted Gross Income (AGI) in 2012: $29,181 (Individual Income Tax Returns)
Here:
$29,181
State:
$68,058
Salary/wage: $27,382 (reported on 84.9% of returns)
Here:
$27,382
State:
$55,396
(% of AGI for various income ranges: 80.6% for AGIs below $25k, 87.7% for AGIs $25k-50k, 85.1% for AGIs $50k-75k, 65.7% for AGIs $75k-100k)
Taxable interest for individuals: $444 (reported on 17.0% of returns)
This zip code:
$444
Illinois:
$1,969
(% of AGI for various income ranges: 0.5% for AGIs below $25k, 0.2% for AGIs $25k-50k, 0.2% for AGIs $75k-100k)
Ordinary dividends: $950 (reported on 7.5% of returns)
Here:
$950
State:
$7,786
Profit/loss from business: +$1,580 (reported on 9.4% of returns)
Here:
+$1,580
State:
+$12,903
Taxable individual retirement arrangement distribution: $8,033 (reported on 5.7% of returns)
61239:
$8,033
Illinois:
$17,929
Total itemized deductions: $12,300 (20% of AGI, reported on 11.3% of returns)
Here:
$12,300
State:
$26,433
Here:
19.9% of AGI
State:
19.2% of AGI
Charity contributions: $1,800 (reported on 5.7% of returns)
Here:
$1,800
State:
$4,525
Taxes paid: $6,300 (reported on 9.4% of returns)
61239:
$6,300
State:
$11,968
Earned income credit: $2,676 (reported on 39.6% of returns)
Here:
$2,676
State:
$2,349
(% of AGI for various income ranges: 12.2% for AGIs below $25k, 1.4% for AGIs $25k-50k)
Percentage of individuals using paid preparers for their 2012 taxes: 49.1%
Here:
49%
State:
57%
(% for various income ranges: 48.4% for AGIs below $25k, 46.2% for AGIs $25k-50k, 60.0% for AGIs $50k-75k, 50.0% for AGIs $75k-100k)
Averages for the 2004 tax year for zip code 61239, filed in 2005:
Average Adjusted Gross Income (AGI) in 2004: $26,207 (Individual Income Tax Returns)
Here:
$26,207
State:
$54,625
Salary/wage: $22,610 (reported on 86.5% of returns)
Here:
$22,610
State:
$46,811
(% of AGI for various income ranges: 75.5% for AGIs below $10k, 80.0% for AGIs $10k-25k, 77.1% for AGIs $25k-50k, 78.9% for AGIs $50k-75k, 60.7% for AGIs $75k-100k)
Taxable interest for individuals: $1,098 (reported on 30.2% of returns)
This zip code:
$1,098
Illinois:
$2,101
(% of AGI for various income ranges: 2.7% for AGIs below $10k, 1.7% for AGIs $10k-25k, 1.5% for AGIs $25k-50k, 0.2% for AGIs $50k-75k, 1.1% for AGIs $75k-100k)
Taxable dividends: $872 (reported on 9.9% of returns)
Here:
$872
State:
$4,306
Profit/loss from business: +$5,314 (reported on 7.4% of returns)
Here:
+$5,314
State:
+$11,771
Total itemized deductions: $13,016 (24% of AGI, reported on 13.3% of returns)
Here:
$13,016
State:
$20,239
Here:
23.8% of AGI
State:
19.5% of AGI
(% of AGI for various income ranges: 12.9% for AGIs below $10k, 7.4% for AGIs $25k-50k, 7.8% for AGIs $50k-75k, 10.1% for AGIs $75k-100k)
Charity contributions deductions: $1,511 (3% of AGI, reported on 9.9% of returns)
Here:
$1,511
State:
$3,719
Here:
2.6% of AGI
State:
3.4% of AGI
Total tax: $3,091 (reported on 60.5% of returns)
61239:
$3,091
State:
$9,882
(% of AGI for various income ranges: 1.3% for AGIs below $10k, 3.0% for AGIs $10k-25k, 6.0% for AGIs $25k-50k, 9.0% for AGIs $50k-75k, 13.4% for AGIs $75k-100k)
Earned income credit: $2,033 (reported on 38.4% of returns)
Here:
$2,033
State:
$1,788
Percentage of individuals using paid preparers for their 2004 taxes: 58.4%
Here:
58%
State:
61%
(% for various income ranges: 52.6% for AGIs below $10k, 55.4% for AGIs $10k-25k, 63.3% for AGIs $25k-50k, 68.3% for AGIs $50k-75k, 76.0% for AGIs $75k-100k)
Household received Food Stamps/SNAP in the past 12 months: 76 Household did not receive Food Stamps/SNAP in the past 12 months: 439
Women who had a birth in the past 12 months: 4 (0 now married, 4 unmarried) Women who did not have a birth in the past 12 months: 288 (68 now married, 221 unmarried)
Housing units in zip code 61239 with a mortgage: 120 (3 second mortgage, 3 both second mortgage and home equity loan) Median monthly owner costs for units with a mortgage: $892 Median monthly owner costs for units without a mortgage: $664
Residents with income below the poverty level in 2022:
This zip code:
24.4%
Whole state:
11.9%
Residents with income below 50% of the poverty level in 2022:
This zip code:
18.9%
Whole state:
5.7%
Median number of rooms in houses and condos:
Here:
5.3
State:
6.4
Median number of rooms in apartments:
Here:
4.4
State:
4.1
Notable locations in this zip code not listed on our city pages
Notable locations in zip code 61239: Carbon Cliff Village Hall (A), Carbon Cliff Volunteer Fire Protection District (B). Display/hide their locations on the map
Size of family households: 201 2-persons, 51 3-persons, 54 4-persons, 4 5-persons, 10 6-persons
Size of nonfamily households: 152 1-person, 32 2-persons, 11 3-persons
83 married couples with children.
150 single-parent households (150 women).
90.8% of residents of 61239 zip code speak English at home.
4.2% of residents speak Spanish at home (77% very well, 23% well).
4.8% of residents speak other Indo-European language at home (65% very well, 35% well).
Foreign born population: 87 (7.6%) (14.9% of them are naturalized citizens)
This zip code:
7.6%
Whole state:
14.4%
47%Honduras
20%Sierra Leone
7%Austria
39%German
8%Belgian
4%Northern European
3%Irish
2%American
1%European
1%French Canadian
Year of entry for the foreign-born population
322010 or later
112000 to 2009
401990 to 1999
50Before 1990
Facilities with environmental interests located in this zip code:
LEONARD S UNIT STEP OF MOLINE INC (801 N 2ND AVE in CARBON CLIFF, IL)
STATE MASTER (Illinois EPA Project) - AIR PROGRAM AIR MINOR (AIRS/AFS) CRITERIA AND HAZARDOUS AIR POLLUTANT INVENTORY (Inventory of air pollution sources) Business SIC classification: READY-MIXED CONCRETE Alternative names: LEONARD'S UNIT STEP OF MOLINE INC
ALLAERT RENDERING CO (ALLAERT ACRES in CARBON CLIFF, IL)
STATE MASTER (Illinois EPA Project) - AIR PROGRAM AIR MINOR (AIRS/AFS) Business SIC classification: ANIMAL AND MARINE FATS AND OILS
CHICAGO ROCK ISLAND PACIFIC RAILROAD CO (KELLY YARD in CARBON CLIFF, IL)
STATE MASTER (Illinois EPA Project) - AIR PROGRAM AIR MINOR (AIRS/AFS) Business SIC classification: RAILROAD SWITCHING AND TERMINAL ESTABLISHMENTS
APOLLO ELEM SCHOOL (PO BOX 280 in CARBON CLIFF, IL)
(National Center for Education Statistics) - STATE ID-4908103602001 Organizations: CARBON CLIFF-BARSTOW SCH DIST 36 (SCHOOL DISTRICT)
PHOENIX PROGRAM (P O BOX 100 in CARBON CLIFF, IL)
(National Center for Education Statistics) - STATE ID-4908186506001 Organizations: BLACK HAWK AREA SP ED DISTRICT (SCHOOL DISTRICT)
PETERSON PARKING LOT STRIPING (HWY 84 AND 3RD in CARBON CLIFF, IL)
Small Quantity Generators, between 100 kg and 1000 kg of hazardous waste/month (Resource Conservation and Recovery Act (tracking hazardous waste)) - notification Organizations: PETERSON PARKING LOT STRIPING INC (CONTACT/OWNER)
Housing units lacking complete plumbing facilities: 1.0%
69.4%Utility gas
30.8%Electricity
Place of birth for U.S.-born residents:
This state: 658
Northeast: 10
Midwest: 190
South: 104
West: 60
60% of the 61239 zip code residents lived in the same house 5 years ago. Out of people who lived in different houses, 61% lived in this county. Out of people who lived in different counties, 50% lived in Illinois.
93% of the 61239 zip code residents lived in the same house 1 year ago. Out of people who lived in different houses, 70% moved from this county. Out of people who lived in different houses, 25% moved from different county within same state.
Private vs. public school enrollment:
Students in private schools in grades 1 to 8 (elementary and middle school): 7
Here:
4.8%
Illinois:
13.3%
Students in private schools in grades 9 to 12 (high school): 1
Here:
4.3%
Illinois:
9.9%
Students in private undergraduate colleges: 7
Here:
67.0%
Illinois:
27.4%
Occupation by median earnings in the past 12 months ($)
67,519Construction and extraction occupations
58,641Management occupations
42,789Sales and related occupations
38,755Production occupations
36,209Material moving occupations
34,868Office and administrative support occupations
Top industries in this zip code by the number of employees in 2005:
Construction: Highway, Street, and Bridge Construction (10-19 employees: 2 establishments)
Real Estate and Rental and Leasing: Construction, Mining, and Forestry Machinery and Equipment Rental and Leasing (10-19: 1)
Accommodation and Food Services: Full-Service Restaurants (10-19: 1)
Other Services (except Public Administration): Other Automotive Mechanical and Electrical Repair and Maintenance (5-9: 1)
Real Estate and Rental and Leasing: Residential Property Managers (5-9: 1)
Construction: Roofing Contractors (5-9: 1)
Health Care and Social Assistance: Other Individual and Family Services (5-9: 1)
Home Mortgage Disclosure Act Aggregated Statistics For Year 2009 (Based on 2 partial tracts)
A) FHA, FSA/RHS & VA Home Purchase Loans
B) Conventional Home Purchase Loans
C) Refinancings
D) Home Improvement Loans
Number
Average Value
Number
Average Value
Number
Average Value
Number
Average Value
LOANS ORIGINATED
1
$46,080
1
$69,290
3
$111,907
1
$7,730
APPLICATIONS APPROVED, NOT ACCEPTED
0
$0
0
$0
0
$0
0
$0
APPLICATIONS DENIED
0
$0
0
$0
1
$78,060
0
$0
APPLICATIONS WITHDRAWN
0
$0
0
$0
1
$75,760
0
$0
FILES CLOSED FOR INCOMPLETENESS
0
$0
0
$0
0
$0
0
$0
Aggregated Statistics For Year 2008 (Based on 2 partial tracts)
B) Conventional Home Purchase Loans
C) Refinancings
D) Home Improvement Loans
Number
Average Value
Number
Average Value
Number
Average Value
LOANS ORIGINATED
1
$101,580
2
$102,210
1
$14,480
APPLICATIONS APPROVED, NOT ACCEPTED
0
$0
0
$0
0
$0
APPLICATIONS DENIED
0
$0
1
$78,790
0
$0
APPLICATIONS WITHDRAWN
0
$0
0
$0
0
$0
FILES CLOSED FOR INCOMPLETENESS
0
$0
0
$0
0
$0
Aggregated Statistics For Year 2007 (Based on 2 partial tracts)
B) Conventional Home Purchase Loans
C) Refinancings
D) Home Improvement Loans
Number
Average Value
Number
Average Value
Number
Average Value
LOANS ORIGINATED
2
$104,295
2
$67,930
1
$13,950
APPLICATIONS APPROVED, NOT ACCEPTED
0
$0
0
$0
0
$0
APPLICATIONS DENIED
0
$0
1
$101,340
0
$0
APPLICATIONS WITHDRAWN
0
$0
0
$0
0
$0
FILES CLOSED FOR INCOMPLETENESS
0
$0
0
$0
0
$0
Aggregated Statistics For Year 2006 (Based on 2 partial tracts)
B) Conventional Home Purchase Loans
C) Refinancings
D) Home Improvement Loans
Number
Average Value
Number
Average Value
Number
Average Value
LOANS ORIGINATED
1
$143,760
2
$84,060
1
$16,110
APPLICATIONS APPROVED, NOT ACCEPTED
0
$0
0
$0
0
$0
APPLICATIONS DENIED
0
$0
1
$102,450
0
$0
APPLICATIONS WITHDRAWN
0
$0
1
$47,010
0
$0
FILES CLOSED FOR INCOMPLETENESS
0
$0
0
$0
0
$0
Aggregated Statistics For Year 2005 (Based on 2 partial tracts)
B) Conventional Home Purchase Loans
C) Refinancings
D) Home Improvement Loans
Number
Average Value
Number
Average Value
Number
Average Value
LOANS ORIGINATED
2
$90,880
3
$68,697
1
$29,610
APPLICATIONS APPROVED, NOT ACCEPTED
0
$0
0
$0
0
$0
APPLICATIONS DENIED
0
$0
2
$67,025
1
$23,940
APPLICATIONS WITHDRAWN
1
$48,860
1
$80,980
0
$0
FILES CLOSED FOR INCOMPLETENESS
0
$0
0
$0
0
$0
Aggregated Statistics For Year 2004 (Based on 2 partial tracts)
B) Conventional Home Purchase Loans
C) Refinancings
D) Home Improvement Loans
Number
Average Value
Number
Average Value
Number
Average Value
LOANS ORIGINATED
2
$93,335
3
$76,340
1
$12,280
APPLICATIONS APPROVED, NOT ACCEPTED
0
$0
0
$0
0
$0
APPLICATIONS DENIED
0
$0
2
$57,315
0
$0
APPLICATIONS WITHDRAWN
0
$0
1
$107,500
0
$0
FILES CLOSED FOR INCOMPLETENESS
0
$0
0
$0
0
$0
Aggregated Statistics For Year 2003 (Based on 2 partial tracts)
B) Conventional Home Purchase Loans
C) Refinancings
D) Home Improvement Loans
Number
Average Value
Number
Average Value
Number
Average Value
LOANS ORIGINATED
1
$169,160
6
$77,313
1
$10,930
APPLICATIONS APPROVED, NOT ACCEPTED
0
$0
0
$0
0
$0
APPLICATIONS DENIED
0
$0
2
$52,825
0
$0
APPLICATIONS WITHDRAWN
0
$0
1
$73,640
0
$0
FILES CLOSED FOR INCOMPLETENESS
0
$0
0
$0
0
$0
Aggregated Statistics For Year 2002 (Based on 2 partial tracts)
B) Conventional Home Purchase Loans
C) Refinancings
D) Home Improvement Loans
Number
Average Value
Number
Average Value
Number
Average Value
LOANS ORIGINATED
1
$132,900
3
$104,573
1
$11,970
APPLICATIONS APPROVED, NOT ACCEPTED
0
$0
0
$0
0
$0
APPLICATIONS DENIED
0
$0
2
$71,325
0
$0
APPLICATIONS WITHDRAWN
0
$0
1
$58,780
0
$0
FILES CLOSED FOR INCOMPLETENESS
0
$0
0
$0
0
$0
Aggregated Statistics For Year 2001 (Based on 2 partial tracts)
B) Conventional Home Purchase Loans
C) Refinancings
D) Home Improvement Loans
Number
Average Value
Number
Average Value
Number
Average Value
LOANS ORIGINATED
1
$144,520
4
$67,590
1
$13,990
APPLICATIONS APPROVED, NOT ACCEPTED
0
$0
0
$0
0
$0
APPLICATIONS DENIED
0
$0
1
$86,200
0
$0
APPLICATIONS WITHDRAWN
0
$0
1
$47,990
0
$0
FILES CLOSED FOR INCOMPLETENESS
0
$0
0
$0
0
$0
Aggregated Statistics For Year 2000 (Based on 2 partial tracts)
B) Conventional Home Purchase Loans
C) Refinancings
D) Home Improvement Loans
Number
Average Value
Number
Average Value
Number
Average Value
LOANS ORIGINATED
1
$88,910
1
$83,800
1
$17,190
APPLICATIONS APPROVED, NOT ACCEPTED
0
$0
0
$0
0
$0
APPLICATIONS DENIED
0
$0
1
$45,170
0
$0
APPLICATIONS WITHDRAWN
0
$0
1
$28,740
0
$0
FILES CLOSED FOR INCOMPLETENESS
0
$0
0
$0
0
$0
Aggregated Statistics For Year 1999 (Based on 1 partial tract)
Detailed PMIC statistics for the following Tracts:0202.00
2002 - 2018 National Fire Incident Reporting System (NFIRS) incidents
Based on the data from the years 2002 - 2018 the average number of fire incidents per year is 10. The highest number of fires - 26 took place in 2011, and the least - 1 in 2002. The data has a growing trend.
When looking into fire subcategories, the most reports belonged to: Structure Fires (40.1%), and Outside Fires (37.9%).
Fire incident types reported to NFIRS in Zip Code 61239


 Nearest zip codes: 61282, 61236, 61244, 61241, 61256, 61240.


 Based on the data from the years 2002 - 2018 the average number of fire incidents per year is 10. The highest number of fires - 26 took place in 2011, and the least - 1 in 2002. The data has a growing trend.
 When looking into fire subcategories, the most reports belonged to: Structure Fires (40.1%), and Outside Fires (37.9%).