Estimated zip code population in 2022: 2,675 Zip code population in 2010: 2,737 Zip code population in 2000: 2,807
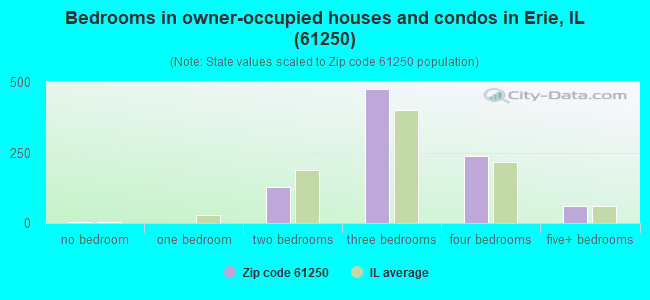
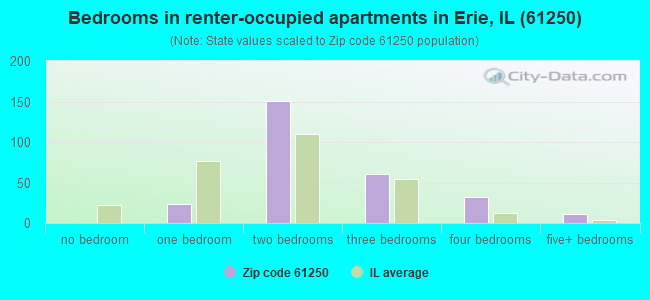
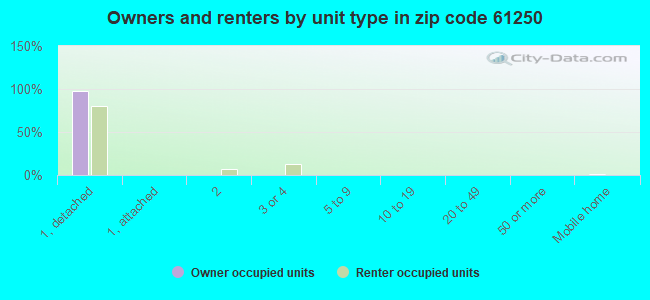
Houses and condos: 1,230 Renter-occupied apartments: 280
% of renters here:
24%
State:
33%
March 2022 cost of living index in zip code 61250: 84.6 (less than average, U.S. average is 100)
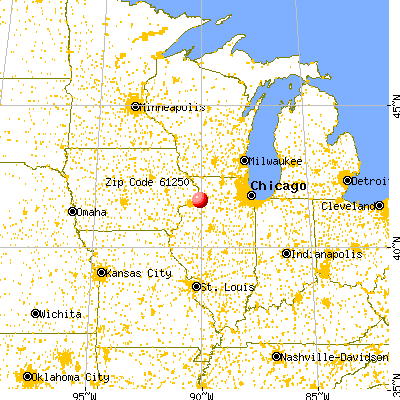
Land area: 85.7 sq. mi. Water area: 1.6 sq. mi.
Population density: 31 people per square mile
(very low).
OSM Map
General Map
Google Map
MSN Map
OSM Map
General Map
Google Map
MSN Map
OSM Map
General Map
Google Map
MSN Map
OSM Map
General Map
Google Map
MSN Map
Please wait while loading the map...
Real estate property taxes paid for housing units in 2022:
This zip code:
1.4% ($2,395)
Illinois:
2.0% ($4,912)
Median real estate property taxes paid for housing units with mortgages in 2022: $2,424 (1.4%) Median real estate property taxes paid for housing units with no mortgage in 2022: $2,383 (1.4%)
Averages for the 2020 tax year for zip code 61250, filed in 2021:
Average Adjusted Gross Income (AGI) in 2020: $64,610 (Individual Income Tax Returns)
Here:
$64,610
State:
$82,626
Salary/wage: $53,979 (reported on 80.6% of returns)
Here:
$53,979
State:
$66,640
(% of AGI for various income ranges: 1044.8% for AGIs below $25k, 3086.7% for AGIs $25k-50k, 5942.0% for AGIs $50k-75k, 8479.1% for AGIs $75k-100k, 14730.0% for AGIs $100k-200k)
Taxable interest for individuals: $1,555 (reported on 38.0% of returns)
This zip code:
$1,555
Illinois:
$2,376
(% of AGI for various income ranges: 33.6% for AGIs below $25k, 27.1% for AGIs $25k-50k, 92.0% for AGIs $50k-75k, 60.0% for AGIs $75k-100k, 188.1% for AGIs $100k-200k)
Ordinary dividends: $2,648 (reported on 20.9% of returns)
Here:
$2,648
State:
$9,061
(% of AGI for various income ranges: 14.4% for AGIs below $25k, 27.9% for AGIs $25k-50k, 79.3% for AGIs $50k-75k, 75.5% for AGIs $75k-100k, 141.2% for AGIs $100k-200k)
Net capital gain/loss in AGI: +$6,235 (reported on 15.5% of returns)
Here:
+$6,235
State:
+$31,684
(% of AGI for various income ranges: 23.6% for AGIs below $25k, 30.8% for AGIs $25k-50k, 21.3% for AGIs $50k-75k, 125.5% for AGIs $75k-100k, 590.0% for AGIs $100k-200k)
Profit/loss from business: +$9,856 (reported on 12.4% of returns)
Here:
+$9,856
State:
+$12,175
(% of AGI for various income ranges: 74.8% for AGIs below $25k, 130.4% for AGIs $25k-50k, 372.7% for AGIs $50k-75k, 323.8% for AGIs $100k-200k)
Taxable individual retirement arrangement distribution: $16,200 (reported on 10.9% of returns)
61250:
$16,200
Illinois:
$21,613
(% of AGI for various income ranges: 56.4% for AGIs below $25k, 87.9% for AGIs $25k-50k, 134.7% for AGIs $50k-75k, 309.1% for AGIs $75k-100k, 858.8% for AGIs $100k-200k)
Total itemized deductions: $24,300 (reported on 3.1% of returns)
Here:
$24,300
State:
$34,948
(% of AGI for various income ranges: 607.5% for AGIs $100k-200k)
Taxes paid: $6,900 (reported on 3.1% of returns)
61250:
$6,900
State:
$8,563
(% of AGI for various income ranges: 172.5% for AGIs $100k-200k)
Earned income credit: $2,208 (reported on 10.1% of returns)
Here:
$2,208
State:
$2,311
(% of AGI for various income ranges: 57.2% for AGIs below $25k, 60.0% for AGIs $25k-50k)
Percentage of individuals using paid preparers for their 2020 taxes: 95.3%
Here:
95%
State:
93%
(% for various income ranges: 94.4% for AGIs below $25k, 96.6% for AGIs $25k-50k, 95.0% for AGIs $50k-75k, 93.3% for AGIs $75k-100k, 100.0% for AGIs $100k-200k, 75.0% for AGIs over 200k)
Averages for the 2012 tax year for zip code 61250, filed in 2013:
Average Adjusted Gross Income (AGI) in 2012: $55,525 (Individual Income Tax Returns)
Here:
$55,525
State:
$68,058
Salary/wage: $45,799 (reported on 82.6% of returns)
Here:
$45,799
State:
$55,396
(% of AGI for various income ranges: 63.7% for AGIs below $25k, 70.2% for AGIs $25k-50k, 73.4% for AGIs $50k-75k, 75.6% for AGIs $75k-100k, 74.2% for AGIs $100k-200k, 32.3% for AGIs over 200k)
Taxable interest for individuals: $1,226 (reported on 43.9% of returns)
This zip code:
$1,226
Illinois:
$1,969
(% of AGI for various income ranges: 2.6% for AGIs below $25k, 0.8% for AGIs $25k-50k, 0.9% for AGIs $50k-75k, 0.7% for AGIs $75k-100k, 1.2% for AGIs $100k-200k, 0.3% for AGIs over 200k)
Ordinary dividends: $2,287 (reported on 22.7% of returns)
Here:
$2,287
State:
$7,786
(% of AGI for various income ranges: 1.5% for AGIs below $25k, 0.3% for AGIs $25k-50k, 0.9% for AGIs $50k-75k, 0.8% for AGIs $75k-100k, 1.5% for AGIs $100k-200k)
Net capital gain/loss in AGI: +$11,238 (reported on 12.1% of returns)
Here:
+$11,238
State:
+$22,183
(% of AGI for various income ranges: 0.3% for AGIs $25k-50k, 0.2% for AGIs $50k-75k, 0.6% for AGIs $75k-100k, 8.1% for AGIs $100k-200k)
Profit/loss from business: +$5,688 (reported on 12.9% of returns)
Here:
+$5,688
State:
+$12,903
(% of AGI for various income ranges: 3.1% for AGIs below $25k, 1.8% for AGIs $25k-50k, 1.9% for AGIs $50k-75k, 2.4% for AGIs $75k-100k)
Taxable individual retirement arrangement distribution: $7,093 (reported on 10.6% of returns)
61250:
$7,093
Illinois:
$17,929
(% of AGI for various income ranges: 3.7% for AGIs below $25k, 2.1% for AGIs $25k-50k, 2.5% for AGIs $50k-75k, 1.2% for AGIs $100k-200k)
Total itemized deductions: $18,781 (18% of AGI, reported on 24.2% of returns)
Here:
$18,781
State:
$26,433
Here:
17.9% of AGI
State:
19.2% of AGI
(% of AGI for various income ranges: 5.2% for AGIs below $25k, 6.5% for AGIs $25k-50k, 6.6% for AGIs $50k-75k, 8.6% for AGIs $75k-100k, 10.0% for AGIs $100k-200k, 9.6% for AGIs over 200k)
Charity contributions: $3,820 (reported on 18.9% of returns)
Here:
$3,820
State:
$4,525
(% of AGI for various income ranges: 1.1% for AGIs $25k-50k, 0.7% for AGIs $50k-75k, 1.2% for AGIs $75k-100k, 2.8% for AGIs $100k-200k)
Taxes paid: $7,088 (reported on 24.2% of returns)
61250:
$7,088
State:
$11,968
(% of AGI for various income ranges: 1.0% for AGIs below $25k, 1.3% for AGIs $25k-50k, 2.0% for AGIs $50k-75k, 3.1% for AGIs $75k-100k, 4.6% for AGIs $100k-200k, 4.6% for AGIs over 200k)
Earned income credit: $2,093 (reported on 11.4% of returns)
Here:
$2,093
State:
$2,349
(% of AGI for various income ranges: 4.1% for AGIs below $25k, 1.1% for AGIs $25k-50k)
Percentage of individuals using paid preparers for their 2012 taxes: 68.9%
Here:
69%
State:
57%
(% for various income ranges: 62.2% for AGIs below $25k, 66.7% for AGIs $25k-50k, 70.8% for AGIs $50k-75k, 76.5% for AGIs $75k-100k, 75.0% for AGIs $100k-200k, 100.0% for AGIs over 200k)
Averages for the 2004 tax year for zip code 61250, filed in 2005:
Average Adjusted Gross Income (AGI) in 2004: $42,706 (Individual Income Tax Returns)
Here:
$42,706
State:
$54,625
Salary/wage: $34,811 (reported on 83.2% of returns)
Here:
$34,811
State:
$46,811
(% of AGI for various income ranges: 100.5% for AGIs below $10k, 66.3% for AGIs $10k-25k, 72.5% for AGIs $25k-50k, 77.6% for AGIs $50k-75k, 83.0% for AGIs $75k-100k, 43.0% for AGIs over 100k)
Taxable interest for individuals: $1,571 (reported on 57.0% of returns)
This zip code:
$1,571
Illinois:
$2,101
(% of AGI for various income ranges: 10.4% for AGIs below $10k, 4.1% for AGIs $10k-25k, 2.7% for AGIs $25k-50k, 1.7% for AGIs $50k-75k, 0.9% for AGIs $75k-100k, 1.5% for AGIs over 100k)
Taxable dividends: $916 (reported on 27.4% of returns)
Here:
$916
State:
$4,306
(% of AGI for various income ranges: 1.8% for AGIs below $10k, 0.9% for AGIs $10k-25k, 0.4% for AGIs $25k-50k, 0.6% for AGIs $50k-75k, 0.4% for AGIs $75k-100k, 0.7% for AGIs over 100k)
Net capital gain/loss: +$2,424 (reported on 19.6% of returns)
Here:
+$2,424
State:
+$17,321
(% of AGI for various income ranges: 4.8% for AGIs below $10k, -0.3% for AGIs $10k-25k, -0.1% for AGIs $25k-50k, 0.3% for AGIs $50k-75k, 0.3% for AGIs $75k-100k, 3.5% for AGIs over 100k)
Profit/loss from business: +$4,211 (reported on 12.0% of returns)
Here:
+$4,211
State:
+$11,771
(% of AGI for various income ranges: -9.1% for AGIs below $10k, 2.5% for AGIs $10k-25k, 2.1% for AGIs $25k-50k, 1.1% for AGIs $50k-75k, 0.7% for AGIs $75k-100k, 1.3% for AGIs over 100k)
Profit/loss from farming: +$3,955 (reported on 6.7% of returns)
Here:
+$3,955
State:
+$2,327
(% of AGI for various income ranges: -19.2% for AGIs below $10k, 2.1% for AGIs $25k-50k, 2.4% for AGIs $50k-75k, -0.3% for AGIs $75k-100k)
IRA payment deduction: $2,742 (reported on 2.3% of returns)
61250:
$2,742
Illinois:
$3,087
Total itemized deductions: $14,918 (18% of AGI, reported on 23.7% of returns)
Here:
$14,918
State:
$20,239
Here:
18.0% of AGI
State:
19.5% of AGI
(% of AGI for various income ranges: 9.3% for AGIs $10k-25k, 8.8% for AGIs $25k-50k, 8.2% for AGIs $50k-75k, 9.8% for AGIs $75k-100k, 7.2% for AGIs over 100k)
Charity contributions deductions: $3,118 (4% of AGI, reported on 19.0% of returns)
Here:
$3,118
State:
$3,719
Here:
4.1% of AGI
State:
3.4% of AGI
(% of AGI for various income ranges: 0.8% for AGIs $10k-25k, 1.1% for AGIs $25k-50k, 1.3% for AGIs $50k-75k, 2.2% for AGIs $75k-100k, 1.4% for AGIs over 100k)
Total tax: $5,509 (reported on 74.1% of returns)
61250:
$5,509
State:
$9,882
(% of AGI for various income ranges: 2.6% for AGIs below $10k, 4.1% for AGIs $10k-25k, 6.8% for AGIs $25k-50k, 9.0% for AGIs $50k-75k, 10.5% for AGIs $75k-100k, 13.8% for AGIs over 100k)
Earned income credit: $1,453 (reported on 11.9% of returns)
Here:
$1,453
State:
$1,788
Percentage of individuals using paid preparers for their 2004 taxes: 67.0%
Here:
67%
State:
61%
(% for various income ranges: 56.8% for AGIs below $10k, 68.3% for AGIs $10k-25k, 70.0% for AGIs $25k-50k, 72.2% for AGIs $50k-75k, 68.1% for AGIs $75k-100k, 74.0% for AGIs over 100k)
Household received Food Stamps/SNAP in the past 12 months: 72 Household did not receive Food Stamps/SNAP in the past 12 months: 1,094
Women who had a birth in the past 12 months: 15 (15 now married, 0 unmarried) Women who did not have a birth in the past 12 months: 470 (189 now married, 281 unmarried)
Housing units in zip code 61250 with a mortgage: 472 (18 second mortgage, 13 both second mortgage and home equity loan) Houses without a mortgage: 11
Median monthly owner costs for units with a mortgage: $1,172 Median monthly owner costs for units without a mortgage: $576
Residents with income below the poverty level in 2022:
This zip code:
5.6%
Whole state:
11.9%
Residents with income below 50% of the poverty level in 2022:
This zip code:
3.0%
Whole state:
5.7%
Median number of rooms in houses and condos:
Here:
7.1
State:
6.4
Median number of rooms in apartments:
Here:
4.3
State:
4.1
Notable locations in this zip code not listed on our city pages
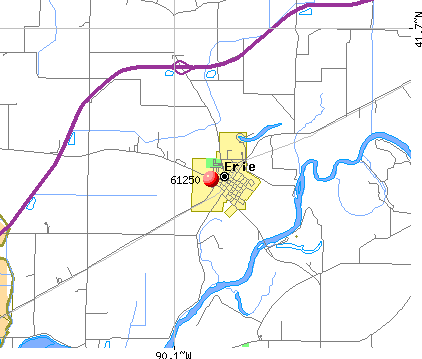
Churches in zip code 61250 include: Erie Baptist Church (A), Saint Ambrose Catholic Church (B), Sharon Church (C), Erie Evangelical Free Church (D), Newton Zion Reformed Church (E). Display/hide their locations on the map
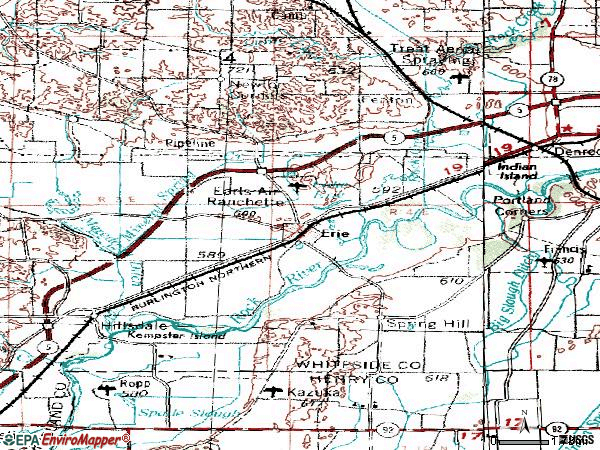
Streams, rivers, and creeks: Mineral Spring Creek (A), Carson Slough (B), Canoe Creek (C), Rock Creek (D), Hadaway Slough (E). Display/hide their locations on the map
Size of family households: 423 2-persons, 238 3-persons, 90 4-persons, 59 5-persons, 11 6-persons, 24 7-or-more-persons
Size of nonfamily households: 319 1-person, 6 2-persons
488 married couples with children.
238 single-parent households (36 men, 202 women).
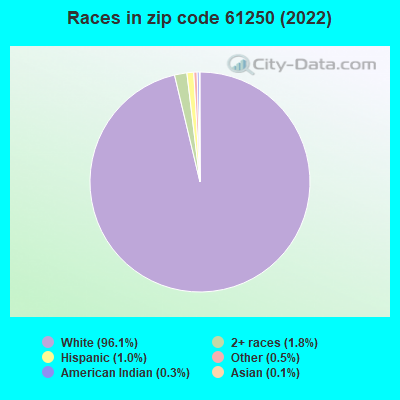
99.6% of residents of 61250 zip code speak English at home.
0.1% of residents speak Asian or Pacific Island language at home (100% very well).
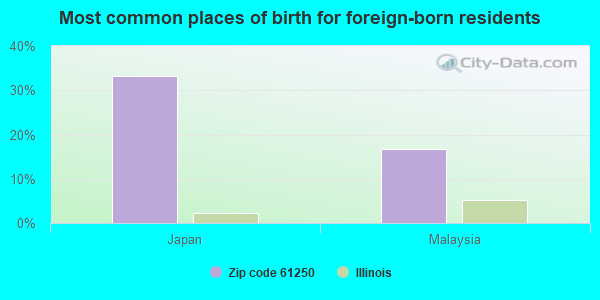
Foreign born population: 6 (0.2%) (100.0% of them are naturalized citizens)
This zip code:
0.2%
Whole state:
14.4%
33%Japan
17%Malaysia
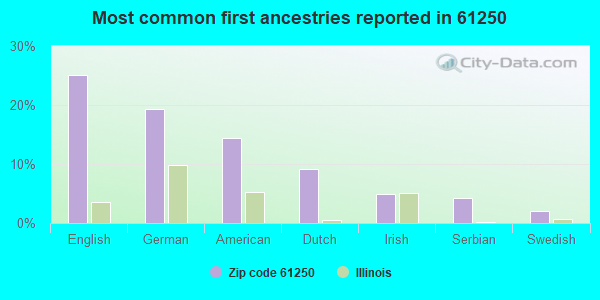
25%English
19%German
14%American
9%Dutch
5%Irish
4%Serbian
2%Swedish
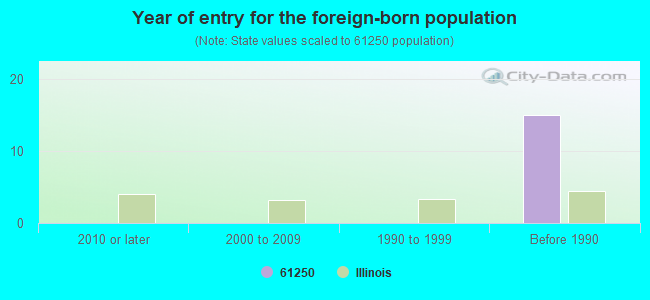
Year of entry for the foreign-born population
02010 or later
02000 to 2009
01990 to 1999
15Before 1990
Facilities with environmental interests located in this zip code:
QUALITY READY MIX CONCRETE CO (MOLINE RD in ERIE, IL)
STATE MASTER (Illinois EPA Project) - AIR PROGRAM AIR MINOR (AIRS/AFS) CRITERIA AND HAZARDOUS AIR POLLUTANT INVENTORY (Inventory of air pollution sources) Business SIC classification: READY-MIXED CONCRETE Business NAICS classification: READY-MIX CONCRETE MANUFACTURING.
PEARCE OIL CO (1301 8TH AVE in ERIE, IL)
STATE MASTER (Illinois EPA Project) - AIR PROGRAM AIR MINOR (AIRS/AFS) Business SIC classification: PETROLEUM BULK STATIONS AND TERMINALS
CLAUD W GREEN (STATE RTE 2 in ERIE, IL)
STATE MASTER (Illinois EPA Project) - AIR PROGRAM AIR MINOR (AIRS/AFS) Business SIC classification: PETROLEUM BULK STATIONS AND TERMINALS
IMC FERTILIZER INC (IL HWY 2 NORTH OF ERIE in ERIE, IL)
Conditionally Exempt Small Quantity Generators, less than 100 kg/month of hazardous waste (Resource Conservation and Recovery Act (tracking hazardous waste))
DAVES GARAGE (701 MAIN ST in ERIE, IL)
Small Quantity Generators, between 100 kg and 1000 kg of hazardous waste/month (Resource Conservation and Recovery Act (tracking hazardous waste)) - notification
Housing units lacking complete plumbing facilities: 0.3%
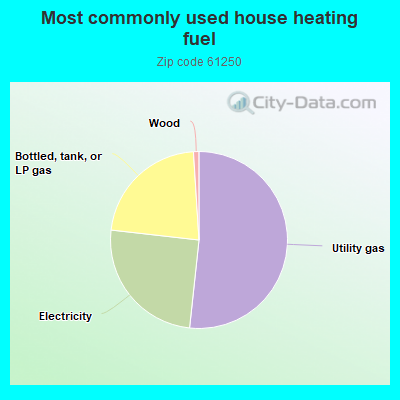
51.7%Utility gas
25.1%Electricity
22.2%Bottled, tank, or LP gas
1.0%Wood
Population in 1990: 2,428. Population change in the 1990s: +379 (+15.6%).
Place of birth for U.S.-born residents:
This state: 1,718
Northeast: 11
Midwest: 666
South: 184
West: 76
64% of the 61250 zip code residents lived in the same house 5 years ago. Out of people who lived in different houses, 65% lived in this county. Out of people who lived in different counties, 50% lived in Illinois.
96% of the 61250 zip code residents lived in the same house 1 year ago. Out of people who lived in different houses, 61% moved from this county. Out of people who lived in different houses, 42% moved from different state.
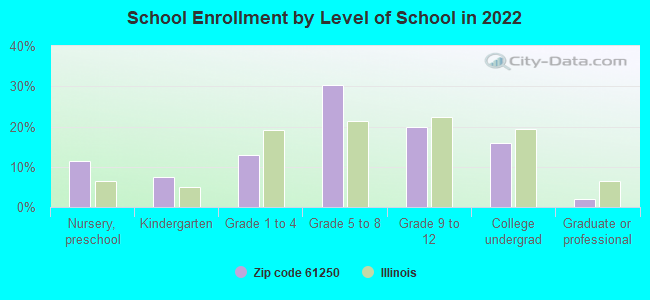
Private vs. public school enrollment:
Students in private schools in grades 1 to 8 (elementary and middle school): 5
Here:
1.4%
Illinois:
13.3%
Students in private schools in grades 9 to 12 (high school): 20
Here:
12.2%
Illinois:
9.9%
Students in private undergraduate colleges:
Here:
0.0%
Illinois:
27.4%
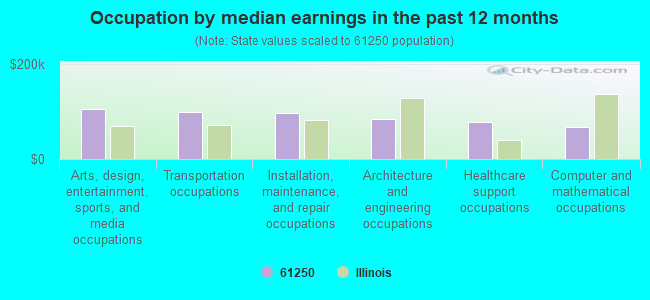
Occupation by median earnings in the past 12 months ($)
104,437Arts, design, entertainment, sports, and media occupations
99,687Transportation occupations
97,472Installation, maintenance, and repair occupations
84,721Architecture and engineering occupations
78,162Healthcare support occupations
66,436Computer and mathematical occupations
Top industries in this zip code by the number of employees in 2005:
Other Services (except Public Administration): Commercial and Industrial Machinery and Equipment (except Automotive and Electronic) Repair and Maintenance (50-99 employees: 1 establishment)
Other Services (except Public Administration): Religious Organizations (10-19: 1, 5-9: 1, 1-4: 1)
Administrative and Support and Waste Management and Remediation Services: Exterminating and Pest Control Services (10-19: 1, 1-4: 1)
Finance and Insurance: Commercial Banking (5-9: 2)
Accommodation and Food Services: Full-Service Restaurants (5-9: 1, 1-4: 3)
Finance and Insurance: Insurance Agencies and Brokerages (1-4: 5)
Fatal accident statistics in 2014:
Fatal accident count: 1
Vehicles involved in fatal accidents: 1
Fatal accidents caused by drunken drivers: 0
Fatalities: 2
Persons involved in fatal accidents: 2
Pedestrians involved in fatal accidents: 0
Fatal accident statistics in 2012:
Fatal accident count: 1
Vehicles involved in fatal accidents: 2
Fatal accidents caused by drunken drivers: 0
Fatalities: 1
Persons involved in fatal accidents: 2
Pedestrians involved in fatal accidents: 0
2002 - 2018 National Fire Incident Reporting System (NFIRS) incidents
Based on the data from the years 2002 - 2018 the average number of fires per year is 24. The highest number of reported fire incidents - 60 took place in 2003, and the least - 2 in 2002. The data has a growing trend.
When looking into fire subcategories, the most incidents belonged to: Outside Fires (56.7%), and Structure Fires (25.2%).
Fire incident types reported to NFIRS in Zip Code 61250


 Nearest zip codes: 61251, 61257, 61230, 61242, 61252, 61277.


 Based on the data from the years 2002 - 2018 the average number of fires per year is 24. The highest number of reported fire incidents - 60 took place in 2003, and the least - 2 in 2002. The data has a growing trend.
 When looking into fire subcategories, the most incidents belonged to: Outside Fires (56.7%), and Structure Fires (25.2%).