Estimated zip code population in 2022: 723 Zip code population in 2010: 1,188 Zip code population in 2000: 878
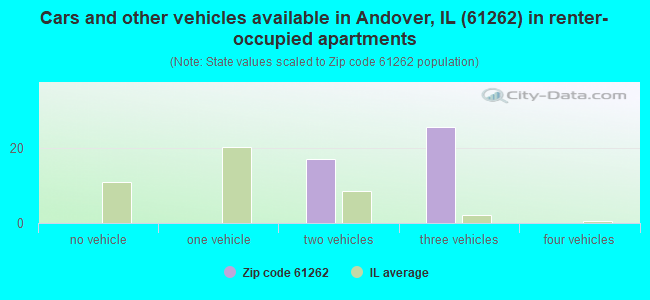
Houses and condos: 301 Renter-occupied apartments: 43
% of renters here:
15%
State:
33%
March 2022 cost of living index in zip code 61262: 84.8 (less than average, U.S. average is 100)
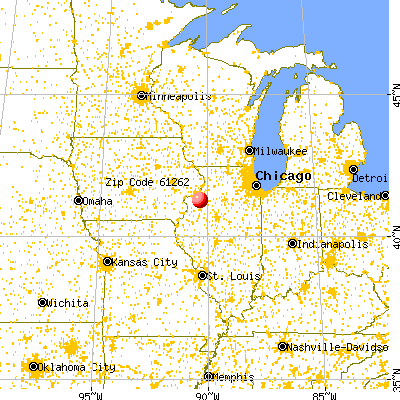
Land area: 43.0 sq. mi. Water area: 0.0 sq. mi.
Population density: 17 people per square mile
(very low).
OSM Map
General Map
Google Map
MSN Map
OSM Map
General Map
Google Map
MSN Map
OSM Map
General Map
Google Map
MSN Map
OSM Map
General Map
Google Map
MSN Map
Please wait while loading the map...
Real estate property taxes paid for housing units in 2022:
This zip code:
1.6% ($3,487)
Illinois:
2.0% ($4,912)
Median real estate property taxes paid for housing units with mortgages in 2022: $3,259 (2.3%) Median real estate property taxes paid for housing units with no mortgage in 2022: $3,642 (2.6%)
Business Search- 14 Million verified businesses
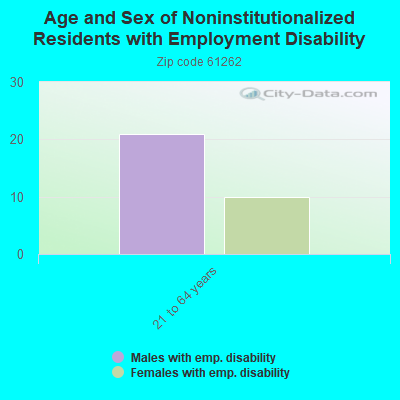
Males: 339
(46.9%)
Females: 384
(53.1%)
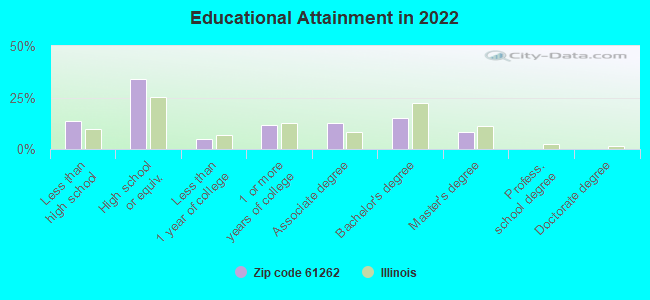
For population 25 years and over in 61262:
High school or higher: 88.3%
Bachelor's degree or higher: 24.0%
Graduate or professional degree: 8.6%
Unemployed: 5.1%
Mean travel time to work (commute): 26.5 minutes
For population 15 years and over in 61262:
Never married: 12.7%
Now married: 74.7%
Separated: 0.0%
Widowed: 1.2%
Divorced: 11.5%
Zip code 61262 compared to state average:
Black race population percentage significantly below state average.
Hispanic race population percentage significantly below state average.
Median age above state average.
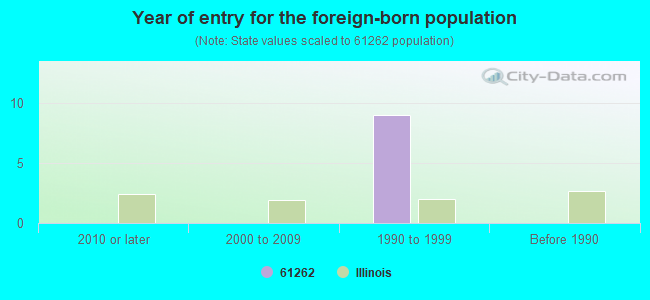
Foreign-born population percentage significantly below state average.
Renting percentage below state average.
Length of stay since moving in below state average.
Number of college students below state average.
Percentage of population with a bachelor's degree or higher below state average.
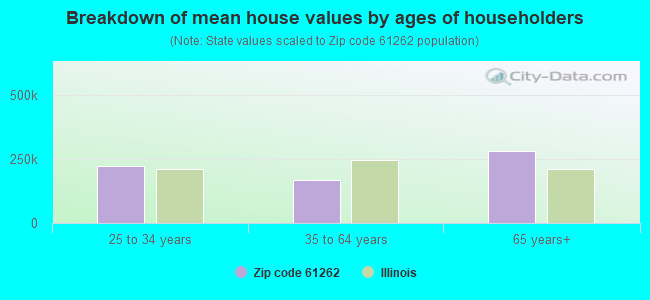
Estimated median house/condo value in 2022: $220,137
61262:
$220,137
Illinois:
$251,600
According to our research of Illinois and other state lists, there were 2 registered sex offenders living in 61262 zip code as of May 28, 2024. The ratio of all residents to sex offenders in zip code 61262 is 642 to 1. The ratio of registered sex offenders to all residents in this zip code is near the state average.
Median resident age:
This zip code:
44.9 years
Illinois median age:
39.1 years
Average household size:
This zip code:
2.5 people
Illinois:
2.4 people
Averages for the 2020 tax year for zip code 61262, filed in 2021:
Average Adjusted Gross Income (AGI) in 2020: $73,606 (Individual Income Tax Returns)
Here:
$73,606
State:
$82,626
Salary/wage: $60,267 (reported on 75.0% of returns)
Here:
$60,267
State:
$66,640
(% of AGI for various income ranges: 1043.3% for AGIs below $25k, 4132.5% for AGIs $25k-50k, 4102.5% for AGIs $50k-75k, 8943.3% for AGIs $75k-100k, 19338.0% for AGIs $100k-200k)
Taxable interest for individuals: $695 (reported on 58.3% of returns)
This zip code:
$695
Illinois:
$2,376
(% of AGI for various income ranges: 85.0% for AGIs below $25k, 25.0% for AGIs $25k-50k, 37.5% for AGIs $50k-75k, 43.3% for AGIs $75k-100k, 114.0% for AGIs $100k-200k)
Ordinary dividends: $1,900 (reported on 22.2% of returns)
Here:
$1,900
State:
$9,061
(% of AGI for various income ranges: 100.0% for AGIs $50k-75k, 224.0% for AGIs $100k-200k)
Net capital gain/loss in AGI: +$3,383 (reported on 16.7% of returns)
Here:
+$3,383
State:
+$31,684
(% of AGI for various income ranges: 36.7% for AGIs below $25k, 362.0% for AGIs $100k-200k)
Profit/loss from business: +$11,625 (reported on 11.1% of returns)
Here:
+$11,625
State:
+$12,175
(% of AGI for various income ranges: 1550.0% for AGIs $75k-100k)
Taxable individual retirement arrangement distribution: $14,020 (reported on 13.9% of returns)
61262:
$14,020
Illinois:
$21,613
(% of AGI for various income ranges: 290.0% for AGIs below $25k, 1317.5% for AGIs $50k-75k)
Earned income credit: $1,400 (reported on 5.6% of returns)
Here:
$1,400
State:
$2,311
(% of AGI for various income ranges: 46.7% for AGIs below $25k)
Percentage of individuals using paid preparers for their 2020 taxes: 97.2%
Here:
97%
State:
93%
(% for various income ranges: 90.0% for AGIs below $25k, 100.0% for AGIs $25k-50k, 100.0% for AGIs $50k-75k, 100.0% for AGIs $75k-100k, 100.0% for AGIs $100k-200k)
Averages for the 2012 tax year for zip code 61262, filed in 2013:
Average Adjusted Gross Income (AGI) in 2012: $61,115 (Individual Income Tax Returns)
Here:
$61,115
State:
$68,058
Salary/wage: $47,709 (reported on 82.1% of returns)
Here:
$47,709
State:
$55,396
(% of AGI for various income ranges: 65.8% for AGIs below $25k, 69.6% for AGIs $25k-50k, 68.9% for AGIs $50k-75k, 68.0% for AGIs $75k-100k, 58.8% for AGIs $100k-200k)
Taxable interest for individuals: $519 (reported on 53.8% of returns)
This zip code:
$519
Illinois:
$1,969
(% of AGI for various income ranges: 0.6% for AGIs below $25k, 0.5% for AGIs $25k-50k, 0.2% for AGIs $50k-75k, 0.7% for AGIs $75k-100k, 0.4% for AGIs $100k-200k)
Ordinary dividends: $830 (reported on 25.6% of returns)
Here:
$830
State:
$7,786
(% of AGI for various income ranges: 0.5% for AGIs $25k-50k, 0.4% for AGIs $75k-100k, 0.5% for AGIs $100k-200k)
Net capital gain/loss in AGI: +$7,217 (reported on 15.4% of returns)
Here:
+$7,217
State:
+$22,183
Profit/loss from business: +$4,140 (reported on 12.8% of returns)
Here:
+$4,140
State:
+$12,903
Taxable individual retirement arrangement distribution: $10,133 (reported on 7.7% of returns)
61262:
$10,133
Illinois:
$17,929
Total itemized deductions: $19,556 (17% of AGI, reported on 23.1% of returns)
Here:
$19,556
State:
$26,433
Here:
17.2% of AGI
State:
19.2% of AGI
(% of AGI for various income ranges: 15.4% for AGIs $25k-50k, 8.6% for AGIs $75k-100k, 8.1% for AGIs $100k-200k)
Charity contributions: $2,225 (reported on 20.5% of returns)
Here:
$2,225
State:
$4,525
Taxes paid: $9,289 (reported on 23.1% of returns)
61262:
$9,289
State:
$11,968
(% of AGI for various income ranges: 5.5% for AGIs $25k-50k, 3.7% for AGIs $75k-100k, 4.5% for AGIs $100k-200k)
Earned income credit: $2,400 (reported on 7.7% of returns)
Here:
$2,400
State:
$2,349
(% of AGI for various income ranges: 5.7% for AGIs below $25k)
Percentage of individuals using paid preparers for their 2012 taxes: 61.5%
Here:
62%
State:
57%
(% for various income ranges: 41.7% for AGIs below $25k, 62.5% for AGIs $25k-50k, 83.3% for AGIs $50k-75k, 66.7% for AGIs $75k-100k, 71.4% for AGIs $100k-200k)
Averages for the 2004 tax year for zip code 61262, filed in 2005:
Average Adjusted Gross Income (AGI) in 2004: $42,725 (Individual Income Tax Returns)
Here:
$42,725
State:
$54,625
Salary/wage: $37,152 (reported on 81.6% of returns)
Here:
$37,152
State:
$46,811
(% of AGI for various income ranges: 139.9% for AGIs below $10k, 62.0% for AGIs $10k-25k, 65.2% for AGIs $25k-50k, 75.3% for AGIs $50k-75k, 76.2% for AGIs $75k-100k, 65.4% for AGIs over 100k)
Taxable interest for individuals: $1,398 (reported on 58.6% of returns)
This zip code:
$1,398
Illinois:
$2,101
(% of AGI for various income ranges: 9.1% for AGIs below $10k, 5.0% for AGIs $10k-25k, 1.4% for AGIs $25k-50k, 2.1% for AGIs $50k-75k, 0.9% for AGIs $75k-100k, 1.5% for AGIs over 100k)
Taxable dividends: $873 (reported on 29.3% of returns)
Here:
$873
State:
$4,306
(% of AGI for various income ranges: 3.0% for AGIs below $10k, 0.2% for AGIs $10k-25k, 0.5% for AGIs $25k-50k, 0.4% for AGIs $50k-75k, 0.7% for AGIs $75k-100k, 0.8% for AGIs over 100k)
Net capital gain/loss: +$1,215 (reported on 19.6% of returns)
Here:
+$1,215
State:
+$17,321
(% of AGI for various income ranges: -6.8% for AGIs below $10k, 1.6% for AGIs $25k-50k, 1.5% for AGIs $50k-75k, -0.1% for AGIs over 100k)
Profit/loss from business: +$4,909 (reported on 10.9% of returns)
Here:
+$4,909
State:
+$11,771
Profit/loss from farming: +$7,867 (reported on 11.2% of returns)
Here:
+$7,867
State:
+$2,327
Total itemized deductions: $14,758 (20% of AGI, reported on 24.6% of returns)
Here:
$14,758
State:
$20,239
Here:
19.6% of AGI
State:
19.5% of AGI
(% of AGI for various income ranges: 45.9% for AGIs below $10k, 8.5% for AGIs $25k-50k, 7.5% for AGIs $50k-75k, 8.4% for AGIs $75k-100k, 9.5% for AGIs over 100k)
Charity contributions deductions: $2,175 (3% of AGI, reported on 19.9% of returns)
Here:
$2,175
State:
$3,719
Here:
2.6% of AGI
State:
3.4% of AGI
(% of AGI for various income ranges: 0.6% for AGIs $25k-50k, 1.1% for AGIs $50k-75k, 0.6% for AGIs $75k-100k, 1.9% for AGIs over 100k)
Total tax: $6,020 (reported on 74.7% of returns)
61262:
$6,020
State:
$9,882
(% of AGI for various income ranges: 2.4% for AGIs below $10k, 3.9% for AGIs $10k-25k, 7.0% for AGIs $25k-50k, 8.4% for AGIs $50k-75k, 10.7% for AGIs $75k-100k, 17.8% for AGIs over 100k)
Earned income credit: $1,364 (reported on 8.2% of returns)
Here:
$1,364
State:
$1,788
Percentage of individuals using paid preparers for their 2004 taxes: 64.0%
Here:
64%
State:
61%
(% for various income ranges: 58.5% for AGIs below $10k, 59.5% for AGIs $10k-25k, 63.5% for AGIs $25k-50k, 70.4% for AGIs $50k-75k, 71.8% for AGIs $75k-100k, 69.0% for AGIs over 100k)
Household received Food Stamps/SNAP in the past 12 months: 0 Household did not receive Food Stamps/SNAP in the past 12 months: 280
Women who had a birth in the past 12 months: 19 (19 now married, 0 unmarried) Women who did not have a birth in the past 12 months: 154 (94 now married, 59 unmarried)
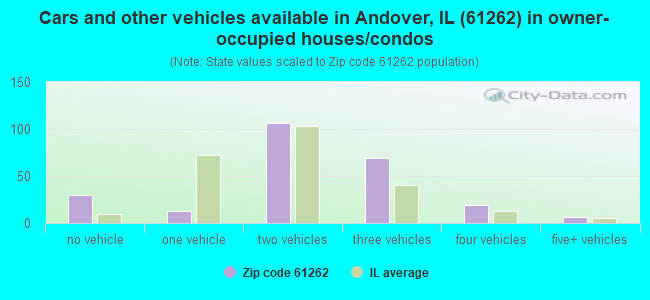
Housing units in zip code 61262 with a mortgage: 67 (8 second mortgage, 8 both second mortgage and home equity loan) Median monthly owner costs for units with a mortgage: $1,415 Median monthly owner costs for units without a mortgage: $683
Residents with income below the poverty level in 2022:
This zip code:
16.9%
Whole state:
11.9%
Residents with income below 50% of the poverty level in 2022:
This zip code:
0.9%
Whole state:
5.7%
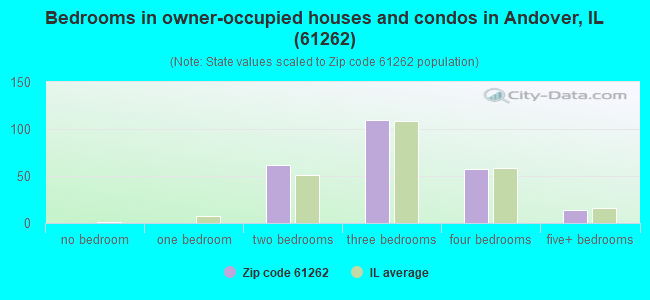
Median number of rooms in houses and condos:
Here:
6.6
State:
6.4
Median number of rooms in apartments:
Here:
7.5
State:
4.1
Notable locations in this zip code not listed on our city pages
Churches in zip code 61262 include: Andover United Methodist Church (A), Augusiana Lutheran Church (B), Jenny Lind Chapel (C). Display/hide their locations on the map
Size of family households: 141 2-persons, 33 3-persons, 73 4-persons, 3 5-persons
Size of nonfamily households: 25 1-person, 7 2-persons
135 married couples with children.
22 single-parent households (11 men, 11 women).
98.9% of residents of 61262 zip code speak English at home.
1.1% of residents speak Spanish at home (100% very well).
Foreign born population: 0 (0.0%)
:
0.0%
Whole state:
14.4%
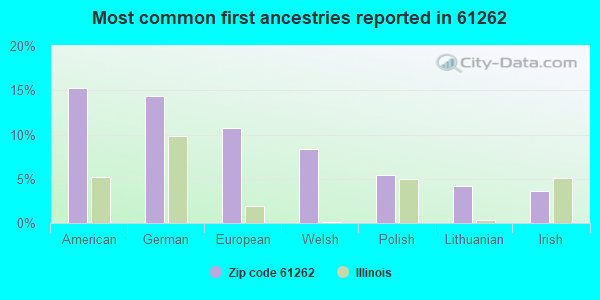
15%American
14%German
11%European
8%Welsh
5%Polish
4%Lithuanian
4%Irish
Year of entry for the foreign-born population
02010 or later
02000 to 2009
91990 to 1999
0Before 1990
Facilities with environmental interests located in this zip code:
DARLING NATIONAL LLC (MCKILLUP ST in LYNN CENTER, IL)
STATE MASTER (Illinois EPA Project) - AIR PROGRAM AIR MINOR (AIRS/AFS) CRITERIA AND HAZARDOUS AIR POLLUTANT INVENTORY (Inventory of air pollution sources) Business SIC classification: DOG AND CAT FOOD; PREPARED FEEDS AND FEED INGREDIENTS FOR ANIMALS AND FOWLS, EXCEPT DOGS AND CATS Alternative names: NATIONAL BY-PRODUCT, INC.
ILL STATE HIGHWAY MAINTENANCE YARD (WEST OF FAI 74 ON ILRT 81 in LYNN CENTER, IL)
STATE MASTER (Illinois EPA Project) - AIR PROGRAM AIR MINOR (AIRS/AFS) Business SIC classification: PETROLEUM BULK STATIONS AND TERMINALS
GRAINSTORE ELEVATORS (100 OLD MILL ROAD in LYNN, IL)
AIR MINOR (AIRS/AFS) CRITERIA AND HAZARDOUS AIR POLLUTANT INVENTORY (Inventory of air pollution sources) Business SIC classification: GRAIN AND FIELD BEANS Alternative names: GRAINSTORE ELEVATOR OPHIEM ELEVATOR
ARENDS IMPLEMENT (HWY 81 in LYNN CENTER, IL)
Small Quantity Generators, between 100 kg and 1000 kg of hazardous waste/month (Resource Conservation and Recovery Act (tracking hazardous waste)) - notification Organizations: ARENDS INC (CONTACT/OWNER)
ILDOT BRG 037 001 AND 037 0012 (I 74 OVER CAMP CREEK in LYNN CENTER, IL)
Conditionally Exempt Small Quantity Generators, less than 100 kg/month of hazardous waste (Resource Conservation and Recovery Act (tracking hazardous waste)) - notification
ILDOT DIV OF HIGHWAYS (FOURTH MI W OF FAI RTE 74 ON S in LYNN CENTER, IL)
Conditionally Exempt Small Quantity Generators, less than 100 kg/month of hazardous waste (Resource Conservation and Recovery Act (tracking hazardous waste)) - notification
LYNN CENTER IMPLEMENT (407 SOUTH ST in LYNN CENTER, IL)
Small Quantity Generators, between 100 kg and 1000 kg of hazardous waste/month (Resource Conservation and Recovery Act (tracking hazardous waste)) - notification Organizations: DOY DAVID (CONTACT/OWNER)
Housing units lacking complete kitchen facilities: 5.2%
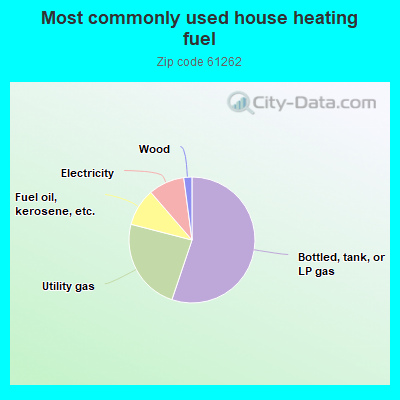
55.5%Bottled, tank, or LP gas
24.0%Utility gas
9.7%Fuel oil, kerosene, etc.
9.3%Electricity
2.1%Wood
Population in 1990: 1,694.
Place of birth for U.S.-born residents:
This state: 480
Midwest: 90
South: 117
West: 21
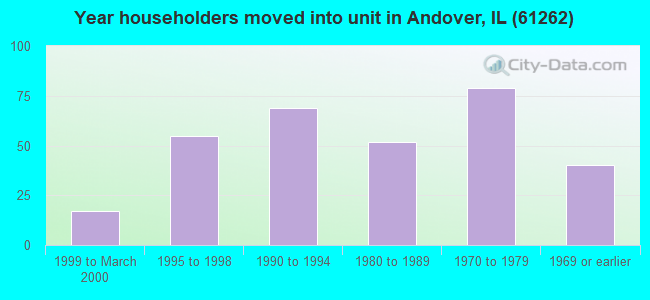
77% of the 61262 zip code residents lived in the same house 5 years ago. Out of people who lived in different houses, 67% lived in this county.
93% of the 61262 zip code residents lived in the same house 1 year ago. Out of people who lived in different houses, 47% moved from this county. Out of people who lived in different houses, 37% moved from different county within same state. Out of people who lived in different houses, 13% moved from different state.
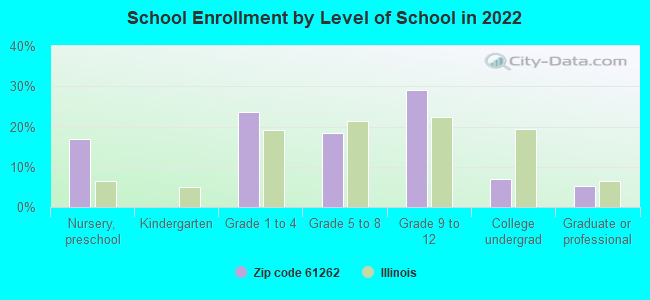
Private vs. public school enrollment:
Students in private schools in grades 1 to 8 (elementary and middle school):
Here:
0.0%
Illinois:
13.3%
Students in private schools in grades 9 to 12 (high school):
Here:
0.0%
Illinois:
9.9%
Students in private undergraduate colleges:
Here:
0.0%
Illinois:
27.4%
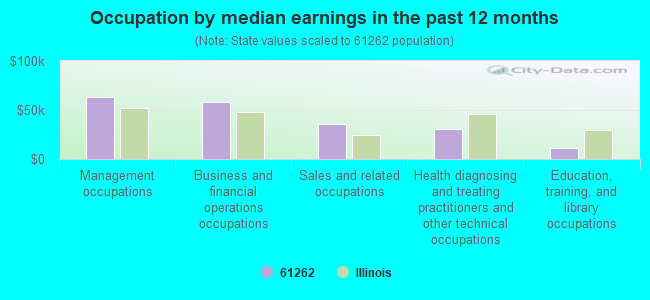
Occupation by median earnings in the past 12 months ($)
63,599Management occupations
58,568Business and financial operations occupations
35,554Sales and related occupations
30,413Health diagnosing and treating practitioners and other technical occupations
11,020Education, training, and library occupations
Top industries in this zip code by the number of employees in 2005:
Construction: Drywall and Insulation Contractors (1-4 employees: 1 establishment)
Other Services (except Public Administration): Commercial and Industrial Machinery and Equipment (except Automotive and Electronic) Repair and Maintenance (1-4: 1)
Construction: Plumbing, Heating, and Air-Conditioning Contractors (1-4: 1)
Construction: Power and Communication Line and Related Structures Construction (1-4: 1)
Other Services (except Public Administration): Religious Organizations (1-4: 1)
Fatal accident statistics in 2013:
Fatal accident count: 1
Vehicles involved in fatal accidents: 1
Fatal accidents caused by drunken drivers: 1
Fatalities: 1
Persons involved in fatal accidents: 1
Pedestrians involved in fatal accidents: 0
Fatal accident statistics in 2011:
Fatal accident count: 1
Vehicles involved in fatal accidents: 2
Fatal accidents caused by drunken drivers: 0
Fatalities: 1
Persons involved in fatal accidents: 2
Pedestrians involved in fatal accidents: 0
Home Mortgage Disclosure Act Aggregated Statistics For Year 2009 (Based on 2 partial tracts)
A) FHA, FSA/RHS & VA Home Purchase Loans
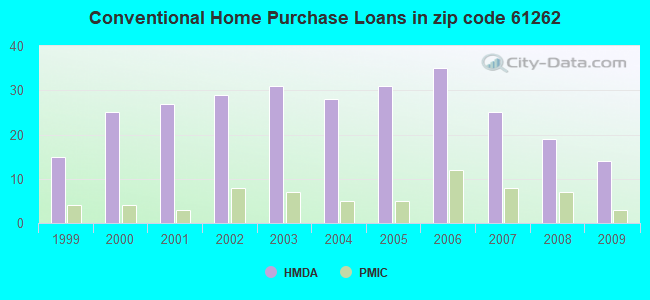
B) Conventional Home Purchase Loans
C) Refinancings
D) Home Improvement Loans
F) Non-occupant Loans on < 5 Family Dwellings (A B C & D)
Number
Average Value
Number
Average Value
Number
Average Value
Number
Average Value
Number
Average Value
LOANS ORIGINATED
11
$109,003
14
$115,501
82
$134,514
13
$55,325
2
$76,535
APPLICATIONS APPROVED, NOT ACCEPTED
0
$0
3
$154,540
10
$130,647
0
$0
0
$0
APPLICATIONS DENIED
0
$0
1
$129,520
15
$139,265
1
$21,590
0
$0
APPLICATIONS WITHDRAWN
1
$130,990
1
$238,920
7
$131,621
0
$0
0
$0
FILES CLOSED FOR INCOMPLETENESS
0
$0
0
$0
2
$178,335
0
$0
0
$0
Aggregated Statistics For Year 2008 (Based on 2 partial tracts)
A) FHA, FSA/RHS & VA Home Purchase Loans
B) Conventional Home Purchase Loans
C) Refinancings
D) Home Improvement Loans
F) Non-occupant Loans on < 5 Family Dwellings (A B C & D)
Number
Average Value
Number
Average Value
Number
Average Value
Number
Average Value
Number
Average Value
LOANS ORIGINATED
8
$133,014
19
$147,542
40
$116,947
8
$69,420
2
$101,310
APPLICATIONS APPROVED, NOT ACCEPTED
1
$183,980
1
$186,920
7
$145,989
1
$230,090
1
$113,820
APPLICATIONS DENIED
1
$148,650
1
$141,290
15
$124,678
6
$57,318
0
$0
APPLICATIONS WITHDRAWN
0
$0
1
$40,230
5
$135,700
0
$0
0
$0
FILES CLOSED FOR INCOMPLETENESS
0
$0
0
$0
1
$65,250
0
$0
0
$0
Aggregated Statistics For Year 2007 (Based on 2 partial tracts)
A) FHA, FSA/RHS & VA Home Purchase Loans
B) Conventional Home Purchase Loans
C) Refinancings
D) Home Improvement Loans
F) Non-occupant Loans on < 5 Family Dwellings (A B C & D)
Number
Average Value
Number
Average Value
Number
Average Value
Number
Average Value
Number
Average Value
LOANS ORIGINATED
5
$126,476
25
$132,619
30
$103,140
13
$46,116
2
$110,385
APPLICATIONS APPROVED, NOT ACCEPTED
0
$0
7
$102,816
5
$116,272
1
$49,060
0
$0
APPLICATIONS DENIED
1
$204,580
2
$158,710
20
$115,389
3
$73,100
0
$0
APPLICATIONS WITHDRAWN
1
$138,350
1
$171,710
7
$125,804
3
$144,890
0
$0
FILES CLOSED FOR INCOMPLETENESS
0
$0
0
$0
1
$134,920
0
$0
0
$0
Aggregated Statistics For Year 2006 (Based on 2 partial tracts)
A) FHA, FSA/RHS & VA Home Purchase Loans
B) Conventional Home Purchase Loans
C) Refinancings
D) Home Improvement Loans
F) Non-occupant Loans on < 5 Family Dwellings (A B C & D)
Number
Average Value
Number
Average Value
Number
Average Value
Number
Average Value
Number
Average Value
LOANS ORIGINATED
3
$141,130
35
$117,618
38
$108,293
12
$43,459
2
$109,160
APPLICATIONS APPROVED, NOT ACCEPTED
0
$0
2
$182,750
7
$102,816
1
$14,720
0
$0
APPLICATIONS DENIED
0
$0
2
$103,025
27
$110,076
2
$28,210
0
$0
APPLICATIONS WITHDRAWN
0
$0
4
$169,012
11
$132,685
0
$0
0
$0
FILES CLOSED FOR INCOMPLETENESS
0
$0
0
$0
2
$156,990
0
$0
0
$0
Aggregated Statistics For Year 2005 (Based on 2 partial tracts)
A) FHA, FSA/RHS & VA Home Purchase Loans
B) Conventional Home Purchase Loans
C) Refinancings
D) Home Improvement Loans
F) Non-occupant Loans on < 5 Family Dwellings (A B C & D)
Number
Average Value
Number
Average Value
Number
Average Value
Number
Average Value
Number
Average Value
LOANS ORIGINATED
2
$119,460
31
$103,058
43
$119,147
15
$30,352
1
$116,760
APPLICATIONS APPROVED, NOT ACCEPTED
0
$0
1
$177,600
11
$79,255
0
$0
0
$0
APPLICATIONS DENIED
0
$0
4
$89,535
16
$135,774
5
$44,546
0
$0
APPLICATIONS WITHDRAWN
0
$0
5
$183,190
16
$138,319
4
$64,022
0
$0
FILES CLOSED FOR INCOMPLETENESS
0
$0
0
$0
0
$0
0
$0
0
$0
Aggregated Statistics For Year 2004 (Based on 2 partial tracts)
A) FHA, FSA/RHS & VA Home Purchase Loans
B) Conventional Home Purchase Loans
C) Refinancings
D) Home Improvement Loans
F) Non-occupant Loans on < 5 Family Dwellings (A B C & D)
G) Loans On Manufactured Home Dwelling (A B C & D)
Number
Average Value
Number
Average Value
Number
Average Value
Number
Average Value
Number
Average Value
Number
Average Value
LOANS ORIGINATED
4
$98,855
28
$129,501
41
$125,474
13
$45,060
4
$75,920
0
$0
APPLICATIONS APPROVED, NOT ACCEPTED
0
$0
1
$136,390
6
$82,667
1
$35,320
0
$0
0
$0
APPLICATIONS DENIED
0
$0
8
$65,434
24
$118,173
5
$48,374
1
$64,270
1
$26,980
APPLICATIONS WITHDRAWN
0
$0
1
$159,450
10
$109,796
2
$52,250
0
$0
0
$0
FILES CLOSED FOR INCOMPLETENESS
0
$0
1
$80,460
2
$103,270
0
$0
0
$0
0
$0
Aggregated Statistics For Year 2003 (Based on 2 partial tracts)
A) FHA, FSA/RHS & VA Home Purchase Loans
B) Conventional Home Purchase Loans
C) Refinancings
D) Home Improvement Loans
F) Non-occupant Loans on < 5 Family Dwellings (A B C & D)
Number
Average Value
Number
Average Value
Number
Average Value
Number
Average Value
Number
Average Value
LOANS ORIGINATED
4
$107,320
31
$111,588
139
$102,617
14
$27,789
5
$81,734
APPLICATIONS APPROVED, NOT ACCEPTED
0
$0
2
$105,970
10
$99,101
1
$18,640
0
$0
APPLICATIONS DENIED
0
$0
6
$102,698
26
$86,478
3
$24,530
0
$0
APPLICATIONS WITHDRAWN
0
$0
5
$106,068
22
$105,100
1
$6,870
0
$0
FILES CLOSED FOR INCOMPLETENESS
0
$0
1
$161,410
2
$80,950
0
$0
0
$0
Aggregated Statistics For Year 2002 (Based on 2 partial tracts)
A) FHA, FSA/RHS & VA Home Purchase Loans
B) Conventional Home Purchase Loans
C) Refinancings
D) Home Improvement Loans
F) Non-occupant Loans on < 5 Family Dwellings (A B C & D)
Number
Average Value
Number
Average Value
Number
Average Value
Number
Average Value
Number
Average Value
LOANS ORIGINATED
3
$103,190
29
$99,406
97
$101,918
15
$34,375
4
$102,290
APPLICATIONS APPROVED, NOT ACCEPTED
0
$0
2
$104,745
8
$84,199
0
$0
1
$67,210
APPLICATIONS DENIED
0
$0
1
$12,270
23
$84,682
2
$7,360
0
$0
APPLICATIONS WITHDRAWN
0
$0
3
$68,847
13
$120,197
0
$0
0
$0
FILES CLOSED FOR INCOMPLETENESS
0
$0
0
$0
1
$115,290
0
$0
0
$0
Aggregated Statistics For Year 2001 (Based on 2 partial tracts)
A) FHA, FSA/RHS & VA Home Purchase Loans
B) Conventional Home Purchase Loans
C) Refinancings
D) Home Improvement Loans
F) Non-occupant Loans on < 5 Family Dwellings (A B C & D)
Number
Average Value
Number
Average Value
Number
Average Value
Number
Average Value
Number
Average Value
LOANS ORIGINATED
5
$93,312
27
$106,333
73
$102,744
15
$26,656
2
$46,360
APPLICATIONS APPROVED, NOT ACCEPTED
1
$99,100
0
$0
5
$63,974
2
$29,680
0
$0
APPLICATIONS DENIED
0
$0
1
$91,740
19
$73,642
3
$16,517
0
$0
APPLICATIONS WITHDRAWN
0
$0
2
$154,540
9
$70,429
0
$0
0
$0
FILES CLOSED FOR INCOMPLETENESS
0
$0
0
$0
2
$86,345
0
$0
0
$0
Aggregated Statistics For Year 2000 (Based on 2 partial tracts)
A) FHA, FSA/RHS & VA Home Purchase Loans
B) Conventional Home Purchase Loans
C) Refinancings
D) Home Improvement Loans
F) Non-occupant Loans on < 5 Family Dwellings (A B C & D)
Number
Average Value
Number
Average Value
Number
Average Value
Number
Average Value
Number
Average Value
LOANS ORIGINATED
4
$96,892
25
$87,660
26
$69,722
17
$16,248
3
$71,627
APPLICATIONS APPROVED, NOT ACCEPTED
0
$0
3
$129,847
3
$43,337
3
$38,267
0
$0
APPLICATIONS DENIED
0
$0
2
$91,495
12
$59,976
4
$14,105
0
$0
APPLICATIONS WITHDRAWN
0
$0
3
$90,270
6
$65,168
1
$22,080
0
$0
FILES CLOSED FOR INCOMPLETENESS
0
$0
0
$0
0
$0
0
$0
0
$0
Aggregated Statistics For Year 1999 (Based on 2 partial tracts)
A) FHA, FSA/RHS & VA Home Purchase Loans
B) Conventional Home Purchase Loans
C) Refinancings
D) Home Improvement Loans
F) Non-occupant Loans on < 5 Family Dwellings (A B C & D)
Detailed PMIC statistics for the following Tracts:0302.01
2003 - 2018 National Fire Incident Reporting System (NFIRS) incidents
Based on the data from the years 2003 - 2018 the average number of fire incidents per year is 6. The highest number of fire incidents - 18 took place in 2010, and the least - 1 in 2015. The data has a growing trend.
When looking into fire subcategories, the most reports belonged to: Outside Fires (34.6%), and Structure Fires (29.8%).
Fire incident types reported to NFIRS in Zip Code 61262


 Nearest zip codes: 61468, 61413, 61273, 61274, 61490, 61465.
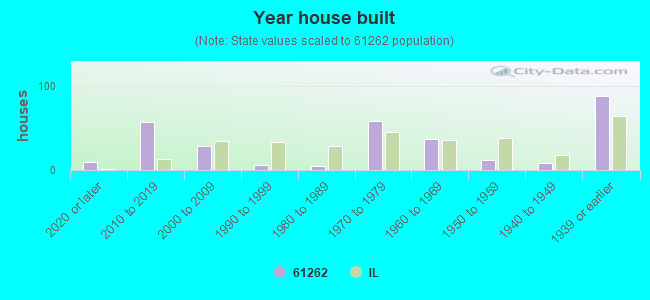


 Based on the data from the years 2003 - 2018 the average number of fire incidents per year is 6. The highest number of fire incidents - 18 took place in 2010, and the least - 1 in 2015. The data has a growing trend.
 When looking into fire subcategories, the most reports belonged to: Outside Fires (34.6%), and Structure Fires (29.8%).