Estimated zip code population in 2022: 1,338 Zip code population in 2010: 1,504 Zip code population in 2000: 1,464
Houses and condos: 559 Renter-occupied apartments: 78
% of renters here:
15%
State:
33%
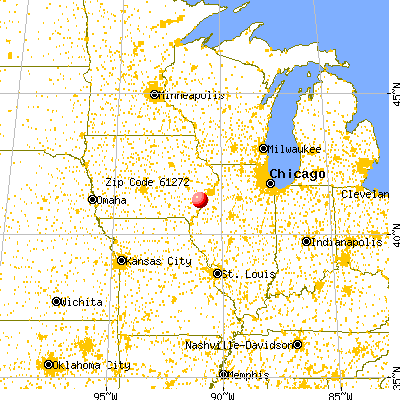
March 2022 cost of living index in zip code 61272: 83.7 (less than average, U.S. average is 100)
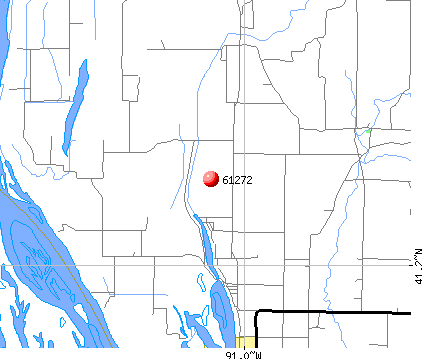
Land area: 90.1 sq. mi. Water area: 5.4 sq. mi.
Population density: 15 people per square mile
(very low).
OSM Map
General Map
Google Map
MSN Map
OSM Map
General Map
Google Map
MSN Map
OSM Map
General Map
Google Map
MSN Map
OSM Map
General Map
Google Map
MSN Map
Please wait while loading the map...
Real estate property taxes paid for housing units in 2022:
This zip code:
1.5% ($1,892)
Illinois:
2.0% ($4,912)
Median real estate property taxes paid for housing units with mortgages in 2022: $1,854 (1.3%) Median real estate property taxes paid for housing units with no mortgage in 2022: $2,041 (2.4%)
Averages for the 2020 tax year for zip code 61272, filed in 2021:
Average Adjusted Gross Income (AGI) in 2020: $53,021 (Individual Income Tax Returns)
Here:
$53,021
State:
$82,626
Salary/wage: $47,315 (reported on 76.5% of returns)
Here:
$47,315
State:
$66,640
(% of AGI for various income ranges: 841.9% for AGIs below $25k, 2925.4% for AGIs $25k-50k, 5602.2% for AGIs $50k-75k, 8320.0% for AGIs $75k-100k, 18840.0% for AGIs $100k-200k)
Taxable interest for individuals: $770 (reported on 39.7% of returns)
This zip code:
$770
Illinois:
$2,376
(% of AGI for various income ranges: 31.9% for AGIs below $25k, 16.9% for AGIs $25k-50k, 50.0% for AGIs $50k-75k, 58.3% for AGIs $75k-100k, 110.0% for AGIs $100k-200k)
Ordinary dividends: $1,367 (reported on 13.2% of returns)
Here:
$1,367
State:
$9,061
(% of AGI for various income ranges: 37.7% for AGIs $25k-50k, 123.3% for AGIs $75k-100k)
Net capital gain/loss in AGI: +$8,229 (reported on 10.3% of returns)
Here:
+$8,229
State:
+$31,684
(% of AGI for various income ranges: 10.0% for AGIs below $25k, 83.3% for AGIs $50k-75k, 970.0% for AGIs $100k-200k)
Profit/loss from business: +$6,933 (reported on 8.8% of returns)
Here:
+$6,933
State:
+$12,175
(% of AGI for various income ranges: 257.7% for AGIs $25k-50k, 135.0% for AGIs $75k-100k)
Taxable individual retirement arrangement distribution: $16,543 (reported on 10.3% of returns)
61272:
$16,543
Illinois:
$21,613
(% of AGI for various income ranges: 304.6% for AGIs $25k-50k, 1270.0% for AGIs $75k-100k)
Earned income credit: $1,944 (reported on 13.2% of returns)
Here:
$1,944
State:
$2,311
(% of AGI for various income ranges: 68.1% for AGIs below $25k, 50.8% for AGIs $25k-50k)
Percentage of individuals using paid preparers for their 2020 taxes: 94.1%
Here:
94%
State:
93%
(% for various income ranges: 95.5% for AGIs below $25k, 93.3% for AGIs $25k-50k, 100.0% for AGIs $50k-75k, 88.9% for AGIs $75k-100k, 90.0% for AGIs $100k-200k)
Averages for the 2012 tax year for zip code 61272, filed in 2013:
Average Adjusted Gross Income (AGI) in 2012: $48,725 (Individual Income Tax Returns)
Here:
$48,725
State:
$68,058
Salary/wage: $37,374 (reported on 78.3% of returns)
Here:
$37,374
State:
$55,396
(% of AGI for various income ranges: 57.0% for AGIs below $25k, 75.0% for AGIs $25k-50k, 71.8% for AGIs $50k-75k, 66.3% for AGIs $75k-100k, 38.3% for AGIs $100k-200k)
Taxable interest for individuals: $1,182 (reported on 40.6% of returns)
This zip code:
$1,182
Illinois:
$1,969
(% of AGI for various income ranges: 3.0% for AGIs below $25k, 0.8% for AGIs $25k-50k, 0.8% for AGIs $50k-75k, 0.9% for AGIs $75k-100k, 0.6% for AGIs $100k-200k)
Ordinary dividends: $1,008 (reported on 17.4% of returns)
Here:
$1,008
State:
$7,786
(% of AGI for various income ranges: 1.1% for AGIs below $25k, 0.3% for AGIs $25k-50k, 0.8% for AGIs $50k-75k, 0.1% for AGIs $100k-200k)
Net capital gain/loss in AGI: +$9,025 (reported on 11.6% of returns)
Here:
+$9,025
State:
+$22,183
(% of AGI for various income ranges: 1.2% for AGIs below $25k, 0.2% for AGIs $50k-75k, 6.6% for AGIs $100k-200k)
Profit/loss from business: +$4,586 (reported on 10.1% of returns)
Here:
+$4,586
State:
+$12,903
Taxable individual retirement arrangement distribution: $9,886 (reported on 10.1% of returns)
61272:
$9,886
Illinois:
$17,929
(% of AGI for various income ranges: 2.4% for AGIs below $25k, 3.1% for AGIs $25k-50k, 6.2% for AGIs $75k-100k)
Total itemized deductions: $21,770 (24% of AGI, reported on 14.5% of returns)
Here:
$21,770
State:
$26,433
Here:
24.0% of AGI
State:
19.2% of AGI
(% of AGI for various income ranges: 12.5% for AGIs below $25k, 5.8% for AGIs $50k-75k, 5.0% for AGIs $75k-100k, 10.5% for AGIs $100k-200k)
Charity contributions: $3,017 (reported on 8.7% of returns)
Here:
$3,017
State:
$4,525
Taxes paid: $6,327 (reported on 15.9% of returns)
61272:
$6,327
State:
$11,968
(% of AGI for various income ranges: 3.0% for AGIs below $25k, 1.5% for AGIs $50k-75k, 2.0% for AGIs $75k-100k, 3.7% for AGIs $100k-200k)
Earned income credit: $2,191 (reported on 15.9% of returns)
Here:
$2,191
State:
$2,349
(% of AGI for various income ranges: 5.1% for AGIs below $25k, 1.2% for AGIs $25k-50k)
Percentage of individuals using paid preparers for their 2012 taxes: 71.0%
Here:
71%
State:
57%
(% for various income ranges: 66.7% for AGIs below $25k, 73.7% for AGIs $25k-50k, 66.7% for AGIs $50k-75k, 75.0% for AGIs $75k-100k, 83.3% for AGIs $100k-200k)
Averages for the 2004 tax year for zip code 61272, filed in 2005:
Average Adjusted Gross Income (AGI) in 2004: $34,537 (Individual Income Tax Returns)
Here:
$34,537
State:
$54,625
Salary/wage: $30,888 (reported on 80.8% of returns)
Here:
$30,888
State:
$46,811
(% of AGI for various income ranges: 102.3% for AGIs below $10k, 69.5% for AGIs $10k-25k, 73.2% for AGIs $25k-50k, 76.8% for AGIs $50k-75k, 75.9% for AGIs $75k-100k, 56.2% for AGIs over 100k)
Taxable interest for individuals: $1,383 (reported on 49.7% of returns)
This zip code:
$1,383
Illinois:
$2,101
(% of AGI for various income ranges: 7.9% for AGIs below $10k, 3.6% for AGIs $10k-25k, 1.3% for AGIs $25k-50k, 2.7% for AGIs $50k-75k, 0.7% for AGIs $75k-100k, 1.4% for AGIs over 100k)
Taxable dividends: $672 (reported on 17.6% of returns)
Here:
$672
State:
$4,306
(% of AGI for various income ranges: 0.6% for AGIs below $10k, 0.8% for AGIs $10k-25k, 0.4% for AGIs $25k-50k, 0.2% for AGIs $50k-75k, 0.2% for AGIs $75k-100k, 0.2% for AGIs over 100k)
Net capital gain/loss: +$4,732 (reported on 12.7% of returns)
Here:
+$4,732
State:
+$17,321
(% of AGI for various income ranges: -1.3% for AGIs below $10k, 1.5% for AGIs $10k-25k, 1.1% for AGIs $25k-50k, 0.1% for AGIs $50k-75k, 7.8% for AGIs $75k-100k)
Profit/loss from business: +$3,506 (reported on 10.9% of returns)
Here:
+$3,506
State:
+$11,771
(% of AGI for various income ranges: 10.5% for AGIs below $10k, 0.0% for AGIs $10k-25k, 2.3% for AGIs $25k-50k, 0.8% for AGIs $50k-75k, -0.2% for AGIs $75k-100k)
Profit/loss from farming: +$34 (reported on 7.6% of returns)
Here:
+$34
State:
+$2,327
(% of AGI for various income ranges: -17.9% for AGIs below $10k, 1.9% for AGIs $25k-50k, -1.6% for AGIs $50k-75k, 1.0% for AGIs $75k-100k)
Total itemized deductions: $13,951 (22% of AGI, reported on 16.1% of returns)
Here:
$13,951
State:
$20,239
Here:
22.2% of AGI
State:
19.5% of AGI
(% of AGI for various income ranges: 7.0% for AGIs $10k-25k, 4.3% for AGIs $25k-50k, 10.2% for AGIs $50k-75k, 5.2% for AGIs $75k-100k, 7.1% for AGIs over 100k)
Charity contributions deductions: $1,338 (2% of AGI, reported on 9.7% of returns)
Here:
$1,338
State:
$3,719
Here:
2.0% of AGI
State:
3.4% of AGI
(% of AGI for various income ranges: 0.5% for AGIs $10k-25k, 0.3% for AGIs $25k-50k, 0.3% for AGIs $50k-75k, 0.1% for AGIs $75k-100k, 0.9% for AGIs over 100k)
Total tax: $4,162 (reported on 76.8% of returns)
61272:
$4,162
State:
$9,882
(% of AGI for various income ranges: 3.6% for AGIs below $10k, 4.4% for AGIs $10k-25k, 7.2% for AGIs $25k-50k, 8.8% for AGIs $50k-75k, 12.2% for AGIs $75k-100k, 16.9% for AGIs over 100k)
Earned income credit: $1,639 (reported on 14.2% of returns)
Here:
$1,639
State:
$1,788
Percentage of individuals using paid preparers for their 2004 taxes: 72.8%
Here:
73%
State:
61%
(% for various income ranges: 63.4% for AGIs below $10k, 69.8% for AGIs $10k-25k, 74.9% for AGIs $25k-50k, 78.0% for AGIs $50k-75k, 91.5% for AGIs $75k-100k, 81.8% for AGIs over 100k)
Household received Food Stamps/SNAP in the past 12 months: 90 Household did not receive Food Stamps/SNAP in the past 12 months: 421
Women who had a birth in the past 12 months: 7 (0 now married, 7 unmarried) Women who did not have a birth in the past 12 months: 287 (156 now married, 129 unmarried)
Housing units in zip code 61272 with a mortgage: 239 (7 second mortgage, 4 both second mortgage and home equity loan) Median monthly owner costs for units with a mortgage: $1,227 Median monthly owner costs for units without a mortgage: $450
Residents with income below the poverty level in 2022:
This zip code:
7.8%
Whole state:
11.9%
Residents with income below 50% of the poverty level in 2022:
This zip code:
5.7%
Whole state:
5.7%
Median number of rooms in houses and condos:
Here:
6.0
State:
6.4
Median number of rooms in apartments:
Here:
4.8
State:
4.1
Notable locations in this zip code not listed on our city pages
Notable locations in zip code 61272: Crosses Corner Access Area (A), Bay Island Pumping Station (B), New Boston Volunteer Ambulance Service (C), New Boston - Eliza Fire Protection District Station 2 (D), New Boston - Eliza Fire Protection District Station 1 (E). Display/hide their locations on the map
Cemeteries: Mannon Cemetery (1), Miller Cemetery (2), Shields Cemetery (3), Eliza Creek Cemetery (4), New Boston Cemetery (5). Display/hide their locations on the map
Streams, rivers, and creeks: Coleman Slough (A), Cleveland Slough (B), Eliza Creek (C), Bogus Chute (D), Blanchard Chute (E), Irwin Branch (F), Dolan Creek (G), Keating Creek (H), Winters Creek (I). Display/hide their locations on the map
Size of family households: 173 2-persons, 62 3-persons, 40 4-persons, 59 5-persons, 8 6-persons, 20 7-or-more-persons
Size of nonfamily households: 122 1-person, 18 2-persons
335 married couples with children.
52 single-parent households (8 men, 44 women).
98.8% of residents of 61272 zip code speak English at home.
0.2% of residents speak Asian or Pacific Island language at home (100% well).
0.2% of residents speak other language at home (100% very well).
Foreign born population: 5 (0.4%) (0.0% of them are naturalized citizens)
:
0.4%
Whole state:
14.4%
50%Bhutan
33%Singapore
34%German
18%American
16%English
13%Irish
2%Norwegian
2%Scotch-Irish
1%Swedish
Year of entry for the foreign-born population
32010 or later
02000 to 2009
21990 to 1999
0Before 1990
Facilities with environmental interests located in this zip code:
NEW BOSTON STP (CEMETARY ROAD in NEW BOSTON, IL)
STATE MASTER (Illinois EPA Project) - National Pollutant Discharge Elimination System Permit National Pollutant Discharge Elimination System NON-MAJOR (Tracking pollutant discharge elimination systems) - permit Business SIC classification: SEWERAGE SYSTEMS Alternative names: NEW BOSTON STP, CITY, NEW BOSTON STP, CITY OF
Housing units lacking complete plumbing facilities: 1.0% Housing units lacking complete kitchen facilities: 4.0%
49.0%Utility gas
35.0%Bottled, tank, or LP gas
13.4%Electricity
1.4%Wood
1.4%Other fuel
Population in 1990: 1,663.
Place of birth for U.S.-born residents:
This state: 547
Northeast: 15
Midwest: 522
South: 219
West: 26
75% of the 61272 zip code residents lived in the same house 5 years ago. Out of people who lived in different houses, 62% lived in this county. Out of people who lived in different counties, 50% lived in Illinois.
99% of the 61272 zip code residents lived in the same house 1 year ago. Out of people who lived in different houses, 17% moved from this county. Out of people who lived in different houses, 83% moved from different state.
Private vs. public school enrollment:
Students in private schools in grades 1 to 8 (elementary and middle school): 76
Here:
32.9%
Illinois:
13.3%
Students in private schools in grades 9 to 12 (high school): 22
Here:
36.3%
Illinois:
9.9%
Students in private undergraduate colleges:
Here:
0.0%
Illinois:
27.4%
Occupation by median earnings in the past 12 months ($)
95,667Health diagnosing and treating practitioners and other technical occupations
92,105Transportation occupations
59,937Material moving occupations
51,994Construction and extraction occupations
49,192Office and administrative support occupations
46,388Production occupations
Top industries in this zip code by the number of employees in 2005:
Wholesale Trade: Grain and Field Bean Merchant Wholesalers (5-9 employees: 1 establishment)
Construction: Painting and Wall Covering Contractors (5-9: 1)
Construction: Site Preparation Contractors (5-9: 1)
Construction: Poured Concrete Foundation and Structure Contractors (1-4: 1)
Construction: New Single-Family Housing Construction (except Operative Builders) (1-4: 1)
Fatal accident statistics in 2011:
Fatal accident count: 1
Vehicles involved in fatal accidents: 1
Fatal accidents caused by drunken drivers: 1
Fatalities: 1
Persons involved in fatal accidents: 1
Pedestrians involved in fatal accidents: 0
Most common first names in zip code 61272 among deceased individuals
Name
Count
Lived (average)
George
14
74.9 years
John
12
79.3 years
Robert
10
74.2 years
Harold
9
72.5 years
Charles
9
77.7 years
James
9
74.0 years
William
9
76.8 years
Mary
8
77.3 years
Earl
7
77.1 years
Fred
7
79.5 years
Most common last names in zip code 61272 among deceased individuals
Last name
Count
Lived (average)
Willits
11
81.6 years
Coulter
8
76.7 years
Hays
8
73.1 years
Sloan
8
73.8 years
Long
7
72.6 years
Sedam
7
83.1 years
King
6
74.0 years
Nelson
6
73.5 years
Ferguson
5
73.4 years
Green
5
75.0 years
Discuss New Boston, Illinois (IL) on our hugely popular Illinois forum.


 Nearest zip codes: 61260, 61259, 52749, 61442, 52653, 52752.