Estimated zip code population in 2022: 1,279 Zip code population in 2010: 1,293 Zip code population in 2000: 1,157
Houses and condos: 648 Renter-occupied apartments: 55
% of renters here:
9%
State:
33%
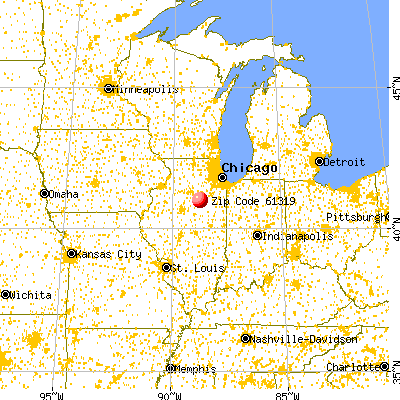
March 2022 cost of living index in zip code 61319: 85.0 (less than average, U.S. average is 100)
Land area: 49.7 sq. mi. Water area: 0.4 sq. mi.
Population density: 26 people per square mile
(very low).
OSM Map
General Map
Google Map
MSN Map
OSM Map
General Map
Google Map
MSN Map
OSM Map
General Map
Google Map
MSN Map
OSM Map
General Map
Google Map
MSN Map
Please wait while loading the map...
Real estate property taxes paid for housing units in 2022:
This zip code:
1.7% ($2,765)
Illinois:
2.0% ($4,912)
Median real estate property taxes paid for housing units with mortgages in 2022: $2,978 (1.7%) Median real estate property taxes paid for housing units with no mortgage in 2022: $2,112 (1.5%)
Business Search- 14 Million verified businesses
Males: 702
(54.9%)
Females: 576
(45.1%)
For population 25 years and over in 61319:
High school or higher: 87.6%
Bachelor's degree or higher: 19.9%
Graduate or professional degree: 3.3%
Unemployed: 0.6%
Mean travel time to work (commute): 29.4 minutes
For population 15 years and over in 61319:
Never married: 19.5%
Now married: 62.3%
Separated: 1.2%
Widowed: 7.2%
Divorced: 9.8%
Zip code 61319 compared to state average:
Median house value below state average.
Unemployed percentage significantly below state average.
Black race population percentage significantly below state average.
Hispanic race population percentage significantly below state average.
Median age significantly above state average.
Foreign-born population percentage significantly below state average.
Renting percentage significantly below state average.
Length of stay since moving in significantly above state average.
Number of college students below state average.
Percentage of population with a bachelor's degree or higher below state average.
Estimated median house/condo value in 2022: $164,787
61319:
$164,787
Illinois:
$251,600
According to our research of Illinois and other state lists, there was 1 registered sex offender living in 61319 zip code as of June 09, 2024. The ratio of all residents to sex offenders in zip code 61319 is 1,111 to 1. The ratio of registered sex offenders to all residents in this zip code is lower than the state average.
Median resident age:
This zip code:
53.1 years
Illinois median age:
39.1 years
Average household size:
This zip code:
2.1 people
Illinois:
2.4 people
Averages for the 2020 tax year for zip code 61319, filed in 2021:
Average Adjusted Gross Income (AGI) in 2020: $69,336 (Individual Income Tax Returns)
Here:
$69,336
State:
$82,626
Salary/wage: $51,878 (reported on 82.1% of returns)
Here:
$51,878
State:
$66,640
(% of AGI for various income ranges: 1131.8% for AGIs below $25k, 3240.9% for AGIs $25k-50k, 5693.8% for AGIs $50k-75k, 7872.5% for AGIs $75k-100k, 16214.3% for AGIs $100k-200k)
Taxable interest for individuals: $832 (reported on 44.6% of returns)
This zip code:
$832
Illinois:
$2,376
(% of AGI for various income ranges: 21.8% for AGIs below $25k, 18.2% for AGIs $25k-50k, 47.5% for AGIs $50k-75k, 25.0% for AGIs $75k-100k, 165.7% for AGIs $100k-200k)
Ordinary dividends: $1,733 (reported on 21.4% of returns)
Here:
$1,733
State:
$9,061
(% of AGI for various income ranges: 30.0% for AGIs below $25k, 58.8% for AGIs $50k-75k, 182.9% for AGIs $100k-200k)
Net capital gain/loss in AGI: +$2,820 (reported on 17.9% of returns)
Here:
+$2,820
State:
+$31,684
(% of AGI for various income ranges: 14.5% for AGIs $25k-50k, 398.6% for AGIs $100k-200k)
Profit/loss from business: +$3,775 (reported on 7.1% of returns)
Here:
+$3,775
State:
+$12,175
(% of AGI for various income ranges: 277.1% for AGIs $100k-200k)
Taxable individual retirement arrangement distribution: $11,412 (reported on 14.3% of returns)
61319:
$11,412
Illinois:
$21,613
(% of AGI for various income ranges: 97.3% for AGIs below $25k, 200.0% for AGIs $25k-50k, 837.1% for AGIs $100k-200k)
Earned income credit: $2,125 (reported on 14.3% of returns)
Here:
$2,125
State:
$2,311
(% of AGI for various income ranges: 95.5% for AGIs below $25k, 59.1% for AGIs $25k-50k)
Percentage of individuals using paid preparers for their 2020 taxes: 98.2%
Here:
98%
State:
93%
(% for various income ranges: 93.3% for AGIs below $25k, 100.0% for AGIs $25k-50k, 100.0% for AGIs $50k-75k, 100.0% for AGIs $75k-100k, 100.0% for AGIs $100k-200k)
Averages for the 2012 tax year for zip code 61319, filed in 2013:
Average Adjusted Gross Income (AGI) in 2012: $56,425 (Individual Income Tax Returns)
Here:
$56,425
State:
$68,058
Salary/wage: $42,102 (reported on 83.3% of returns)
Here:
$42,102
State:
$55,396
(% of AGI for various income ranges: 75.1% for AGIs below $25k, 74.9% for AGIs $25k-50k, 69.0% for AGIs $50k-75k, 74.8% for AGIs $75k-100k, 45.2% for AGIs $100k-200k)
Taxable interest for individuals: $888 (reported on 43.3% of returns)
This zip code:
$888
Illinois:
$1,969
(% of AGI for various income ranges: 1.1% for AGIs below $25k, 0.5% for AGIs $25k-50k, 0.4% for AGIs $50k-75k, 0.8% for AGIs $75k-100k, 0.7% for AGIs $100k-200k)
Ordinary dividends: $3,036 (reported on 18.3% of returns)
Here:
$3,036
State:
$7,786
(% of AGI for various income ranges: 0.3% for AGIs below $25k, 0.2% for AGIs $25k-50k, 0.3% for AGIs $50k-75k, 0.4% for AGIs $75k-100k, 2.0% for AGIs $100k-200k)
Net capital gain/loss in AGI: +$622 (reported on 15.0% of returns)
Here:
+$622
State:
+$22,183
(% of AGI for various income ranges: 0.7% for AGIs $100k-200k)
Profit/loss from business: +$4,500 (reported on 10.0% of returns)
Here:
+$4,500
State:
+$12,903
Taxable individual retirement arrangement distribution: $7,350 (reported on 10.0% of returns)
61319:
$7,350
Illinois:
$17,929
Total itemized deductions: $17,572 (18% of AGI, reported on 30.0% of returns)
Here:
$17,572
State:
$26,433
Here:
18.2% of AGI
State:
19.2% of AGI
(% of AGI for various income ranges: 9.2% for AGIs $25k-50k, 10.6% for AGIs $50k-75k, 9.6% for AGIs $75k-100k, 10.2% for AGIs $100k-200k)
Charity contributions: $2,983 (reported on 20.0% of returns)
Here:
$2,983
State:
$4,525
(% of AGI for various income ranges: 1.1% for AGIs below $25k, 1.6% for AGIs $50k-75k, 0.8% for AGIs $75k-100k, 1.3% for AGIs $100k-200k)
Taxes paid: $7,289 (reported on 30.0% of returns)
61319:
$7,289
State:
$11,968
(% of AGI for various income ranges: 2.2% for AGIs $25k-50k, 4.1% for AGIs $50k-75k, 4.7% for AGIs $75k-100k, 4.6% for AGIs $100k-200k)
Earned income credit: $1,933 (reported on 15.0% of returns)
Here:
$1,933
State:
$2,349
(% of AGI for various income ranges: 4.8% for AGIs below $25k, 1.3% for AGIs $25k-50k)
Percentage of individuals using paid preparers for their 2012 taxes: 61.7%
Here:
62%
State:
57%
(% for various income ranges: 55.0% for AGIs below $25k, 57.1% for AGIs $25k-50k, 72.7% for AGIs $50k-75k, 62.5% for AGIs $75k-100k, 71.4% for AGIs $100k-200k)
Averages for the 2004 tax year for zip code 61319, filed in 2005:
Average Adjusted Gross Income (AGI) in 2004: $39,142 (Individual Income Tax Returns)
Here:
$39,142
State:
$54,625
Salary/wage: $35,451 (reported on 87.9% of returns)
Here:
$35,451
State:
$46,811
(% of AGI for various income ranges: 98.0% for AGIs below $10k, 72.4% for AGIs $10k-25k, 79.9% for AGIs $25k-50k, 85.0% for AGIs $50k-75k, 83.8% for AGIs $75k-100k, 64.6% for AGIs over 100k)
Taxable interest for individuals: $1,061 (reported on 53.5% of returns)
This zip code:
$1,061
Illinois:
$2,101
(% of AGI for various income ranges: 7.8% for AGIs below $10k, 4.3% for AGIs $10k-25k, 1.5% for AGIs $25k-50k, 1.1% for AGIs $50k-75k, 0.4% for AGIs $75k-100k, 0.6% for AGIs over 100k)
Taxable dividends: $597 (reported on 21.0% of returns)
Here:
$597
State:
$4,306
(% of AGI for various income ranges: 0.7% for AGIs below $10k, 0.5% for AGIs $10k-25k, 0.5% for AGIs $25k-50k, 0.2% for AGIs $50k-75k, 0.5% for AGIs $75k-100k)
Net capital gain/loss: +$811 (reported on 14.7% of returns)
Here:
+$811
State:
+$17,321
(% of AGI for various income ranges: 0.9% for AGIs below $10k, 0.6% for AGIs $10k-25k, -0.0% for AGIs $25k-50k, -0.1% for AGIs $50k-75k, 0.3% for AGIs $75k-100k, 1.5% for AGIs over 100k)
Profit/loss from business: +$2,698 (reported on 10.3% of returns)
Here:
+$2,698
State:
+$11,771
Profit/loss from farming: +$927 (reported on 6.7% of returns)
Here:
+$927
State:
+$2,327
IRA payment deduction: $2,154 (reported on 2.1% of returns)
61319:
$2,154
Illinois:
$3,087
Total itemized deductions: $13,821 (21% of AGI, reported on 22.8% of returns)
Here:
$13,821
State:
$20,239
Here:
20.9% of AGI
State:
19.5% of AGI
(% of AGI for various income ranges: 10.2% for AGIs $10k-25k, 7.0% for AGIs $25k-50k, 7.3% for AGIs $50k-75k, 9.1% for AGIs $75k-100k, 9.8% for AGIs over 100k)
Charity contributions deductions: $2,283 (3% of AGI, reported on 18.4% of returns)
Here:
$2,283
State:
$3,719
Here:
3.4% of AGI
State:
3.4% of AGI
(% of AGI for various income ranges: 1.2% for AGIs $10k-25k, 1.0% for AGIs $25k-50k, 1.0% for AGIs $50k-75k, 1.1% for AGIs $75k-100k, 1.5% for AGIs over 100k)
Total tax: $4,966 (reported on 77.0% of returns)
61319:
$4,966
State:
$9,882
(% of AGI for various income ranges: 2.0% for AGIs below $10k, 3.9% for AGIs $10k-25k, 7.1% for AGIs $25k-50k, 9.3% for AGIs $50k-75k, 11.3% for AGIs $75k-100k, 18.4% for AGIs over 100k)
Earned income credit: $1,574 (reported on 11.1% of returns)
Here:
$1,574
State:
$1,788
Percentage of individuals using paid preparers for their 2004 taxes: 64.9%
Here:
65%
State:
61%
(% for various income ranges: 51.8% for AGIs below $10k, 72.4% for AGIs $10k-25k, 68.3% for AGIs $25k-50k, 59.2% for AGIs $50k-75k, 71.2% for AGIs $75k-100k, 73.9% for AGIs over 100k)
Household received Food Stamps/SNAP in the past 12 months: 67 Household did not receive Food Stamps/SNAP in the past 12 months: 540
Women who had a birth in the past 12 months: 11 (11 now married, 0 unmarried) Women who did not have a birth in the past 12 months: 175 (72 now married, 102 unmarried)
Housing units in zip code 61319 with a mortgage: 355 (11 second mortgage, 12 both second mortgage and home equity loan) Houses without a mortgage: 19
Median monthly owner costs for units with a mortgage: $1,442 Median monthly owner costs for units without a mortgage: $516
Residents with income below the poverty level in 2022:
This zip code:
10.4%
Whole state:
11.9%
Residents with income below 50% of the poverty level in 2022:
This zip code:
5.7%
Whole state:
5.7%
Median number of rooms in houses and condos:
Here:
6.0
State:
6.4
Median number of rooms in apartments:
Here:
6.0
State:
4.1
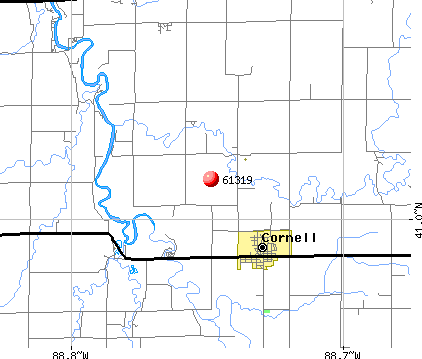
Notable locations in this zip code not listed on our city pages
Notable locations in zip code 61319: Manville Camp (A), Twin Creeks Golf Course (B), Camp Aramoni (C), Cornell Volunteer Fire Department (D). Display/hide their locations on the map
Cemeteries: Bayou Cemetery (1), Calder Cemetery (2), Morris Cemetery (3), Hadley Cemetery (4), Springer Cemetery (5), Cornell Cemetery (6), Phillips Cemetery (7). Display/hide their locations on the map
Streams, rivers, and creeks: Mud Creek (A), Short Point Creek (B), Baker Run (C), Scattering Point Creek (D), Rooks Creek (E), Ida Creek (F), Long Point Creek (G). Display/hide their locations on the map
Size of family households: 311 2-persons, 80 3-persons, 45 4-persons, 26 5-persons, 2 6-persons, 4 7-or-more-persons
Size of nonfamily households: 114 1-person, 24 2-persons
120 married couples with children.
35 single-parent households (11 men, 24 women).
96.0% of residents of 61319 zip code speak English at home.
3.6% of residents speak Spanish at home (93% very well, 7% well).
Foreign born population: 0 (0.0%)
:
0.0%
Whole state:
14.4%
38%German
13%Irish
12%Italian
9%Czech
6%American
4%English
3%Slovak
Year of entry for the foreign-born population
02010 or later
02000 to 2009
01990 to 1999
3Before 1990
Facilities with environmental interests located in this zip code:
GRAYMONT COOPERATIVE ASSN (309 W. MAIN in CORNELL, IL)
STATE MASTER (Illinois EPA Project) - AIR PROGRAM AIR MINOR (AIRS/AFS) CRITERIA AND HAZARDOUS AIR POLLUTANT INVENTORY (Inventory of air pollution sources) Business SIC classification: GRAIN AND FIELD BEANS Alternative names: GRAYMONT COOPERATIVE ASSOC
CORNELL ELEM SCHOOL (PO BOX 189 in CORNELL, IL)
(National Center for Education Statistics) - STATE ID-1705342602001 Organizations: CORNELL C C SCH DIST 426 (SCHOOL DISTRICT)
LIVINGSTON SERVICE CO (202 N THIRD ST in CORNELL, IL)
(Resource Conservation and Recovery Act (tracking hazardous waste)) Organizations: LIVINGSTON SERVICE COMPANY (CONTACT/OWNER)
CORNELL COMM HS DIST 70 (BOX 256 in CORNELL, IL)
COMPLIANCE ACTIVITY (Tracking inspections of insecticide, fungicide, and rodenticide, and toxic substances)
Housing units lacking complete plumbing facilities: 2.0% Housing units lacking complete kitchen facilities: 3.8%
61.3%Utility gas
23.4%Bottled, tank, or LP gas
11.9%Electricity
3.5%Wood
Population in 1990: 968. Population change in the 1990s: +189 (+19.5%).
Place of birth for U.S.-born residents:
This state: 1,125
Northeast: 43
Midwest: 53
South: 29
West: 18
67% of the 61319 zip code residents lived in the same house 5 years ago. Out of people who lived in different houses, 46% lived in this county. Out of people who lived in different counties, 50% lived in Illinois.
97% of the 61319 zip code residents lived in the same house 1 year ago. Out of people who lived in different houses, 15% moved from this county. Out of people who lived in different houses, 70% moved from different county within same state. Out of people who lived in different houses, 19% moved from different state.
Private vs. public school enrollment:
Students in private schools in grades 1 to 8 (elementary and middle school):
Here:
0.0%
Illinois:
13.3%
Students in private schools in grades 9 to 12 (high school):
Here:
1.5%
Illinois:
9.9%
Students in private undergraduate colleges: 18
Here:
54.5%
Illinois:
27.4%
Occupation by median earnings in the past 12 months ($)
62,791Installation, maintenance, and repair occupations
56,052Education, training, and library occupations
53,502Computer and mathematical occupations
46,859Production occupations
43,807Office and administrative support occupations
38,432Transportation occupations
Top industries in this zip code by the number of employees in 2005:
Arts, Entertainment, and Recreation: Golf Courses and Country Clubs (10-19 employees: 1 establishment)
Arts, Entertainment, and Recreation: All Other Amusement and Recreation Industries (5-9: 1)
2002 - 2018 National Fire Incident Reporting System (NFIRS) incidents
Based on the data from the years 2002 - 2018 the average number of fire incidents per year is 6. The highest number of fire incidents - 17 took place in 2009, and the least - 0 in 2006. The data has a growing trend.
When looking into fire subcategories, the most reports belonged to: Outside Fires (45.9%), and Structure Fires (43.1%).
Fire incident types reported to NFIRS in Zip Code 61319


 Nearest zip codes: 61313, 61311, 61364, 61743, 61333, 61764.


 Based on the data from the years 2002 - 2018 the average number of fire incidents per year is 6. The highest number of fire incidents - 17 took place in 2009, and the least - 0 in 2006. The data has a growing trend.
 When looking into fire subcategories, the most reports belonged to: Outside Fires (45.9%), and Structure Fires (43.1%).