Estimated zip code population in 2022: 595 Zip code population in 2010: 741 Zip code population in 2000: 757
Houses and condos: 281 Renter-occupied apartments: 42
% of renters here:
16%
State:
33%
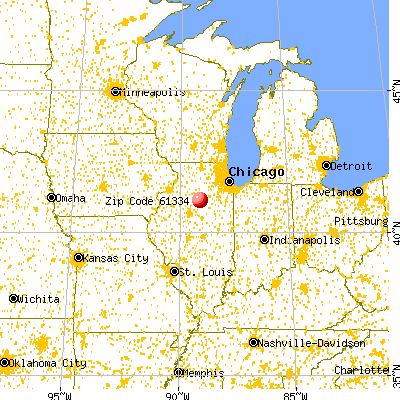
March 2022 cost of living index in zip code 61334: 83.9 (less than average, U.S. average is 100)
Land area: 37.1 sq. mi. Water area: 0.0 sq. mi.
Population density: 16 people per square mile
(very low).
OSM Map
General Map
Google Map
MSN Map
OSM Map
General Map
Google Map
MSN Map
OSM Map
General Map
Google Map
MSN Map
OSM Map
General Map
Google Map
MSN Map
Please wait while loading the map...
Real estate property taxes paid for housing units in 2022:
This zip code:
2.2% ($2,646)
Illinois:
2.0% ($4,912)
Median real estate property taxes paid for housing units with mortgages in 2022: $2,751 (2.4%) Median real estate property taxes paid for housing units with no mortgage in 2022: $2,523 (2.0%)
Business Search- 14 Million verified businesses
Males: 321
(54.0%)
Females: 274
(46.0%)
For population 25 years and over in 61334:
High school or higher: 93.7%
Bachelor's degree or higher: 14.9%
Graduate or professional degree: 4.9%
Unemployed: 2.2%
Mean travel time to work (commute): 28.3 minutes
For population 15 years and over in 61334:
Never married: 30.5%
Now married: 51.5%
Separated: 1.1%
Widowed: 4.6%
Divorced: 12.3%
Zip code 61334 compared to state average:
Median house value below state average.
Unemployed percentage below state average.
Black race population percentage significantly below state average.
Hispanic race population percentage below state average.
Median age above state average.
Foreign-born population percentage significantly below state average.
Renting percentage below state average.
Length of stay since moving in significantly above state average.
House age above state average.
Percentage of population with a bachelor's degree or higher significantly below state average.
Averages for the 2020 tax year for zip code 61334, filed in 2021:
Average Adjusted Gross Income (AGI) in 2020: $65,686 (Individual Income Tax Returns)
Here:
$65,686
State:
$82,626
Salary/wage: $51,590 (reported on 85.7% of returns)
Here:
$51,590
State:
$66,640
(% of AGI for various income ranges: 1210.0% for AGIs below $25k, 3571.7% for AGIs $25k-50k, 6122.0% for AGIs $50k-75k, 9963.3% for AGIs $75k-100k, 12874.0% for AGIs $100k-200k)
Taxable interest for individuals: $407 (reported on 40.0% of returns)
This zip code:
$407
Illinois:
$2,376
(% of AGI for various income ranges: 11.4% for AGIs below $25k, 6.7% for AGIs $25k-50k, 24.0% for AGIs $50k-75k, 16.7% for AGIs $75k-100k, 56.0% for AGIs $100k-200k)
Ordinary dividends: $2,271 (reported on 20.0% of returns)
Here:
$2,271
State:
$9,061
(% of AGI for various income ranges: 160.0% for AGIs $50k-75k, 158.0% for AGIs $100k-200k)
Net capital gain/loss in AGI: +$1,467 (reported on 17.1% of returns)
Here:
+$1,467
State:
+$31,684
(% of AGI for various income ranges: 16.7% for AGIs $25k-50k, 156.0% for AGIs $100k-200k)
Profit/loss from business: +$7,233 (reported on 8.6% of returns)
Here:
+$7,233
State:
+$12,175
(% of AGI for various income ranges: 434.0% for AGIs $50k-75k)
Taxable individual retirement arrangement distribution: $10,475 (reported on 11.4% of returns)
61334:
$10,475
Illinois:
$21,613
(% of AGI for various income ranges: 838.0% for AGIs $50k-75k)
Earned income credit: $2,425 (reported on 11.4% of returns)
Here:
$2,425
State:
$2,311
(% of AGI for various income ranges: 138.6% for AGIs below $25k)
Percentage of individuals using paid preparers for their 2020 taxes: 97.1%
Here:
97%
State:
93%
(% for various income ranges: 90.0% for AGIs below $25k, 100.0% for AGIs $25k-50k, 100.0% for AGIs $50k-75k, 100.0% for AGIs $75k-100k, 100.0% for AGIs $100k-200k)
Averages for the 2012 tax year for zip code 61334, filed in 2013:
Average Adjusted Gross Income (AGI) in 2012: $53,543 (Individual Income Tax Returns)
Here:
$53,543
State:
$68,058
Salary/wage: $41,114 (reported on 80.0% of returns)
Here:
$41,114
State:
$55,396
(% of AGI for various income ranges: 74.3% for AGIs below $25k, 73.6% for AGIs $25k-50k, 72.4% for AGIs $50k-75k, 63.0% for AGIs $75k-100k, 47.0% for AGIs $100k-200k)
Taxable interest for individuals: $776 (reported on 48.6% of returns)
This zip code:
$776
Illinois:
$1,969
(% of AGI for various income ranges: 1.0% for AGIs below $25k, 0.4% for AGIs $25k-50k, 0.3% for AGIs $50k-75k, 1.0% for AGIs $75k-100k, 0.8% for AGIs $100k-200k)
Ordinary dividends: $2,589 (reported on 25.7% of returns)
Here:
$2,589
State:
$7,786
(% of AGI for various income ranges: 0.9% for AGIs below $25k, 2.6% for AGIs $50k-75k, 1.8% for AGIs $100k-200k)
Net capital gain/loss in AGI: +$1,900 (reported on 14.3% of returns)
Here:
+$1,900
State:
+$22,183
Profit/loss from business: +$7,500 (reported on 8.6% of returns)
Here:
+$7,500
State:
+$12,903
Taxable individual retirement arrangement distribution: $6,550 (reported on 11.4% of returns)
61334:
$6,550
Illinois:
$17,929
Total itemized deductions: $18,089 (21% of AGI, reported on 25.7% of returns)
Here:
$18,089
State:
$26,433
Here:
21.4% of AGI
State:
19.2% of AGI
(% of AGI for various income ranges: 10.9% for AGIs $25k-50k, 8.8% for AGIs $50k-75k, 12.9% for AGIs $75k-100k, 7.0% for AGIs $100k-200k)
Charity contributions: $2,200 (reported on 17.1% of returns)
Here:
$2,200
State:
$4,525
Taxes paid: $6,688 (reported on 22.9% of returns)
61334:
$6,688
State:
$11,968
(% of AGI for various income ranges: 3.1% for AGIs $25k-50k, 3.1% for AGIs $50k-75k, 8.6% for AGIs $75k-100k)
Earned income credit: $2,450 (reported on 11.4% of returns)
Here:
$2,450
State:
$2,349
(% of AGI for various income ranges: 7.2% for AGIs below $25k)
Percentage of individuals using paid preparers for their 2012 taxes: 60.0%
Here:
60%
State:
57%
(% for various income ranges: 41.7% for AGIs below $25k, 62.5% for AGIs $25k-50k, 66.7% for AGIs $50k-75k, 75.0% for AGIs $75k-100k, 80.0% for AGIs $100k-200k)
Averages for the 2004 tax year for zip code 61334, filed in 2005:
Average Adjusted Gross Income (AGI) in 2004: $40,923 (Individual Income Tax Returns)
Here:
$40,923
State:
$54,625
Salary/wage: $35,341 (reported on 81.9% of returns)
Here:
$35,341
State:
$46,811
(% of AGI for various income ranges: 103.4% for AGIs below $10k, 72.5% for AGIs $10k-25k, 66.7% for AGIs $25k-50k, 75.0% for AGIs $50k-75k, 80.0% for AGIs $75k-100k, 56.2% for AGIs over 100k)
Taxable interest for individuals: $1,656 (reported on 58.9% of returns)
This zip code:
$1,656
Illinois:
$2,101
(% of AGI for various income ranges: 14.0% for AGIs below $10k, 2.8% for AGIs $10k-25k, 3.9% for AGIs $25k-50k, 1.1% for AGIs $50k-75k, 1.1% for AGIs $75k-100k, 2.3% for AGIs over 100k)
Taxable dividends: $2,380 (reported on 27.4% of returns)
Here:
$2,380
State:
$4,306
(% of AGI for various income ranges: 1.0% for AGIs $10k-25k, 3.0% for AGIs $25k-50k, 0.9% for AGIs $50k-75k, 2.8% for AGIs over 100k)
Profit/loss from business: +$477 (reported on 12.1% of returns)
Here:
+$477
State:
+$11,771
Profit/loss from farming: +$16,853 (reported on 9.3% of returns)
Here:
+$16,853
State:
+$2,327
IRA payment deduction: $3,652 (reported on 6.3% of returns)
61334:
$3,652
Illinois:
$3,087
Total itemized deductions: $13,405 (22% of AGI, reported on 20.3% of returns)
Here:
$13,405
State:
$20,239
Here:
22.1% of AGI
State:
19.5% of AGI
Charity contributions deductions: $1,776 (3% of AGI, reported on 15.9% of returns)
Here:
$1,776
State:
$3,719
Here:
2.7% of AGI
State:
3.4% of AGI
Total tax: $5,173 (reported on 80.5% of returns)
61334:
$5,173
State:
$9,882
(% of AGI for various income ranges: 3.4% for AGIs below $10k, 4.6% for AGIs $10k-25k, 8.0% for AGIs $25k-50k, 9.1% for AGIs $50k-75k, 11.0% for AGIs $75k-100k, 18.3% for AGIs over 100k)
Earned income credit: $1,857 (reported on 9.6% of returns)
Here:
$1,857
State:
$1,788
Percentage of individuals using paid preparers for their 2004 taxes: 77.0%
Here:
77%
State:
61%
(% for various income ranges: 66.1% for AGIs below $10k, 76.9% for AGIs $10k-25k, 77.1% for AGIs $25k-50k, 82.6% for AGIs $50k-75k, 78.1% for AGIs $75k-100k, 88.9% for AGIs over 100k)
Household received Food Stamps/SNAP in the past 12 months: 20 Household did not receive Food Stamps/SNAP in the past 12 months: 240
Women who had a birth in the past 12 months: 4 (0 now married, 4 unmarried) Women who did not have a birth in the past 12 months: 113 (41 now married, 72 unmarried)
Housing units in zip code 61334 with a mortgage: 134 (6 second mortgage) Houses without a mortgage: 11
Median monthly owner costs for units with a mortgage: $1,155 Median monthly owner costs for units without a mortgage: $616
Residents with income below the poverty level in 2022:
This zip code:
5.5%
Whole state:
11.9%
Residents with income below 50% of the poverty level in 2022:
This zip code:
0.9%
Whole state:
5.7%
Median number of rooms in houses and condos:
Here:
6.3
State:
6.4
Median number of rooms in apartments:
Here:
5.6
State:
4.1
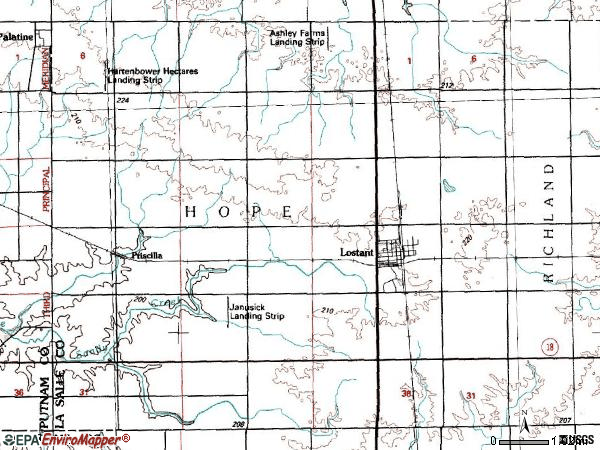
Notable locations in this zip code not listed on our city pages
Notable locations in zip code 61334: Lostant Community Fire Protection District (A), Lostant Emergency Services (B). Display/hide their locations on the map
Size of family households: 104 2-persons, 25 3-persons, 31 4-persons, 3 5-persons, 2 6-persons, 3 7-or-more-persons
Size of nonfamily households: 67 1-person, 27 2-persons
53 married couples with children.
48 single-parent households (26 men, 22 women).
98.1% of residents of 61334 zip code speak English at home.
1.0% of residents speak Spanish at home (100% very well).
Foreign born population: 5 (0.8%) (100.0% of them are naturalized citizens)
This zip code:
0.8%
Whole state:
14.4%
40%Honduras
35%German
11%American
7%English
5%Irish
4%Italian
2%European
1%Polish
Year of entry for the foreign-born population
02010 or later
02000 to 2009
01990 to 1999
2Before 1990
Facilities with environmental interests located in this zip code:
ADM GRAIN CO (POND STREET in LOSTANT, IL)
STATE MASTER (Illinois EPA Project) - AIR PROGRAM AIR MINOR (AIRS/AFS) CRITERIA AND HAZARDOUS AIR POLLUTANT INVENTORY (Inventory of air pollution sources) Business SIC classification: GRAIN AND FIELD BEANS Alternative names: TABOR GRAIN CO.
PHOENIX PAPER PRODUCTS (ROUTE 251 in LOSTANT, IL)
STATE MASTER (Illinois EPA Project) - AIR PROGRAM AIR MINOR (AIRS/AFS) CRITERIA AND HAZARDOUS AIR POLLUTANT INVENTORY (Inventory of air pollution sources) Business SIC classification: CONVERTED PAPER AND PAPERBOARD PRODUCTS
SALISBURY OIL CO (ROUTE 51 S EDGE LOSTANT in LOSTANT, IL)
STATE MASTER (Illinois EPA Project) - AIR PROGRAM AIR MINOR (AIRS/AFS) CRITERIA AND HAZARDOUS AIR POLLUTANT INVENTORY (Inventory of air pollution sources) Business SIC classification: PETROLEUM BULK STATIONS AND TERMINALS
JOHN WEAVER (ROOSEVELT AT 1ST STREET in LOSTANT, IL)
STATE MASTER (Illinois EPA Project) - AIR PROGRAM AIR MINOR (AIRS/AFS) Business SIC classification: NONCLASSIFIABLE ESTABLISHMENTS
LOSTANT WWTP (WEST 4TH STREET, ROUTE 251 in LOSTANT, IL)
STATE MASTER (Illinois EPA Project) - National Pollutant Discharge Elimination System Permit National Pollutant Discharge Elimination System NON-MAJOR (Tracking pollutant discharge elimination systems) - permit Business SIC classification: SEWERAGE SYSTEMS Alternative names: LOSTANT WWTP, VILLAGE OF
PRICILLA GRAIN (R.R. 1 in LOSTANT, IL)
STATE MASTER (Illinois EPA Project) - AIR PROGRAM AIR MINOR (AIRS/AFS) Business SIC classification: GRAIN AND FIELD BEANS
JIMS GARAGE (1ST AND MAIN in LOSTANT, IL)
STATE MASTER (Illinois EPA Project) - HAZARDOUS WASTE PROGRAM Conditionally Exempt Small Quantity Generators, less than 100 kg/month of hazardous waste (Resource Conservation and Recovery Act (tracking hazardous waste)) - notification Organizations: COOPER JAMES K (CONTACT/OWNER)
LOSTANT ELEM SCHOOL (P O BOX 320 in LOSTANT, IL)
(National Center for Education Statistics) - STATE ID-3505042502001 Organizations: LOSTANT COMM UNIT SCH DIST 425 (SCHOOL DISTRICT)
AT&T LONG LINES LOSTANT (1.5MI N & 1MI W OF LOSTANT in LOSTANT, IL)
(Resource Conservation and Recovery Act (tracking hazardous waste))
LOSTANT SCHOOL DIST 425 (315 W 3RD ST PO BOX 205 in LOSTANT, IL)
COMPLIANCE ACTIVITY (Tracking inspections of insecticide, fungicide, and rodenticide, and toxic substances) Small Quantity Generators, between 100 kg and 1000 kg of hazardous waste/month (Resource Conservation and Recovery Act (tracking hazardous waste)) - notification Alternative names: LOSTANT COMMUNITY SD #425, LOSTANT COMM CONS SCH DIST 25, LOSTANT COMM HS DIST 400
LASALLE COUNTY FS CO. (NORTH 15TH ROAD, BOX 1-A in LOSTANT, IL)
ENFORCEMENT/COMPLIANCE ACTIVITY (Integrated Compliance Information System)
Housing units lacking complete plumbing facilities: 2.3% Housing units lacking complete kitchen facilities: 0.3%
63.7%Utility gas
28.0%Bottled, tank, or LP gas
5.0%Electricity
2.3%Fuel oil, kerosene, etc.
1.2%Wood
Population in 1990: 747. Population change in the 1990s: +10 (+1.3%).
Place of birth for U.S.-born residents:
This state: 502
Northeast: 4
Midwest: 23
South: 32
West: 25
73% of the 61334 zip code residents lived in the same house 5 years ago. Out of people who lived in different houses, 67% lived in this county. Out of people who lived in different counties, 50% lived in Illinois.
98% of the 61334 zip code residents lived in the same house 1 year ago. Out of people who lived in different houses, 33% moved from this county. Out of people who lived in different houses, 56% moved from different county within same state.
Private vs. public school enrollment:
Students in private schools in grades 1 to 8 (elementary and middle school): 3
Here:
5.2%
Illinois:
13.3%
Students in private schools in grades 9 to 12 (high school): 1
Here:
8.5%
Illinois:
9.9%
Students in private undergraduate colleges: 15
Here:
41.6%
Illinois:
27.4%
Occupation by median earnings in the past 12 months ($)
99,775Architecture and engineering occupations
97,422Health diagnosing and treating practitioners and other technical occupations
89,616Management occupations
87,385Transportation occupations
74,639Installation, maintenance, and repair occupations
63,671Education, training, and library occupations
Top industries in this zip code by the number of employees in 2005:
Accommodation and Food Services: Full-Service Restaurants (10-19 employees: 1 establishment)
Construction: Power and Communication Line and Related Structures Construction (10-19: 1)
Accommodation and Food Services: Caterers (5-9: 1)
Health Care and Social Assistance: Offices of Chiropractors (5-9: 1)
Other Services (except Public Administration): General Automotive Repair (1-4: 1)
Administrative and Support and Waste Management and Remediation Services: All Other Support Services (1-4: 1)
Other Services (except Public Administration): Funeral Homes and Funeral Services (1-4: 1)
Fatal accident statistics in 2014:
Fatal accident count: 1
Vehicles involved in fatal accidents: 2
Fatal accidents caused by drunken drivers: 0
Fatalities: 1
Persons involved in fatal accidents: 2
Pedestrians involved in fatal accidents: 0
2002 - 2018 National Fire Incident Reporting System (NFIRS) incidents
According to the data from the years 2002 - 2018 the average number of fire incidents per year is 12. The highest number of reported fires - 25 took place in 2013, and the least - 0 in 2006. The data has a growing trend.
When looking into fire subcategories, the most reports belonged to: Outside Fires (39.2%), and Structure Fires (35.8%).
Fire incident types reported to NFIRS in Zip Code 61334


 Nearest zip codes: 61370, 61377, 61316, 61332, 61335, 61336.


 According to the data from the years 2002 - 2018 the average number of fire incidents per year is 12. The highest number of reported fires - 25 took place in 2013, and the least - 0 in 2006. The data has a growing trend.
 When looking into fire subcategories, the most reports belonged to: Outside Fires (39.2%), and Structure Fires (35.8%).