Estimated zip code population in 2022: 1,332 Zip code population in 2010: 1,409 Zip code population in 2000: 1,474
Houses and condos: 656 Renter-occupied apartments: 77
% of renters here:
15%
State:
33%
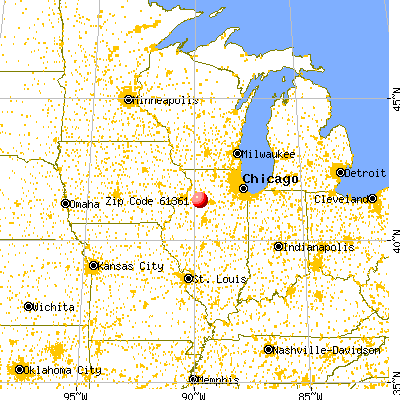
March 2022 cost of living index in zip code 61361: 84.1 (less than average, U.S. average is 100)
Land area: 85.1 sq. mi. Water area: 0.3 sq. mi.
Population density: 16 people per square mile
(very low).
OSM Map
General Map
Google Map
MSN Map
OSM Map
General Map
Google Map
MSN Map
OSM Map
General Map
Google Map
MSN Map
OSM Map
General Map
Google Map
MSN Map
Please wait while loading the map...
Real estate property taxes paid for housing units in 2022:
This zip code:
1.9% ($2,515)
Illinois:
2.0% ($4,912)
Median real estate property taxes paid for housing units with mortgages in 2022: $2,742 (1.8%) Median real estate property taxes paid for housing units with no mortgage in 2022: $1,225 (1.4%)
Business Search- 14 Million verified businesses
Males: 667
(50.1%)
Females: 664
(49.9%)
For population 25 years and over in 61361:
High school or higher: 89.1%
Bachelor's degree or higher: 22.1%
Graduate or professional degree: 7.3%
Unemployed: 2.3%
Mean travel time to work (commute): 27.7 minutes
For population 15 years and over in 61361:
Never married: 23.7%
Now married: 61.0%
Separated: 0.6%
Widowed: 3.3%
Divorced: 11.3%
Zip code 61361 compared to state average:
Median house value below state average.
Unemployed percentage below state average.
Black race population percentage significantly below state average.
Hispanic race population percentage significantly below state average.
Foreign-born population percentage significantly below state average.
Renting percentage below state average.
Length of stay since moving in significantly above state average.
Number of rooms per house above state average.
House age above state average.
Percentage of population with a bachelor's degree or higher below state average.
Averages for the 2020 tax year for zip code 61361, filed in 2021:
Average Adjusted Gross Income (AGI) in 2020: $57,071 (Individual Income Tax Returns)
Here:
$57,071
State:
$82,626
Salary/wage: $49,914 (reported on 77.8% of returns)
Here:
$49,914
State:
$66,640
(% of AGI for various income ranges: 1086.2% for AGIs below $25k, 3540.9% for AGIs $25k-50k, 6900.0% for AGIs $50k-75k, 10120.0% for AGIs $75k-100k, 15435.0% for AGIs $100k-200k)
Taxable interest for individuals: $604 (reported on 38.1% of returns)
This zip code:
$604
Illinois:
$2,376
(% of AGI for various income ranges: 10.8% for AGIs below $25k, 10.9% for AGIs $25k-50k, 27.1% for AGIs $50k-75k, 34.0% for AGIs $75k-100k, 138.3% for AGIs $100k-200k)
Ordinary dividends: $2,911 (reported on 14.3% of returns)
Here:
$2,911
State:
$9,061
(% of AGI for various income ranges: 22.3% for AGIs below $25k, 84.3% for AGIs $50k-75k, 290.0% for AGIs $100k-200k)
Net capital gain/loss in AGI: +$4,000 (reported on 14.3% of returns)
Here:
+$4,000
State:
+$31,684
(% of AGI for various income ranges: 6.9% for AGIs below $25k, 251.4% for AGIs $50k-75k, 291.7% for AGIs $100k-200k)
Profit/loss from business: +$6,325 (reported on 12.7% of returns)
Here:
+$6,325
State:
+$12,175
(% of AGI for various income ranges: 167.7% for AGIs below $25k, 214.5% for AGIs $25k-50k, 104.0% for AGIs $75k-100k)
Taxable individual retirement arrangement distribution: $7,457 (reported on 11.1% of returns)
61361:
$7,457
Illinois:
$21,613
(% of AGI for various income ranges: 155.4% for AGIs below $25k, 457.1% for AGIs $50k-75k)
Earned income credit: $2,243 (reported on 11.1% of returns)
Here:
$2,243
State:
$2,311
(% of AGI for various income ranges: 78.5% for AGIs below $25k, 50.0% for AGIs $25k-50k)
Percentage of individuals using paid preparers for their 2020 taxes: 92.1%
Here:
92%
State:
93%
(% for various income ranges: 90.0% for AGIs below $25k, 92.9% for AGIs $25k-50k, 100.0% for AGIs $50k-75k, 87.5% for AGIs $75k-100k, 90.9% for AGIs $100k-200k)
Averages for the 2012 tax year for zip code 61361, filed in 2013:
Average Adjusted Gross Income (AGI) in 2012: $45,763 (Individual Income Tax Returns)
Here:
$45,763
State:
$68,058
Salary/wage: $35,876 (reported on 80.9% of returns)
Here:
$35,876
State:
$55,396
(% of AGI for various income ranges: 69.5% for AGIs below $25k, 77.1% for AGIs $25k-50k, 73.6% for AGIs $50k-75k, 68.9% for AGIs $75k-100k, 44.1% for AGIs $100k-200k)
Taxable interest for individuals: $648 (reported on 42.6% of returns)
This zip code:
$648
Illinois:
$1,969
(% of AGI for various income ranges: 2.2% for AGIs below $25k, 0.4% for AGIs $25k-50k, 0.3% for AGIs $50k-75k, 0.4% for AGIs $75k-100k, 0.5% for AGIs $100k-200k)
Ordinary dividends: $1,731 (reported on 19.1% of returns)
Here:
$1,731
State:
$7,786
(% of AGI for various income ranges: 0.9% for AGIs below $25k, 1.0% for AGIs $25k-50k, 1.1% for AGIs $75k-100k, 0.7% for AGIs $100k-200k)
Net capital gain/loss in AGI: +$2,238 (reported on 11.8% of returns)
Here:
+$2,238
State:
+$22,183
Profit/loss from business: +$7,127 (reported on 16.2% of returns)
Here:
+$7,127
State:
+$12,903
(% of AGI for various income ranges: 6.4% for AGIs below $25k, 2.7% for AGIs $25k-50k, 5.1% for AGIs $50k-75k, 1.5% for AGIs $75k-100k)
Taxable individual retirement arrangement distribution: $6,286 (reported on 10.3% of returns)
61361:
$6,286
Illinois:
$17,929
(% of AGI for various income ranges: 3.0% for AGIs below $25k, 2.6% for AGIs $25k-50k, 3.4% for AGIs $75k-100k)
Total itemized deductions: $17,183 (20% of AGI, reported on 17.6% of returns)
Here:
$17,183
State:
$26,433
Here:
20.2% of AGI
State:
19.2% of AGI
(% of AGI for various income ranges: 12.0% for AGIs $25k-50k, 4.8% for AGIs $50k-75k, 6.1% for AGIs $75k-100k, 7.2% for AGIs $100k-200k)
Charity contributions: $3,438 (reported on 11.8% of returns)
Here:
$3,438
State:
$4,525
(% of AGI for various income ranges: 3.2% for AGIs below $25k, 0.9% for AGIs $50k-75k, 1.1% for AGIs $100k-200k)
Taxes paid: $6,017 (reported on 17.6% of returns)
61361:
$6,017
State:
$11,968
(% of AGI for various income ranges: 1.8% for AGIs below $25k, 1.9% for AGIs $25k-50k, 1.8% for AGIs $50k-75k, 2.4% for AGIs $75k-100k, 3.0% for AGIs $100k-200k)
Earned income credit: $2,133 (reported on 17.6% of returns)
Here:
$2,133
State:
$2,349
(% of AGI for various income ranges: 5.4% for AGIs below $25k, 1.3% for AGIs $25k-50k)
Percentage of individuals using paid preparers for their 2012 taxes: 64.7%
Here:
65%
State:
57%
(% for various income ranges: 60.7% for AGIs below $25k, 62.5% for AGIs $25k-50k, 54.5% for AGIs $50k-75k, 83.3% for AGIs $75k-100k, 85.7% for AGIs $100k-200k)
Averages for the 2004 tax year for zip code 61361, filed in 2005:
Average Adjusted Gross Income (AGI) in 2004: $33,730 (Individual Income Tax Returns)
Here:
$33,730
State:
$54,625
Salary/wage: $29,851 (reported on 79.5% of returns)
Here:
$29,851
State:
$46,811
(% of AGI for various income ranges: 91.9% for AGIs below $10k, 63.8% for AGIs $10k-25k, 79.3% for AGIs $25k-50k, 74.6% for AGIs $50k-75k, 65.1% for AGIs $75k-100k, 53.7% for AGIs over 100k)
Taxable interest for individuals: $1,388 (reported on 57.3% of returns)
This zip code:
$1,388
Illinois:
$2,101
(% of AGI for various income ranges: 10.3% for AGIs below $10k, 6.6% for AGIs $10k-25k, 1.4% for AGIs $25k-50k, 1.9% for AGIs $50k-75k, 0.9% for AGIs $75k-100k, 1.5% for AGIs over 100k)
Taxable dividends: $918 (reported on 26.0% of returns)
Here:
$918
State:
$4,306
(% of AGI for various income ranges: 5.0% for AGIs below $10k, 2.0% for AGIs $10k-25k, 0.4% for AGIs $25k-50k, 0.2% for AGIs $50k-75k, 0.5% for AGIs $75k-100k, 0.7% for AGIs over 100k)
Net capital gain/loss: +$5,841 (reported on 15.3% of returns)
Here:
+$5,841
State:
+$17,321
(% of AGI for various income ranges: -2.7% for AGIs below $10k, -0.1% for AGIs $10k-25k, 0.4% for AGIs $25k-50k, 1.6% for AGIs $50k-75k, 15.6% for AGIs over 100k)
Profit/loss from business: +$2,511 (reported on 13.1% of returns)
Here:
+$2,511
State:
+$11,771
(% of AGI for various income ranges: 7.5% for AGIs below $10k, 6.9% for AGIs $10k-25k, -1.1% for AGIs $25k-50k, 0.5% for AGIs $50k-75k, 0.2% for AGIs $75k-100k)
Profit/loss from farming: +$8,471 (reported on 10.0% of returns)
Here:
+$8,471
State:
+$2,327
(% of AGI for various income ranges: -9.3% for AGIs below $10k, 0.7% for AGIs $10k-25k, 3.5% for AGIs $25k-50k, 1.7% for AGIs $50k-75k, 7.7% for AGIs $75k-100k)
IRA payment deduction: $2,647 (reported on 2.4% of returns)
61361:
$2,647
Illinois:
$3,087
Total itemized deductions: $13,694 (25% of AGI, reported on 17.3% of returns)
Here:
$13,694
State:
$20,239
Here:
24.6% of AGI
State:
19.5% of AGI
(% of AGI for various income ranges: 10.3% for AGIs $10k-25k, 6.6% for AGIs $25k-50k, 6.1% for AGIs $50k-75k, 7.3% for AGIs $75k-100k, 7.5% for AGIs over 100k)
Charity contributions deductions: $2,546 (4% of AGI, reported on 13.8% of returns)
Here:
$2,546
State:
$3,719
Here:
4.5% of AGI
State:
3.4% of AGI
(% of AGI for various income ranges: 1.3% for AGIs $10k-25k, 1.0% for AGIs $25k-50k, 1.1% for AGIs $50k-75k, 0.7% for AGIs $75k-100k, 1.4% for AGIs over 100k)
Total tax: $4,249 (reported on 72.2% of returns)
61361:
$4,249
State:
$9,882
(% of AGI for various income ranges: 2.4% for AGIs below $10k, 4.5% for AGIs $10k-25k, 7.0% for AGIs $25k-50k, 9.0% for AGIs $50k-75k, 12.8% for AGIs $75k-100k, 14.0% for AGIs over 100k)
Earned income credit: $1,545 (reported on 14.1% of returns)
Here:
$1,545
State:
$1,788
Percentage of individuals using paid preparers for their 2004 taxes: 68.9%
Here:
69%
State:
61%
(% for various income ranges: 61.6% for AGIs below $10k, 66.1% for AGIs $10k-25k, 70.6% for AGIs $25k-50k, 74.3% for AGIs $50k-75k, 80.9% for AGIs $75k-100k, 80.8% for AGIs over 100k)
Household received Food Stamps/SNAP in the past 12 months: 48 Household did not receive Food Stamps/SNAP in the past 12 months: 474
Women who had a birth in the past 12 months: 12 (12 now married, 0 unmarried) Women who did not have a birth in the past 12 months: 280 (120 now married, 159 unmarried)
Housing units in zip code 61361 with a mortgage: 305 (32 second mortgage, 22 both second mortgage and home equity loan) Houses without a mortgage: 6
Median monthly owner costs for units with a mortgage: $1,314 Median monthly owner costs for units without a mortgage: $446
Residents with income below the poverty level in 2022:
This zip code:
9.7%
Whole state:
11.9%
Residents with income below 50% of the poverty level in 2022:
This zip code:
5.2%
Whole state:
5.7%
Median number of rooms in houses and condos:
Here:
7.6
State:
6.4
Median number of rooms in apartments:
Here:
6.0
State:
4.1
Notable locations in this zip code not listed on our city pages
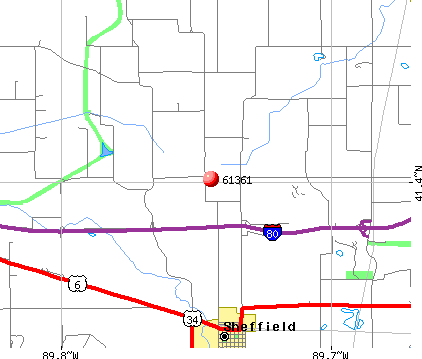
Notable locations in zip code 61361: Hidden Lake Country Club (A), Sheffield Public Library (B), Sheffield Rescue Unit (C), Sheffield Fire Protection District (D). Display/hide their locations on the map
Churches in zip code 61361 include: Old Danish Church (A), First United Church of Christ (B), Saint Patricks Church (C). Display/hide their locations on the map
Cemeteries: Follett Cemetery (1), Hopeland Cemetery (2), Saint Patrick Cemetery (3), Gold Township Cemetery (4), Anderson Family Cemetery (5), Sheffield Cemetery (6). Display/hide their locations on the map
Size of family households: 170 2-persons, 82 3-persons, 59 4-persons, 32 5-persons, 21 6-persons
Size of nonfamily households: 83 1-person, 61 2-persons, 14 3-persons
183 married couples with children.
5 single-parent households (5 men).
96.5% of residents of 61361 zip code speak English at home.
1.1% of residents speak other Indo-European language at home (100% very well).
1.1% of residents speak Asian or Pacific Island language at home (100% very well).
0.3% of residents speak other language at home (100% very well).
Foreign born population: 0 (0.0%)
:
0.0%
Whole state:
14.4%
32%German
19%English
11%American
11%Belgian
7%Irish
7%Italian
3%Swedish
Year of entry for the foreign-born population
102010 or later
02000 to 2009
31990 to 1999
9Before 1990
Facilities with environmental interests located in this zip code:
ARTHUR L WATTS (P.O. BOX 216 in SHEFFIELD, IL)
STATE MASTER (Illinois EPA Project) - National Pollutant Discharge Elimination System Permit National Pollutant Discharge Elimination System NON-MAJOR (Tracking pollutant discharge elimination systems) - permit Organizations: WATTS?ARTHUR L. (CONTACT/OWNER)
Alternative names: WATTS, ARTHUR L. TRUCKING, WATTS TRUCKING?ARTHUR L.
JAMCO CO (100 MAIN in SHEFFIELD, IL)
STATE MASTER (Illinois EPA Project) - SOLID WASTE PROGRAM TRANSPORTER (Resource Conservation and Recovery Act (tracking hazardous waste)) Organizations: JAMES R MURPHY (CONTACT/OWNER)
MOORE OIL CO (BOX 696 in SHEFFIELD, IL)
STATE MASTER (Illinois EPA Project) - AIR PROGRAM AIR MINOR (AIRS/AFS) Business SIC classification: PETROLEUM BULK STATIONS AND TERMINALS
ODELL ENTERPRISES LLC (N. RAILROAD ST in SHEFFIELD, IL)
STATE MASTER (Illinois EPA Project) - AIR PROGRAM AIR MINOR (AIRS/AFS) Business SIC classification: PETROLEUM BULK STATIONS AND TERMINALS Alternative names: BARNETT OIL CO, ODELL ENTERPRISES LLC D/B/A BARKER ENERG
MICHLIG AGRI CENTER INC. (PO BOX 195 in SHEFFIELD, IL)
AIR MINOR (AIRS/AFS) CRITERIA AND HAZARDOUS AIR POLLUTANT INVENTORY (Inventory of air pollution sources) Business SIC classification: GRAIN AND FIELD BEANS Alternative names: CONSOLIDATED GRAIN & BARGE CO.
MILLER FERTILIZER SERVICE (700 EAST STREET in SHEFFIELD, IL)
National Pollutant Discharge Elimination System NON-MAJOR (Tracking pollutant discharge elimination systems) - permit
AG VIEW FS INC. (BUREAU SERVICE CO.) (107 W. MAIN in SHEFFIELD, IL)
ENFORCEMENT/COMPLIANCE ACTIVITY (Integrated Compliance Information System) COMPLIANCE ACTIVITY (Tracking inspections of insecticide, fungicide, and rodenticide, and toxic substances) Alternative names: BUREAU SERVICE COMPANY SHEFFIELD, BUREAU SERVICE COM
HENNEPIN CANAL PARKWAY STATE PARK (16006 875 E ST in SHEFFIELD, IL)
Conditionally Exempt Small Quantity Generators, less than 100 kg/month of hazardous waste (Resource Conservation and Recovery Act (tracking hazardous waste)) - notification Organizations: STATE OF IL DEPT OF NATURAL RESOURCES (CONTACT/OWNER)
MICHLIG AGRICENTER (20182 HWY 40 in SHEFFIELD, IL)
ENFORCEMENT/COMPLIANCE ACTIVITY (Integrated Compliance Information System)
Housing units lacking complete plumbing facilities: 3.5% Housing units lacking complete kitchen facilities: 2.9%
60.7%Utility gas
21.2%Bottled, tank, or LP gas
9.9%Fuel oil, kerosene, etc.
7.4%Electricity
1.4%Other fuel
Population in 1990: 1,964.
Place of birth for U.S.-born residents:
This state: 1,062
Northeast: 32
Midwest: 157
South: 12
West: 42
71% of the 61361 zip code residents lived in the same house 5 years ago. Out of people who lived in different houses, 64% lived in this county. Out of people who lived in different counties, 50% lived in Illinois.
92% of the 61361 zip code residents lived in the same house 1 year ago. Out of people who lived in different houses, 56% moved from this county. Out of people who lived in different houses, 34% moved from different county within same state. Out of people who lived in different houses, 8% moved from different state.
Private vs. public school enrollment:
Students in private schools in grades 1 to 8 (elementary and middle school): 2
Here:
1.9%
Illinois:
13.3%
Students in private schools in grades 9 to 12 (high school): 4
Here:
11.3%
Illinois:
9.9%
Students in private undergraduate colleges: 7
Here:
15.0%
Illinois:
27.4%
Occupation by median earnings in the past 12 months ($)
92,638Sales and related occupations
70,821Health diagnosing and treating practitioners and other technical occupations
66,175Transportation occupations
63,428Management occupations
58,255Health technologists and technicians
51,195Computer and mathematical occupations
Top industries in this zip code by the number of employees in 2005:
Accommodation and Food Services: Hotels (except Casino Hotels) and Motels (10-19 employees: 1 establishment)
Construction: Plumbing, Heating, and Air-Conditioning Contractors (10-19: 1)
Finance and Insurance: Insurance Agencies and Brokerages (5-9: 1, 1-4: 1)
Information: Newspaper Publishers (5-9: 1)
Health Care and Social Assistance: Offices of Physicians (except Mental Health Specialists) (5-9: 1)
Finance and Insurance: Commercial Banking (5-9: 1)
Other Services (except Public Administration): Religious Organizations (1-4: 2)
People in group quarters in 2000:
2 people in religious group quarters
Fatal accident statistics in 2014:
Fatal accident count: 1
Vehicles involved in fatal accidents: 1
Fatal accidents caused by drunken drivers: 0
Fatalities: 1
Persons involved in fatal accidents: 1
Pedestrians involved in fatal accidents: 0
Fatal accident statistics in 2013:
Fatal accident count: 1
Vehicles involved in fatal accidents: 2
Fatal accidents caused by drunken drivers: 1
Fatalities: 1
Persons involved in fatal accidents: 2
Pedestrians involved in fatal accidents: 0
2002 - 2018 National Fire Incident Reporting System (NFIRS) incidents
According to the data from the years 2002 - 2018 the average number of fire incidents per year is 12. The highest number of reported fires - 48 took place in 2010, and the least - 2 in 2018. The data has a dropping trend.
When looking into fire subcategories, the most reports belonged to: Outside Fires (38.0%), and Structure Fires (33.5%).
Fire incident types reported to NFIRS in Zip Code 61361


 Nearest zip codes: 61344, 61338, 61346, 61345, 61314, 61379.


 According to the data from the years 2002 - 2018 the average number of fire incidents per year is 12. The highest number of reported fires - 48 took place in 2010, and the least - 2 in 2018. The data has a dropping trend.
 When looking into fire subcategories, the most reports belonged to: Outside Fires (38.0%), and Structure Fires (33.5%).