Estimated zip code population in 2022: 1,373 Zip code population in 2010: 1,711 Zip code population in 2000: 1,661
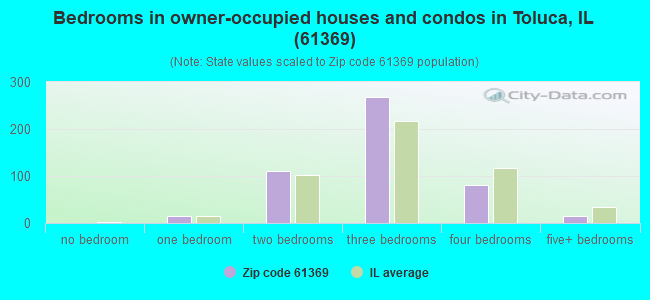
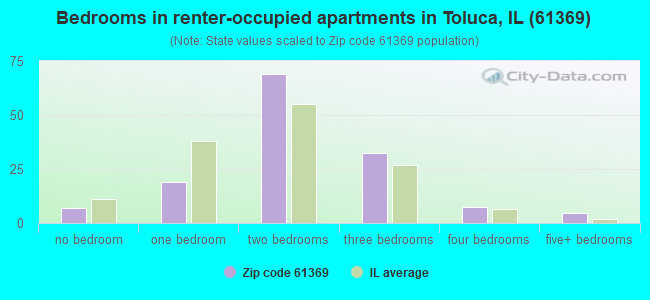
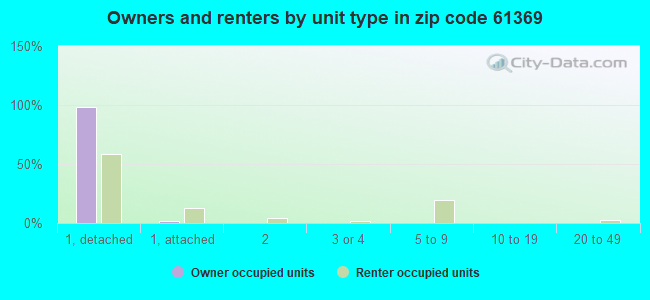
Houses and condos: 782 Renter-occupied apartments: 139
% of renters here:
22%
State:
33%
March 2022 cost of living index in zip code 61369: 84.3 (less than average, U.S. average is 100)
Land area: 45.9 sq. mi. Water area: 0.0 sq. mi.
Population density: 30 people per square mile
(very low).
OSM Map
General Map
Google Map
MSN Map
OSM Map
General Map
Google Map
MSN Map
OSM Map
General Map
Google Map
MSN Map
OSM Map
General Map
Google Map
MSN Map
Please wait while loading the map...
Real estate property taxes paid for housing units in 2022:
This zip code:
1.9% ($2,215)
Illinois:
2.0% ($4,912)
Median real estate property taxes paid for housing units with mortgages in 2022: $2,631 (2.2%) Median real estate property taxes paid for housing units with no mortgage in 2022: $1,940 (1.7%)
Business Search- 14 Million verified businesses
Males: 669
(48.8%)
Females: 703
(51.2%)
For population 25 years and over in 61369:
High school or higher: 89.2%
Bachelor's degree or higher: 12.3%
Graduate or professional degree: 4.1%
Unemployed: 4.1%
Mean travel time to work (commute): 24.3 minutes
For population 15 years and over in 61369:
Never married: 30.5%
Now married: 46.3%
Separated: 0.7%
Widowed: 9.3%
Divorced: 13.2%
Zip code 61369 compared to state average:
Median house value below state average.
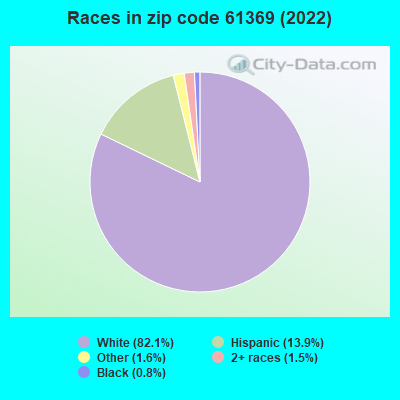
Black race population percentage significantly below state average.
Median age significantly above state average.
Foreign-born population percentage significantly below state average.
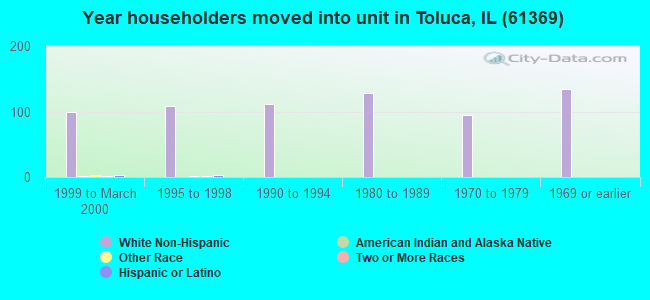
Length of stay since moving in significantly above state average.
Number of college students significantly below state average.
Percentage of population with a bachelor's degree or higher significantly below state average.
Estimated median house/condo value in 2022: $115,961
61369:
$115,961
Illinois:
$251,600
According to our research of Illinois and other state lists, there were 2 registered sex offenders living in 61369 zip code as of May 28, 2024. The ratio of all residents to sex offenders in zip code 61369 is 847 to 1. The ratio of registered sex offenders to all residents in this zip code is near the state average.
Median resident age:
This zip code:
51.9 years
Illinois median age:
39.1 years
Average household size:
This zip code:
2.0 people
Illinois:
2.4 people
Averages for the 2020 tax year for zip code 61369, filed in 2021:
Average Adjusted Gross Income (AGI) in 2020: $54,523 (Individual Income Tax Returns)
Here:
$54,523
State:
$82,626
Salary/wage: $44,235 (reported on 78.5% of returns)
Here:
$44,235
State:
$66,640
(% of AGI for various income ranges: 1087.2% for AGIs below $25k, 3696.2% for AGIs $25k-50k, 6046.2% for AGIs $50k-75k, 7730.0% for AGIs $75k-100k, 16800.0% for AGIs $100k-200k)
Taxable interest for individuals: $1,286 (reported on 45.6% of returns)
This zip code:
$1,286
Illinois:
$2,376
(% of AGI for various income ranges: 31.7% for AGIs below $25k, 35.0% for AGIs $25k-50k, 112.5% for AGIs $50k-75k, 185.0% for AGIs $75k-100k, 248.3% for AGIs $100k-200k)
Ordinary dividends: $4,887 (reported on 19.0% of returns)
Here:
$4,887
State:
$9,061
(% of AGI for various income ranges: 22.2% for AGIs below $25k, 40.0% for AGIs $25k-50k, 42.5% for AGIs $50k-75k, 81.7% for AGIs $75k-100k, 910.0% for AGIs $100k-200k)
Net capital gain/loss in AGI: +$5,115 (reported on 16.5% of returns)
Here:
+$5,115
State:
+$31,684
(% of AGI for various income ranges: 21.2% for AGIs $25k-50k, 202.5% for AGIs $50k-75k, 781.7% for AGIs $100k-200k)
Profit/loss from business: +$5,767 (reported on 7.6% of returns)
Here:
+$5,767
State:
+$12,175
(% of AGI for various income ranges: 175.0% for AGIs below $25k, 38.8% for AGIs $50k-75k)
Taxable individual retirement arrangement distribution: $12,300 (reported on 15.2% of returns)
61369:
$12,300
Illinois:
$21,613
(% of AGI for various income ranges: 83.3% for AGIs below $25k, 156.2% for AGIs $25k-50k, 648.8% for AGIs $50k-75k, 928.3% for AGIs $100k-200k)
Earned income credit: $2,438 (reported on 16.5% of returns)
Here:
$2,438
State:
$2,311
(% of AGI for various income ranges: 103.9% for AGIs below $25k, 81.2% for AGIs $25k-50k)
Percentage of individuals using paid preparers for their 2020 taxes: 92.4%
Here:
92%
State:
93%
(% for various income ranges: 92.3% for AGIs below $25k, 95.2% for AGIs $25k-50k, 90.9% for AGIs $50k-75k, 88.9% for AGIs $75k-100k, 91.7% for AGIs $100k-200k)
Averages for the 2012 tax year for zip code 61369, filed in 2013:
Average Adjusted Gross Income (AGI) in 2012: $52,537 (Individual Income Tax Returns)
Here:
$52,537
State:
$68,058
Salary/wage: $37,797 (reported on 79.7% of returns)
Here:
$37,797
State:
$55,396
(% of AGI for various income ranges: 66.1% for AGIs below $25k, 76.2% for AGIs $25k-50k, 71.1% for AGIs $50k-75k, 60.9% for AGIs $75k-100k, 39.3% for AGIs $100k-200k)
Taxable interest for individuals: $1,209 (reported on 44.3% of returns)
This zip code:
$1,209
Illinois:
$1,969
(% of AGI for various income ranges: 1.8% for AGIs below $25k, 1.0% for AGIs $25k-50k, 1.7% for AGIs $50k-75k, 0.8% for AGIs $75k-100k, 0.7% for AGIs $100k-200k)
Ordinary dividends: $3,010 (reported on 25.3% of returns)
Here:
$3,010
State:
$7,786
(% of AGI for various income ranges: 1.5% for AGIs below $25k, 0.5% for AGIs $25k-50k, 1.9% for AGIs $50k-75k, 0.7% for AGIs $75k-100k, 2.1% for AGIs $100k-200k)
Net capital gain/loss in AGI: +$6,425 (reported on 15.2% of returns)
Here:
+$6,425
State:
+$22,183
(% of AGI for various income ranges: 1.1% for AGIs $25k-50k, 1.2% for AGIs $75k-100k, 3.8% for AGIs $100k-200k)
Profit/loss from business: +$7,683 (reported on 7.6% of returns)
Here:
+$7,683
State:
+$12,903
(% of AGI for various income ranges: 3.3% for AGIs below $25k, 2.4% for AGIs $25k-50k, 2.1% for AGIs $75k-100k)
Taxable individual retirement arrangement distribution: $8,100 (reported on 13.9% of returns)
61369:
$8,100
Illinois:
$17,929
(% of AGI for various income ranges: 6.1% for AGIs below $25k, 4.4% for AGIs $25k-50k, 4.3% for AGIs $75k-100k)
Total itemized deductions: $19,165 (18% of AGI, reported on 21.5% of returns)
Here:
$19,165
State:
$26,433
Here:
18.1% of AGI
State:
19.2% of AGI
(% of AGI for various income ranges: 7.3% for AGIs $25k-50k, 10.0% for AGIs $50k-75k, 11.1% for AGIs $75k-100k, 7.2% for AGIs $100k-200k)
Charity contributions: $2,723 (reported on 16.5% of returns)
Here:
$2,723
State:
$4,525
(% of AGI for various income ranges: 0.9% for AGIs below $25k, 0.8% for AGIs $50k-75k, 1.0% for AGIs $75k-100k, 1.2% for AGIs $100k-200k)
Taxes paid: $8,000 (reported on 21.5% of returns)
61369:
$8,000
State:
$11,968
(% of AGI for various income ranges: 2.1% for AGIs $25k-50k, 3.3% for AGIs $50k-75k, 3.6% for AGIs $75k-100k, 4.4% for AGIs $100k-200k)
Earned income credit: $2,364 (reported on 13.9% of returns)
Here:
$2,364
State:
$2,349
(% of AGI for various income ranges: 5.4% for AGIs below $25k, 1.0% for AGIs $25k-50k)
Percentage of individuals using paid preparers for their 2012 taxes: 59.5%
Here:
59%
State:
57%
(% for various income ranges: 53.3% for AGIs below $25k, 60.0% for AGIs $25k-50k, 54.5% for AGIs $50k-75k, 70.0% for AGIs $75k-100k, 75.0% for AGIs $100k-200k)
Averages for the 2004 tax year for zip code 61369, filed in 2005:
Average Adjusted Gross Income (AGI) in 2004: $39,239 (Individual Income Tax Returns)
Here:
$39,239
State:
$54,625
Salary/wage: $34,811 (reported on 82.6% of returns)
Here:
$34,811
State:
$46,811
(% of AGI for various income ranges: 96.0% for AGIs below $10k, 68.7% for AGIs $10k-25k, 72.3% for AGIs $25k-50k, 83.5% for AGIs $50k-75k, 76.1% for AGIs $75k-100k, 57.1% for AGIs over 100k)
Taxable interest for individuals: $2,141 (reported on 57.1% of returns)
This zip code:
$2,141
Illinois:
$2,101
(% of AGI for various income ranges: 8.5% for AGIs below $10k, 4.8% for AGIs $10k-25k, 3.4% for AGIs $25k-50k, 2.5% for AGIs $50k-75k, 2.7% for AGIs $75k-100k, 2.4% for AGIs over 100k)
Taxable dividends: $2,094 (reported on 27.8% of returns)
Here:
$2,094
State:
$4,306
(% of AGI for various income ranges: 5.0% for AGIs below $10k, 1.7% for AGIs $10k-25k, 0.9% for AGIs $25k-50k, 0.3% for AGIs $50k-75k, 2.1% for AGIs $75k-100k, 3.1% for AGIs over 100k)
Net capital gain/loss: +$1,381 (reported on 14.7% of returns)
Here:
+$1,381
State:
+$17,321
(% of AGI for various income ranges: 2.8% for AGIs below $10k, -0.3% for AGIs $10k-25k, 0.7% for AGIs $25k-50k, 0.1% for AGIs $50k-75k, 0.9% for AGIs $75k-100k, 0.9% for AGIs over 100k)
Profit/loss from business: +$4,500 (reported on 11.7% of returns)
Here:
+$4,500
State:
+$11,771
(% of AGI for various income ranges: 3.7% for AGIs below $10k, 1.4% for AGIs $10k-25k, 0.8% for AGIs $25k-50k, 0.4% for AGIs $50k-75k, 4.7% for AGIs $75k-100k)
Profit/loss from farming: +$8,467 (reported on 3.7% of returns)
Here:
+$8,467
State:
+$2,327
IRA payment deduction: $2,909 (reported on 2.7% of returns)
61369:
$2,909
Illinois:
$3,087
Total itemized deductions: $15,248 (22% of AGI, reported on 17.5% of returns)
Here:
$15,248
State:
$20,239
Here:
21.6% of AGI
State:
19.5% of AGI
(% of AGI for various income ranges: 13.7% for AGIs $10k-25k, 5.2% for AGIs $25k-50k, 6.4% for AGIs $50k-75k, 6.2% for AGIs $75k-100k, 6.7% for AGIs over 100k)
Charity contributions deductions: $2,376 (3% of AGI, reported on 13.5% of returns)
Here:
$2,376
State:
$3,719
Here:
3.0% of AGI
State:
3.4% of AGI
(% of AGI for various income ranges: 0.3% for AGIs $10k-25k, 0.7% for AGIs $25k-50k, 0.7% for AGIs $50k-75k, 0.8% for AGIs $75k-100k, 1.7% for AGIs over 100k)
Total tax: $5,092 (reported on 76.6% of returns)
61369:
$5,092
State:
$9,882
(% of AGI for various income ranges: 1.9% for AGIs below $10k, 4.3% for AGIs $10k-25k, 7.5% for AGIs $25k-50k, 8.3% for AGIs $50k-75k, 11.6% for AGIs $75k-100k, 18.9% for AGIs over 100k)
Earned income credit: $1,558 (reported on 10.7% of returns)
Here:
$1,558
State:
$1,788
Percentage of individuals using paid preparers for their 2004 taxes: 56.4%
Here:
56%
State:
61%
(% for various income ranges: 46.3% for AGIs below $10k, 54.5% for AGIs $10k-25k, 57.8% for AGIs $25k-50k, 65.0% for AGIs $50k-75k, 60.7% for AGIs $75k-100k, 60.0% for AGIs over 100k)
Household received Food Stamps/SNAP in the past 12 months: 99 Household did not receive Food Stamps/SNAP in the past 12 months: 529
Women who had a birth in the past 12 months: 23 (5 now married, 17 unmarried) Women who did not have a birth in the past 12 months: 182 (49 now married, 133 unmarried)
Housing units in zip code 61369 with a mortgage: 223 (14 second mortgage, 12 both second mortgage and home equity loan) Median monthly owner costs for units with a mortgage: $1,106 Median monthly owner costs for units without a mortgage: $541
Residents with income below the poverty level in 2022:
This zip code:
16.2%
Whole state:
11.9%
Residents with income below 50% of the poverty level in 2022:
This zip code:
10.8%
Whole state:
5.7%
Median number of rooms in houses and condos:
Here:
6.5
State:
6.4
Median number of rooms in apartments:
Here:
4.2
State:
4.1
Notable locations in this zip code not listed on our city pages
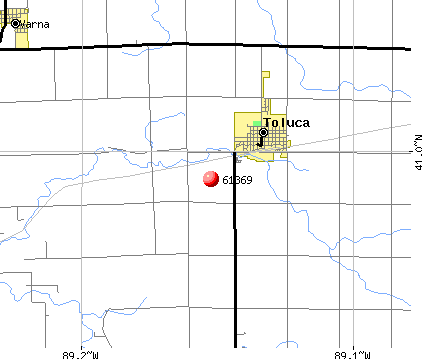
Notable locations in zip code 61369: Tall Oaks Country Club (A), Toluca City Hall (B), Toluca Fire Protection District (C). Display/hide their locations on the map
Churches in zip code 61369 include: Saint Anns Church (A), Saint Johns Lutheran Church (B), Antioch Christian Church (C). Display/hide their locations on the map
Cemeteries: Martin Cemetery (1), Saint Anns Cemetery (2), Saint Johns Cemetery (3), Antioch Cemetery (4), Bell Plain Baptist Cemetery (5). Display/hide their locations on the map
In group quarters: 93 (-1 institutionalized population)
Size of family households: 210 2-persons, 65 3-persons, 40 4-persons, 27 5-persons, 13 7-or-more-persons
Size of nonfamily households: 222 1-person, 47 2-persons, 4 4-persons
113 married couples with children.
127 single-parent households (72 men, 55 women).
91.7% of residents of 61369 zip code speak English at home.
8.6% of residents speak Spanish at home (53% very well, 30% well, 17% not well).
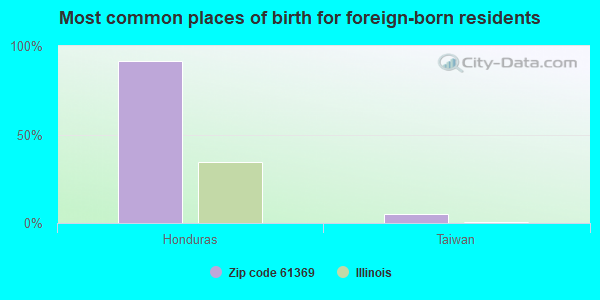
Foreign born population: 61 (4.4%) (28.0% of them are naturalized citizens)
This zip code:
4.4%
Whole state:
14.4%
92%Honduras
5%Taiwan
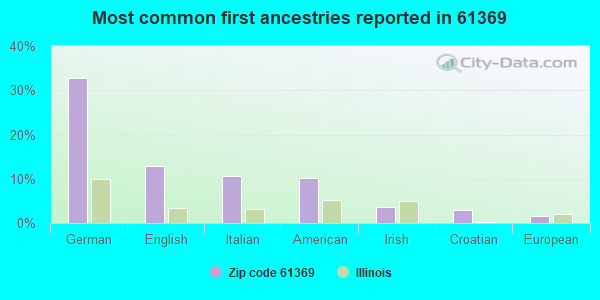
33%German
13%English
11%Italian
10%American
4%Irish
3%Croatian
2%European
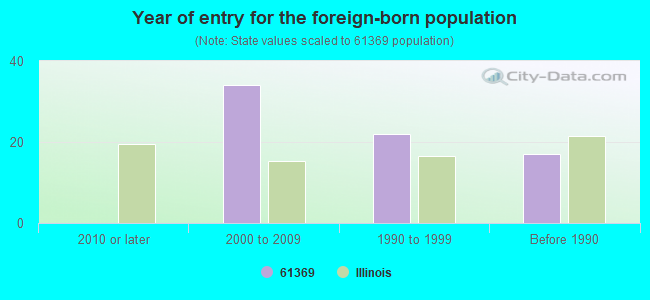
Year of entry for the foreign-born population
02010 or later
342000 to 2009
221990 to 1999
17Before 1990
Facilities with environmental interests located in this zip code:
ROANOKE CONCRETE PRODUCTS INC (424 E SANTA FE in TOLUCA, IL)
STATE MASTER (Illinois EPA Project) - AIR PROGRAM AIR MINOR (AIRS/AFS) CRITERIA AND HAZARDOUS AIR POLLUTANT INVENTORY (Inventory of air pollution sources) Business SIC classification: READY-MIXED CONCRETE Business NAICS classification: READY-MIX CONCRETE MANUFACTURING.
GRANDVIEW SERVICE CO (SANTA FE ROAD in TOLUCA, IL)
STATE MASTER (Illinois EPA Project) - AIR PROGRAM AIR MINOR (AIRS/AFS) Business SIC classification: FERTILIZERS, MIXING ONLY
RUFF BROTHERS GRAIN CO (2990 CR 500 N in TOLUCA, IL)
STATE MASTER (Illinois EPA Project) - AIR PROGRAM AIR MINOR (AIRS/AFS) Business SIC classification: GRAIN AND FIELD BEANS
MARSHALL PUTNAM OIL CO (RUTLAND RD in TOLUCA, IL)
(Resource Conservation and Recovery Act (tracking hazardous waste)) Organizations: MARSHALL PUTNAM OIL COMPANY (CONTACT/OWNER)
CUSAC STANDARD (219 N MAIN in TOLUCA, IL)
Small Quantity Generators, between 100 kg and 1000 kg of hazardous waste/month (Resource Conservation and Recovery Act (tracking hazardous waste)) - notification Organizations: MAIN OIL CO (CONTACT/OWNER)
Housing units lacking complete plumbing facilities: 4.9% Housing units lacking complete kitchen facilities: 5.8%
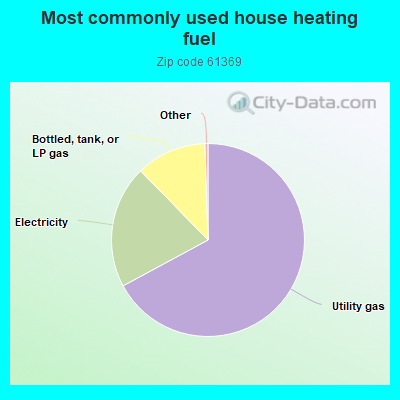
67.2%Utility gas
20.6%Electricity
11.8%Bottled, tank, or LP gas
Population in 1990: 1,755.
Place of birth for U.S.-born residents:
This state: 1,153
Northeast: 13
Midwest: 49
South: 43
West: 29
66% of the 61369 zip code residents lived in the same house 5 years ago. Out of people who lived in different houses, 55% lived in this county. Out of people who lived in different counties, 50% lived in Illinois.
90% of the 61369 zip code residents lived in the same house 1 year ago. Out of people who lived in different houses, 31% moved from this county. Out of people who lived in different houses, 67% moved from different county within same state. Out of people who lived in different houses, 4% moved from different state.
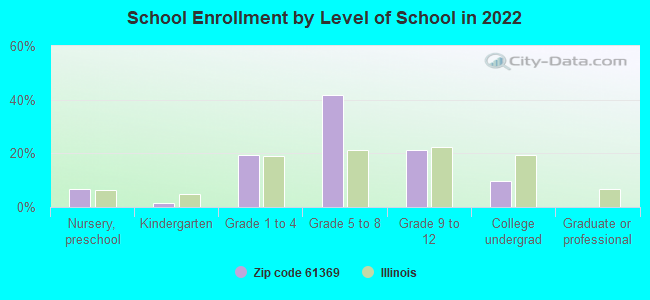
Private vs. public school enrollment:
Students in private schools in grades 1 to 8 (elementary and middle school): 12
Here:
9.5%
Illinois:
13.3%
Students in private schools in grades 9 to 12 (high school):
Here:
0.0%
Illinois:
9.9%
Students in private undergraduate colleges: 2
Here:
12.5%
Illinois:
27.4%
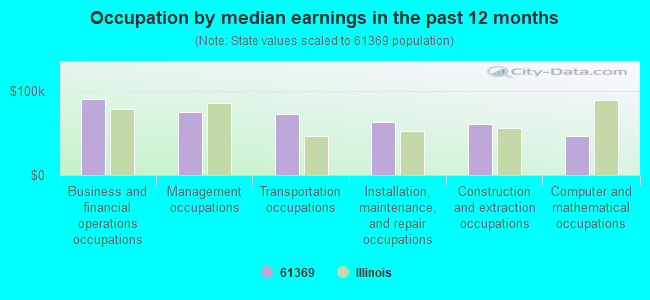
Occupation by median earnings in the past 12 months ($)
90,381Business and financial operations occupations
75,395Management occupations
72,538Transportation occupations
62,554Installation, maintenance, and repair occupations
61,191Construction and extraction occupations
46,511Computer and mathematical occupations
Top industries in this zip code by the number of employees in 2005:
Accommodation and Food Services: Full-Service Restaurants (50-99 employees: 2 establishments)
Health Care and Social Assistance: Nursing Care Facilities (50-99: 1)
Construction: Plumbing, Heating, and Air-Conditioning Contractors (10-19: 1, 5-9: 1)
Finance and Insurance: Commercial Banking (10-19: 1)
People in group quarters in 2010:
84 people in nursing facilities/skilled-nursing facilities
People in group quarters in 2000:
81 people in nursing homes
2002 - 2018 National Fire Incident Reporting System (NFIRS) incidents
According to the data from the years 2002 - 2018 the average number of fire incidents per year is 9. The highest number of reported fires - 17 took place in 2017, and the least - 2 in 2004. The data has a growing trend.
When looking into fire subcategories, the most reports belonged to: Structure Fires (43.9%), and Outside Fires (43.9%).
Fire incident types reported to NFIRS in Zip Code 61369

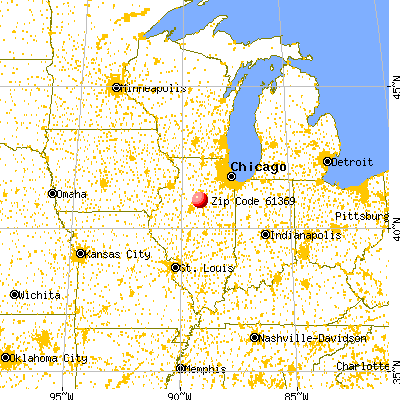


 Nearest zip codes: 61541, 61375, 61358, 61516, 61377, 61336.


 According to the data from the years 2002 - 2018 the average number of fire incidents per year is 9. The highest number of reported fires - 17 took place in 2017, and the least - 2 in 2004. The data has a growing trend.
 When looking into fire subcategories, the most reports belonged to: Structure Fires (43.9%), and Outside Fires (43.9%).