Estimated zip code population in 2022: 1,146 Zip code population in 2010: 986 Zip code population in 2000: 954
Houses and condos: 827 Renter-occupied apartments: 38
% of renters here:
8%
State:
33%
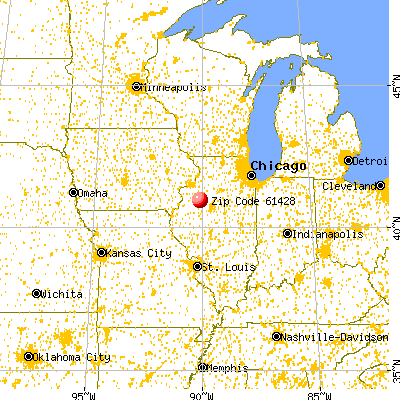
March 2022 cost of living index in zip code 61428: 85.0 (less than average, U.S. average is 100)
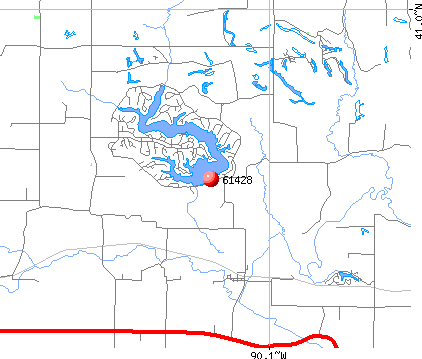
Land area: 32.9 sq. mi. Water area: 0.9 sq. mi.
Population density: 35 people per square mile
(very low).
OSM Map
General Map
Google Map
MSN Map
OSM Map
General Map
Google Map
MSN Map
OSM Map
General Map
Google Map
MSN Map
OSM Map
General Map
Google Map
MSN Map
Please wait while loading the map...
Real estate property taxes paid for housing units in 2022:
This zip code:
1.6% ($4,187)
Illinois:
2.0% ($4,912)
Median real estate property taxes paid for housing units with mortgages in 2022: $3,954 (1.7%) Median real estate property taxes paid for housing units with no mortgage in 2022: $4,327 (1.4%)
Business Search- 14 Million verified businesses
Males: 499
(43.6%)
Females: 646
(56.4%)
For population 25 years and over in 61428:
High school or higher: 95.6%
Bachelor's degree or higher: 27.7%
Graduate or professional degree: 13.9%
Unemployed: 2.0%
Mean travel time to work (commute): 28.9 minutes
For population 15 years and over in 61428:
Never married: 22.6%
Now married: 66.9%
Separated: 1.0%
Widowed: 3.8%
Divorced: 5.7%
Zip code 61428 compared to state average:
Unemployed percentage below state average.
Black race population percentage significantly below state average.
Hispanic race population percentage significantly below state average.
Median age significantly above state average.
Foreign-born population percentage significantly below state average.
Renting percentage significantly below state average.
Length of stay since moving in above state average.
Estimated median house/condo value in 2022: $256,861
61428:
$256,861
Illinois:
$251,600
Median resident age:
This zip code:
49.9 years
Illinois median age:
39.1 years
Average household size:
This zip code:
2.5 people
Illinois:
2.4 people
Averages for the 2020 tax year for zip code 61428, filed in 2021:
Average Adjusted Gross Income (AGI) in 2020: $94,993 (Individual Income Tax Returns)
Here:
$94,993
State:
$82,626
Salary/wage: $76,575 (reported on 77.2% of returns)
Here:
$76,575
State:
$66,640
(% of AGI for various income ranges: 971.1% for AGIs below $25k, 2958.8% for AGIs $25k-50k, 5668.3% for AGIs $50k-75k, 8148.0% for AGIs $75k-100k, 11328.0% for AGIs $100k-200k)
Taxable interest for individuals: $650 (reported on 49.1% of returns)
This zip code:
$650
Illinois:
$2,376
(% of AGI for various income ranges: 8.9% for AGIs below $25k, 20.0% for AGIs $25k-50k, 13.3% for AGIs $50k-75k, 52.0% for AGIs $75k-100k, 90.0% for AGIs $100k-200k)
Ordinary dividends: $4,181 (reported on 28.1% of returns)
Here:
$4,181
State:
$9,061
(% of AGI for various income ranges: 42.2% for AGIs below $25k, 103.8% for AGIs $25k-50k, 128.0% for AGIs $75k-100k, 240.0% for AGIs $100k-200k)
Net capital gain/loss in AGI: +$8,500 (reported on 24.6% of returns)
Here:
+$8,500
State:
+$31,684
(% of AGI for various income ranges: 42.2% for AGIs below $25k, 188.3% for AGIs $50k-75k, 601.0% for AGIs $100k-200k)
Profit/loss from business: +$20,425 (reported on 14.0% of returns)
Here:
+$20,425
State:
+$12,175
(% of AGI for various income ranges: 416.2% for AGIs $25k-50k, 1301.0% for AGIs $100k-200k)
Taxable individual retirement arrangement distribution: $22,844 (reported on 15.8% of returns)
61428:
$22,844
Illinois:
$21,613
(% of AGI for various income ranges: 225.6% for AGIs below $25k, 780.0% for AGIs $50k-75k, 1385.0% for AGIs $100k-200k)
Total itemized deductions: $24,720 (reported on 8.8% of returns)
Here:
$24,720
State:
$34,948
(% of AGI for various income ranges: 1236.0% for AGIs $100k-200k)
Charity contributions: $9,367 (reported on 5.3% of returns)
Here:
$9,367
State:
$13,122
(% of AGI for various income ranges: 281.0% for AGIs $100k-200k)
Taxes paid: $9,825 (reported on 7.0% of returns)
61428:
$9,825
State:
$8,563
(% of AGI for various income ranges: 393.0% for AGIs $100k-200k)
Earned income credit: $2,275 (reported on 7.0% of returns)
Here:
$2,275
State:
$2,311
(% of AGI for various income ranges: 101.1% for AGIs below $25k)
Percentage of individuals using paid preparers for their 2020 taxes: 94.7%
Here:
95%
State:
93%
(% for various income ranges: 91.7% for AGIs below $25k, 90.0% for AGIs $25k-50k, 88.9% for AGIs $50k-75k, 100.0% for AGIs $75k-100k, 100.0% for AGIs $100k-200k, 100.0% for AGIs over 200k)
Averages for the 2012 tax year for zip code 61428, filed in 2013:
Average Adjusted Gross Income (AGI) in 2012: $74,454 (Individual Income Tax Returns)
Here:
$74,454
State:
$68,058
Salary/wage: $55,400 (reported on 76.9% of returns)
Here:
$55,400
State:
$55,396
(% of AGI for various income ranges: 60.9% for AGIs below $25k, 61.9% for AGIs $25k-50k, 56.4% for AGIs $50k-75k, 69.5% for AGIs $75k-100k, 55.5% for AGIs $100k-200k, 49.4% for AGIs over 200k)
Taxable interest for individuals: $793 (reported on 57.7% of returns)
This zip code:
$793
Illinois:
$1,969
(% of AGI for various income ranges: 2.8% for AGIs below $25k, 0.5% for AGIs $25k-50k, 0.8% for AGIs $50k-75k, 0.9% for AGIs $75k-100k, 0.4% for AGIs $100k-200k, 0.3% for AGIs over 200k)
Ordinary dividends: $2,639 (reported on 34.6% of returns)
Here:
$2,639
State:
$7,786
(% of AGI for various income ranges: 6.7% for AGIs below $25k, 1.6% for AGIs $25k-50k, 1.1% for AGIs $50k-75k, 1.2% for AGIs $75k-100k, 0.8% for AGIs $100k-200k, 0.9% for AGIs over 200k)
Net capital gain/loss in AGI: +$4,550 (reported on 23.1% of returns)
Here:
+$4,550
State:
+$22,183
(% of AGI for various income ranges: 1.0% for AGIs $50k-75k, 1.5% for AGIs $100k-200k, 3.4% for AGIs over 200k)
Profit/loss from business: +$14,575 (reported on 15.4% of returns)
Here:
+$14,575
State:
+$12,903
(% of AGI for various income ranges: 6.5% for AGIs $25k-50k, 1.5% for AGIs $50k-75k, 7.2% for AGIs $100k-200k)
Taxable individual retirement arrangement distribution: $15,640 (reported on 19.2% of returns)
61428:
$15,640
Illinois:
$17,929
(% of AGI for various income ranges: 18.6% for AGIs below $25k, 8.1% for AGIs $50k-75k, 7.2% for AGIs $100k-200k)
Total itemized deductions: $24,214 (20% of AGI, reported on 40.4% of returns)
Here:
$24,214
State:
$26,433
Here:
19.5% of AGI
State:
19.2% of AGI
(% of AGI for various income ranges: 15.5% for AGIs $25k-50k, 12.9% for AGIs $50k-75k, 11.8% for AGIs $75k-100k, 13.9% for AGIs $100k-200k, 14.3% for AGIs over 200k)
Charity contributions: $4,400 (reported on 32.7% of returns)
Here:
$4,400
State:
$4,525
(% of AGI for various income ranges: 1.1% for AGIs $25k-50k, 1.6% for AGIs $50k-75k, 1.3% for AGIs $75k-100k, 2.6% for AGIs $100k-200k, 2.4% for AGIs over 200k)
Taxes paid: $10,767 (reported on 40.4% of returns)
61428:
$10,767
State:
$11,968
(% of AGI for various income ranges: 5.8% for AGIs $25k-50k, 5.1% for AGIs $50k-75k, 5.2% for AGIs $75k-100k, 6.7% for AGIs $100k-200k, 6.5% for AGIs over 200k)
Earned income credit: $2,025 (reported on 7.7% of returns)
Here:
$2,025
State:
$2,349
(% of AGI for various income ranges: 5.2% for AGIs below $25k)
Percentage of individuals using paid preparers for their 2012 taxes: 65.4%
Here:
65%
State:
57%
(% for various income ranges: 61.5% for AGIs below $25k, 60.0% for AGIs $25k-50k, 66.7% for AGIs $50k-75k, 62.5% for AGIs $75k-100k, 100.0% for AGIs $100k-200k)
Averages for the 2004 tax year for zip code 61428, filed in 2005:
Average Adjusted Gross Income (AGI) in 2004: $55,118 (Individual Income Tax Returns)
Here:
$55,118
State:
$54,625
Salary/wage: $44,086 (reported on 78.9% of returns)
Here:
$44,086
State:
$46,811
(% of AGI for various income ranges: 61.4% for AGIs below $10k, 57.6% for AGIs $10k-25k, 59.2% for AGIs $25k-50k, 73.6% for AGIs $50k-75k, 66.4% for AGIs $75k-100k, 57.8% for AGIs over 100k)
Taxable interest for individuals: $970 (reported on 64.1% of returns)
This zip code:
$970
Illinois:
$2,101
(% of AGI for various income ranges: 5.9% for AGIs below $10k, 3.7% for AGIs $10k-25k, 1.1% for AGIs $25k-50k, 0.6% for AGIs $50k-75k, 0.6% for AGIs $75k-100k, 1.1% for AGIs over 100k)
Taxable dividends: $2,415 (reported on 34.6% of returns)
Here:
$2,415
State:
$4,306
(% of AGI for various income ranges: 1.3% for AGIs $10k-25k, 1.3% for AGIs $25k-50k, 0.8% for AGIs $50k-75k, 1.5% for AGIs $75k-100k, 2.1% for AGIs over 100k)
Net capital gain/loss: +$3,705 (reported on 27.2% of returns)
Here:
+$3,705
State:
+$17,321
(% of AGI for various income ranges: -0.7% for AGIs $10k-25k, -0.1% for AGIs $25k-50k, 0.4% for AGIs $50k-75k, 0.3% for AGIs $75k-100k, 4.7% for AGIs over 100k)
Profit/loss from business: +$12,592 (reported on 16.0% of returns)
Here:
+$12,592
State:
+$11,771
(% of AGI for various income ranges: 21.4% for AGIs below $10k, 4.7% for AGIs $10k-25k, 6.0% for AGIs $25k-50k, 8.9% for AGIs $50k-75k)
IRA payment deduction: $2,929 (reported on 3.0% of returns)
61428:
$2,929
Illinois:
$3,087
Total itemized deductions: $17,879 (21% of AGI, reported on 36.7% of returns)
Here:
$17,879
State:
$20,239
Here:
20.5% of AGI
State:
19.5% of AGI
(% of AGI for various income ranges: 12.5% for AGIs $10k-25k, 14.0% for AGIs $25k-50k, 11.4% for AGIs $50k-75k, 9.0% for AGIs $75k-100k, 12.5% for AGIs over 100k)
Charity contributions deductions: $2,929 (3% of AGI, reported on 29.5% of returns)
Here:
$2,929
State:
$3,719
Here:
3.1% of AGI
State:
3.4% of AGI
(% of AGI for various income ranges: 4.5% for AGIs below $10k, 1.6% for AGIs $25k-50k, 1.2% for AGIs $50k-75k, 1.0% for AGIs $75k-100k, 2.2% for AGIs over 100k)
Total tax: $8,078 (reported on 84.2% of returns)
61428:
$8,078
State:
$9,882
(% of AGI for various income ranges: 5.0% for AGIs below $10k, 3.7% for AGIs $10k-25k, 7.2% for AGIs $25k-50k, 9.1% for AGIs $50k-75k, 11.4% for AGIs $75k-100k, 18.8% for AGIs over 100k)
Earned income credit: $1,439 (reported on 8.6% of returns)
Here:
$1,439
State:
$1,788
Percentage of individuals using paid preparers for their 2004 taxes: 65.2%
Here:
65%
State:
61%
(% for various income ranges: 58.3% for AGIs below $10k, 60.7% for AGIs $10k-25k, 65.6% for AGIs $25k-50k, 68.0% for AGIs $50k-75k, 65.9% for AGIs $75k-100k, 73.6% for AGIs over 100k)
Likely homosexual households (counted as self-reported same-sex unmarried-partner households)
Lesbian couples: 0.0% of all households
Gay men: 1.3% of all households
Household received Food Stamps/SNAP in the past 12 months: 24 Household did not receive Food Stamps/SNAP in the past 12 months: 431
Women who had a birth in the past 12 months: 11 (9 now married, 1 unmarried) Women who did not have a birth in the past 12 months: 200 (69 now married, 131 unmarried)
Housing units in zip code 61428 with a mortgage: 200 (15 second mortgage, 13 both second mortgage and home equity loan) Median monthly owner costs for units with a mortgage: $1,708 Median monthly owner costs for units without a mortgage: $801
Residents with income below the poverty level in 2022:
This zip code:
13.3%
Whole state:
11.9%
Residents with income below 50% of the poverty level in 2022:
This zip code:
5.6%
Whole state:
5.7%
Median number of rooms in houses and condos:
Here:
6.6
State:
6.4
Median number of rooms in apartments:
Here:
5.3
State:
4.1
Notable locations in this zip code not listed on our city pages
192 married couples with children.
53 single-parent households (38 men, 15 women).
97.0% of residents of 61428 zip code speak English at home.
1.9% of residents speak Spanish at home (48% very well, 52% well).
0.9% of residents speak other Indo-European language at home (70% very well, 30% not well).
Foreign born population: 7 (0.6%) (57.4% of them are naturalized citizens)
This zip code:
0.6%
Whole state:
14.4%
57%France
25%German
14%English
13%American
8%Irish
6%Swedish
5%Polish
4%Belgian
Year of entry for the foreign-born population
02010 or later
02000 to 2009
01990 to 1999
6Before 1990
Facilities with environmental interests located in this zip code:
OAK RUN CAMPERS VILLAGE (1470 KNOX ROAD, 1725 N in DAHINDA, IL)
STATE MASTER (Illinois EPA Project) - National Pollutant Discharge Elimination System Permit National Pollutant Discharge Elimination System NON-MAJOR (Tracking pollutant discharge elimination systems) - permit Business SIC classification: RECREATIONAL VEHICLE PARKS AND CAMPSITES Alternative names: OAK RUN CAMPERS VILLAGE STP
ILDOT BRG 048 0034 (APPLETON RD CH 12 OVER I 74 in DAHINDA, IL)
Large Quantity Generators, more that 1000 kg of hazardous waste/month (Resource Conservation and Recovery Act (tracking hazardous waste)) - notification
ILDOT BRG 048 0050 (SCOUT CAMP RD TR 235 OVER I 74 in DAHINDA, IL)
Large Quantity Generators, more that 1000 kg of hazardous waste/month (Resource Conservation and Recovery Act (tracking hazardous waste)) - notification
Housing units lacking complete plumbing facilities: 27.9% Housing units lacking complete kitchen facilities: 3.1%
69.5%Bottled, tank, or LP gas
12.2%Utility gas
12.0%Electricity
3.6%Other fuel
1.8%Wood
1.1%Solar energy
Population in 1990: 710. Population change in the 1990s: +244 (+34.4%).
Place of birth for U.S.-born residents:
This state: 889
Northeast: 3
Midwest: 184
South: 40
West: 18
54% of the 61428 zip code residents lived in the same house 5 years ago. Out of people who lived in different houses, 35% lived in this county. Out of people who lived in different counties, 50% lived in Illinois.
91% of the 61428 zip code residents lived in the same house 1 year ago. Out of people who lived in different houses, 15% moved from this county. Out of people who lived in different houses, 77% moved from different county within same state. Out of people who lived in different houses, 12% moved from different state.
Private vs. public school enrollment:
Students in private schools in grades 1 to 8 (elementary and middle school): 9
Here:
7.0%
Illinois:
13.3%
Students in private schools in grades 9 to 12 (high school):
Here:
0.0%
Illinois:
9.9%
Students in private undergraduate colleges: 6
Here:
27.5%
Illinois:
27.4%
Occupation by median earnings in the past 12 months ($)
167,346Installation, maintenance, and repair occupations
151,689Management occupations
95,501Sales and related occupations
73,823Health diagnosing and treating practitioners and other technical occupations
67,925Transportation occupations
64,079Education, training, and library occupations
Top industries in this zip code by the number of employees in 2005:
Accommodation and Food Services: Full-Service Restaurants (10-19 employees: 1 establishment)
Other Services (except Public Administration): Other Similar Organizations (except Business, Professional, Labor, and Political Organizations) (5-9: 1)
Accommodation and Food Services: Limited-Service Restaurants (5-9: 1)
Arts, Entertainment, and Recreation: Golf Courses and Country Clubs (5-9: 1)
Information: Data Processing, Hosting, and Related Services (1-4: 1)
Construction: Roofing Contractors (1-4: 1)
Mining: Construction Sand and Gravel Mining (1-4: 1)
Administrative and Support and Waste Management and Remediation Services: Janitorial Services (1-4: 1)
2002 - 2018 National Fire Incident Reporting System (NFIRS) incidents
Based on the data from the years 2002 - 2018 the average number of fires per year is 7. The highest number of fires - 15 took place in 2009, and the least - 0 in 2010. The data has a growing trend.
When looking into fire subcategories, the most incidents belonged to: Outside Fires (69.2%), and Structure Fires (22.2%).
Fire incident types reported to NFIRS in Zip Code 61428


 Nearest zip codes: 61489, 61485, 61448, 61436, 61572, 61451.


 Based on the data from the years 2002 - 2018 the average number of fires per year is 7. The highest number of fires - 15 took place in 2009, and the least - 0 in 2010. The data has a growing trend.
 When looking into fire subcategories, the most incidents belonged to: Outside Fires (69.2%), and Structure Fires (22.2%).