Estimated zip code population in 2022: 1,413 Zip code population in 2010: 1,504 Zip code population in 2000: 1,676
Houses and condos: 660 Renter-occupied apartments: 112
% of renters here:
18%
State:
33%
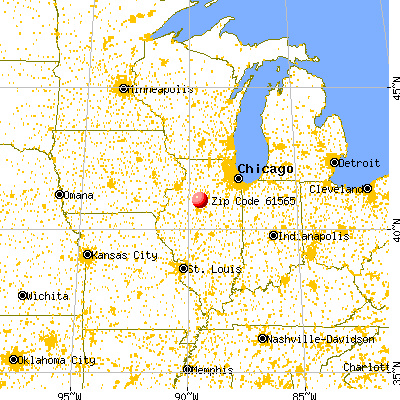
March 2022 cost of living index in zip code 61565: 84.0 (less than average, U.S. average is 100)
Land area: 65.9 sq. mi. Water area: 3.4 sq. mi.
Population density: 21 people per square mile
(very low).
OSM Map
General Map
Google Map
MSN Map
OSM Map
General Map
Google Map
MSN Map
OSM Map
General Map
Google Map
MSN Map
OSM Map
General Map
Google Map
MSN Map
Please wait while loading the map...
Real estate property taxes paid for housing units in 2022:
This zip code:
1.9% ($3,136)
Illinois:
2.0% ($4,912)
Median real estate property taxes paid for housing units with mortgages in 2022: $3,253 (2.0%) Median real estate property taxes paid for housing units with no mortgage in 2022: $2,927 (1.9%)
Business Search- 14 Million verified businesses
Males: 754
(53.4%)
Females: 658
(46.6%)
For population 25 years and over in 61565:
High school or higher: 92.9%
Bachelor's degree or higher: 21.1%
Graduate or professional degree: 6.5%
Unemployed: 1.9%
Mean travel time to work (commute): 21.5 minutes
For population 15 years and over in 61565:
Never married: 24.9%
Now married: 61.0%
Separated: 1.0%
Widowed: 4.3%
Divorced: 8.9%
Zip code 61565 compared to state average:
Median house value below state average.
Unemployed percentage below state average.
Black race population percentage significantly below state average.
Hispanic race population percentage significantly below state average.
Foreign-born population percentage significantly below state average.
Renting percentage below state average.
Length of stay since moving in significantly above state average.
Number of college students below state average.
Percentage of population with a bachelor's degree or higher below state average.
Averages for the 2020 tax year for zip code 61565, filed in 2021:
Average Adjusted Gross Income (AGI) in 2020: $69,353 (Individual Income Tax Returns)
Here:
$69,353
State:
$82,626
Salary/wage: $53,017 (reported on 77.9% of returns)
Here:
$53,017
State:
$66,640
(% of AGI for various income ranges: 1119.3% for AGIs below $25k, 3010.0% for AGIs $25k-50k, 5221.4% for AGIs $50k-75k, 9094.0% for AGIs $75k-100k, 13125.0% for AGIs $100k-200k)
Taxable interest for individuals: $659 (reported on 54.4% of returns)
This zip code:
$659
Illinois:
$2,376
(% of AGI for various income ranges: 22.1% for AGIs below $25k, 20.0% for AGIs $25k-50k, 41.4% for AGIs $50k-75k, 84.0% for AGIs $75k-100k, 137.5% for AGIs $100k-200k)
Ordinary dividends: $3,806 (reported on 23.5% of returns)
Here:
$3,806
State:
$9,061
(% of AGI for various income ranges: 57.1% for AGIs below $25k, 88.6% for AGIs $50k-75k, 114.0% for AGIs $75k-100k, 512.5% for AGIs $100k-200k)
Net capital gain/loss in AGI: +$7,308 (reported on 19.1% of returns)
Here:
+$7,308
State:
+$31,684
(% of AGI for various income ranges: 26.4% for AGIs below $25k, 112.9% for AGIs $50k-75k, 1042.5% for AGIs $100k-200k)
Profit/loss from business: +$7,333 (reported on 13.2% of returns)
Here:
+$7,333
State:
+$12,175
(% of AGI for various income ranges: 121.4% for AGIs below $25k, 331.7% for AGIs $25k-50k, 184.0% for AGIs $75k-100k)
Taxable individual retirement arrangement distribution: $15,483 (reported on 8.8% of returns)
61565:
$15,483
Illinois:
$21,613
(% of AGI for various income ranges: 380.0% for AGIs $25k-50k, 946.0% for AGIs $75k-100k)
Total itemized deductions: $27,200 (reported on 2.9% of returns)
Here:
$27,200
State:
$34,948
(% of AGI for various income ranges: 453.3% for AGIs $25k-50k)
Taxes paid: $7,950 (reported on 2.9% of returns)
61565:
$7,950
State:
$8,563
(% of AGI for various income ranges: 132.5% for AGIs $25k-50k)
Earned income credit: $2,388 (reported on 11.8% of returns)
Here:
$2,388
State:
$2,311
(% of AGI for various income ranges: 78.6% for AGIs below $25k, 67.5% for AGIs $25k-50k)
Percentage of individuals using paid preparers for their 2020 taxes: 94.1%
Here:
94%
State:
93%
(% for various income ranges: 90.5% for AGIs below $25k, 93.3% for AGIs $25k-50k, 90.0% for AGIs $50k-75k, 100.0% for AGIs $75k-100k, 100.0% for AGIs $100k-200k, 100.0% for AGIs over 200k)
Averages for the 2012 tax year for zip code 61565, filed in 2013:
Average Adjusted Gross Income (AGI) in 2012: $59,670 (Individual Income Tax Returns)
Here:
$59,670
State:
$68,058
Salary/wage: $45,772 (reported on 84.5% of returns)
Here:
$45,772
State:
$55,396
(% of AGI for various income ranges: 68.2% for AGIs below $25k, 68.3% for AGIs $25k-50k, 64.0% for AGIs $50k-75k, 76.6% for AGIs $75k-100k, 69.5% for AGIs $100k-200k, 44.5% for AGIs over 200k)
Taxable interest for individuals: $708 (reported on 56.3% of returns)
This zip code:
$708
Illinois:
$1,969
(% of AGI for various income ranges: 1.7% for AGIs below $25k, 1.2% for AGIs $25k-50k, 0.7% for AGIs $50k-75k, 0.3% for AGIs $75k-100k, 0.5% for AGIs $100k-200k, 0.4% for AGIs over 200k)
Ordinary dividends: $1,884 (reported on 26.8% of returns)
Here:
$1,884
State:
$7,786
(% of AGI for various income ranges: 1.8% for AGIs below $25k, 1.0% for AGIs $25k-50k, 0.9% for AGIs $50k-75k, 0.4% for AGIs $75k-100k, 1.3% for AGIs $100k-200k)
Net capital gain/loss in AGI: +$1,492 (reported on 16.9% of returns)
Here:
+$1,492
State:
+$22,183
(% of AGI for various income ranges: 1.6% for AGIs $100k-200k)
Profit/loss from business: +$3,844 (reported on 12.7% of returns)
Here:
+$3,844
State:
+$12,903
(% of AGI for various income ranges: 2.9% for AGIs below $25k, 2.4% for AGIs $25k-50k, 2.0% for AGIs $75k-100k)
Taxable individual retirement arrangement distribution: $6,775 (reported on 11.3% of returns)
61565:
$6,775
Illinois:
$17,929
(% of AGI for various income ranges: 5.9% for AGIs below $25k, 5.1% for AGIs $50k-75k)
Total itemized deductions: $18,700 (16% of AGI, reported on 26.8% of returns)
Here:
$18,700
State:
$26,433
Here:
16.3% of AGI
State:
19.2% of AGI
(% of AGI for various income ranges: 10.1% for AGIs $25k-50k, 7.3% for AGIs $50k-75k, 9.9% for AGIs $75k-100k, 9.6% for AGIs $100k-200k, 8.2% for AGIs over 200k)
Charity contributions: $3,536 (reported on 19.7% of returns)
Here:
$3,536
State:
$4,525
(% of AGI for various income ranges: 1.3% for AGIs $25k-50k, 1.1% for AGIs $75k-100k, 1.8% for AGIs $100k-200k, 1.7% for AGIs over 200k)
Taxes paid: $8,695 (reported on 26.8% of returns)
61565:
$8,695
State:
$11,968
(% of AGI for various income ranges: 3.2% for AGIs $25k-50k, 3.0% for AGIs $50k-75k, 4.2% for AGIs $75k-100k, 4.6% for AGIs $100k-200k, 5.2% for AGIs over 200k)
Earned income credit: $2,000 (reported on 12.7% of returns)
Here:
$2,000
State:
$2,349
(% of AGI for various income ranges: 4.6% for AGIs below $25k, 0.9% for AGIs $25k-50k)
Percentage of individuals using paid preparers for their 2012 taxes: 57.7%
Here:
58%
State:
57%
(% for various income ranges: 53.8% for AGIs below $25k, 57.1% for AGIs $25k-50k, 58.3% for AGIs $50k-75k, 62.5% for AGIs $75k-100k, 77.8% for AGIs $100k-200k)
Averages for the 2004 tax year for zip code 61565, filed in 2005:
Average Adjusted Gross Income (AGI) in 2004: $44,756 (Individual Income Tax Returns)
Here:
$44,756
State:
$54,625
Salary/wage: $38,758 (reported on 86.1% of returns)
Here:
$38,758
State:
$46,811
(% of AGI for various income ranges: 71.2% for AGIs below $10k, 67.7% for AGIs $10k-25k, 68.9% for AGIs $25k-50k, 76.2% for AGIs $50k-75k, 77.2% for AGIs $75k-100k, 77.5% for AGIs over 100k)
Taxable interest for individuals: $1,026 (reported on 59.7% of returns)
This zip code:
$1,026
Illinois:
$2,101
(% of AGI for various income ranges: 5.6% for AGIs below $10k, 3.2% for AGIs $10k-25k, 1.7% for AGIs $25k-50k, 1.6% for AGIs $50k-75k, 0.7% for AGIs $75k-100k, 0.5% for AGIs over 100k)
Taxable dividends: $1,768 (reported on 25.1% of returns)
Here:
$1,768
State:
$4,306
(% of AGI for various income ranges: 0.7% for AGIs below $10k, 1.2% for AGIs $10k-25k, 0.7% for AGIs $25k-50k, 2.2% for AGIs $50k-75k, 0.4% for AGIs $75k-100k, 0.3% for AGIs over 100k)
Net capital gain/loss: +$2,066 (reported on 16.9% of returns)
Here:
+$2,066
State:
+$17,321
(% of AGI for various income ranges: -1.6% for AGIs below $10k, 0.2% for AGIs $10k-25k, 0.3% for AGIs $25k-50k, 0.5% for AGIs $50k-75k, 0.6% for AGIs $75k-100k, 2.5% for AGIs over 100k)
Profit/loss from business: +$5,925 (reported on 9.3% of returns)
Here:
+$5,925
State:
+$11,771
Profit/loss from farming: +$12,167 (reported on 9.2% of returns)
Here:
+$12,167
State:
+$2,327
IRA payment deduction: $2,571 (reported on 1.9% of returns)
61565:
$2,571
Illinois:
$3,087
Total itemized deductions: $14,934 (20% of AGI, reported on 25.3% of returns)
Here:
$14,934
State:
$20,239
Here:
20.2% of AGI
State:
19.5% of AGI
(% of AGI for various income ranges: 31.6% for AGIs below $10k, 7.1% for AGIs $25k-50k, 9.0% for AGIs $50k-75k, 8.4% for AGIs $75k-100k, 10.2% for AGIs over 100k)
Charity contributions deductions: $2,660 (3% of AGI, reported on 20.0% of returns)
Here:
$2,660
State:
$3,719
Here:
3.4% of AGI
State:
3.4% of AGI
(% of AGI for various income ranges: 0.8% for AGIs $25k-50k, 1.2% for AGIs $50k-75k, 1.2% for AGIs $75k-100k, 2.1% for AGIs over 100k)
Total tax: $5,742 (reported on 80.3% of returns)
61565:
$5,742
State:
$9,882
(% of AGI for various income ranges: 2.3% for AGIs below $10k, 4.3% for AGIs $10k-25k, 7.0% for AGIs $25k-50k, 8.7% for AGIs $50k-75k, 12.0% for AGIs $75k-100k, 17.0% for AGIs over 100k)
Earned income credit: $1,556 (reported on 10.0% of returns)
Here:
$1,556
State:
$1,788
Percentage of individuals using paid preparers for their 2004 taxes: 59.4%
Here:
59%
State:
61%
(% for various income ranges: 44.6% for AGIs below $10k, 58.0% for AGIs $10k-25k, 71.0% for AGIs $25k-50k, 58.5% for AGIs $50k-75k, 65.3% for AGIs $75k-100k, 53.5% for AGIs over 100k)
Household received Food Stamps/SNAP in the past 12 months: 75 Household did not receive Food Stamps/SNAP in the past 12 months: 547
Women who had a birth in the past 12 months: 9 (4 now married, 4 unmarried) Women who did not have a birth in the past 12 months: 248 (148 now married, 97 unmarried)
Housing units in zip code 61565 with a mortgage: 271 (50 second mortgage, 36 both second mortgage and home equity loan) Houses without a mortgage: 3
Median monthly owner costs for units with a mortgage: $1,221 Median monthly owner costs for units without a mortgage: $540
Residents with income below the poverty level in 2022:
This zip code:
8.7%
Whole state:
11.9%
Residents with income below 50% of the poverty level in 2022:
This zip code:
3.5%
Whole state:
5.7%
Median number of rooms in houses and condos:
Here:
6.2
State:
6.4
Median number of rooms in apartments:
Here:
5.5
State:
4.1
Notable locations in this zip code not listed on our city pages
Notable locations in zip code 61565: La Prairie Center (A), Lacon - Sparland Fire Protection District Station 2 (B). Display/hide their locations on the map
Size of family households: 218 2-persons, 45 3-persons, 75 4-persons, 32 5-persons, 9 6-persons, 17 7-or-more-persons
Size of nonfamily households: 183 1-person, 41 2-persons, 2 3-persons
234 married couples with children.
55 single-parent households (36 men, 19 women).
96.2% of residents of 61565 zip code speak English at home.
2.1% of residents speak Spanish at home (72% very well, 28% well).
1.3% of residents speak other Indo-European language at home (100% very well).
Foreign born population: 4 (0.3%) (50.2% of them are naturalized citizens)
This zip code:
0.3%
Whole state:
14.4%
25%Honduras
29%American
27%German
12%English
8%Irish
5%Scottish
3%Italian
2%European
Year of entry for the foreign-born population
22010 or later
02000 to 2009
01990 to 1999
5Before 1990
Facilities with environmental interests located in this zip code:
HOPEWELL WTP (#1 WATERTOWER PLAZA in SPARLAND, IL)
STATE MASTER (Illinois EPA Project) - National Pollutant Discharge Elimination System Permit National Pollutant Discharge Elimination System NON-MAJOR (Tracking pollutant discharge elimination systems) - permit Business SIC classification: WATER SUPPLY Alternative names: HOPEWELL WTP, VILLAGE OF
PRICE DISPOSAL CO (RR 2 BOX 12A in SPARLAND, IL)
STATE MASTER (Illinois EPA Project) - AIR PROGRAM AIR MINOR (AIRS/AFS) Business SIC classification: REFUSE SYSTEMS
MIDLAND JR HIGH SCHOOL (901 HILLTOP DR in SPARLAND, IL)
(National Center for Education Statistics) - STATE ID-4305900701001 Organizations: MIDLAND COMMUNITY UNIT DIST 7 (SCHOOL DISTRICT)
AG VIEW FS INC. (751 COUNTY ROAD 600 E in SPARLAND, IL)
ENFORCEMENT/COMPLIANCE ACTIVITY (Integrated Compliance Information System)
Housing units lacking complete plumbing facilities: 3.6% Housing units lacking complete kitchen facilities: 1.0%
47.7%Bottled, tank, or LP gas
26.6%Utility gas
20.6%Electricity
3.3%Wood
1.0%No fuel used
0.7%Fuel oil, kerosene, etc.
Population in 1990: 1,190. Population change in the 1990s: +486 (+40.8%).
Place of birth for U.S.-born residents:
This state: 1,239
Northeast: 16
Midwest: 86
South: 40
West: 16
70% of the 61565 zip code residents lived in the same house 5 years ago. Out of people who lived in different houses, 39% lived in this county. Out of people who lived in different counties, 50% lived in Illinois.
92% of the 61565 zip code residents lived in the same house 1 year ago. Out of people who lived in different houses, 62% moved from this county. Out of people who lived in different houses, 22% moved from different county within same state. Out of people who lived in different houses, 5% moved from different state. Out of people who lived in different houses, 9% moved from abroad.
Private vs. public school enrollment:
Students in private schools in grades 1 to 8 (elementary and middle school): 44
Here:
22.7%
Illinois:
13.3%
Students in private schools in grades 9 to 12 (high school):
Here:
1.2%
Illinois:
9.9%
Students in private undergraduate colleges: 7
Here:
25.5%
Illinois:
27.4%
Occupation by median earnings in the past 12 months ($)
89,662Architecture and engineering occupations
89,325Business and financial operations occupations
87,782Management occupations
67,032Health diagnosing and treating practitioners and other technical occupations
57,052Sales and related occupations
55,683Installation, maintenance, and repair occupations
Top industries in this zip code by the number of employees in 2005:
Wholesale Trade: Grain and Field Bean Merchant Wholesalers (5-9: 1)
Professional, Scientific, and Technical Services: Landscape Architectural Services (1-4: 1)
Professional, Scientific, and Technical Services: Building Inspection Services (1-4: 1)
Construction: New Single-Family Housing Construction (except Operative Builders) (1-4: 1)
Fatal accident statistics in 2012:
Fatal accident count: 1
Vehicles involved in fatal accidents: 2
Fatal accidents caused by drunken drivers: 0
Fatalities: 1
Persons involved in fatal accidents: 2
Pedestrians involved in fatal accidents: 0
Fatal accident statistics in 2011:
Fatal accident count: 1
Vehicles involved in fatal accidents: 1
Fatal accidents caused by drunken drivers: 1
Fatalities: 1
Persons involved in fatal accidents: 1
Pedestrians involved in fatal accidents: 0
2002 - 2018 National Fire Incident Reporting System (NFIRS) incidents
According to the data from the years 2002 - 2018 the average number of fire incidents per year is 6. The highest number of fires - 16 took place in 2003, and the least - 0 in 2004. The data has an increasing trend.
When looking into fire subcategories, the most incidents belonged to: Outside Fires (53.8%), and Structure Fires (24.0%).
Fire incident types reported to NFIRS in Zip Code 61565


 Nearest zip codes: 61537, 61523, 61424, 61540, 61479, 61562.


 According to the data from the years 2002 - 2018 the average number of fire incidents per year is 6. The highest number of fires - 16 took place in 2003, and the least - 0 in 2004. The data has an increasing trend.
 When looking into fire subcategories, the most incidents belonged to: Outside Fires (53.8%), and Structure Fires (24.0%).