Estimated zip code population in 2022: 996 Zip code population in 2010: 1,220 Zip code population in 2000: 1,215
Houses and condos: 429 Renter-occupied apartments: 39
% of renters here:
9%
State:
33%
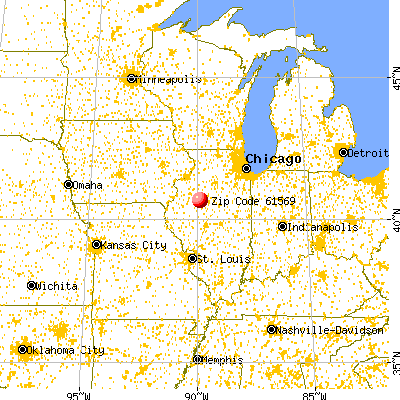
March 2022 cost of living index in zip code 61569: 85.0 (less than average, U.S. average is 100)
Land area: 39.4 sq. mi. Water area: 0.3 sq. mi.
Population density: 25 people per square mile
(very low).
OSM Map
General Map
Google Map
MSN Map
OSM Map
General Map
Google Map
MSN Map
OSM Map
General Map
Google Map
MSN Map
OSM Map
General Map
Google Map
MSN Map
Please wait while loading the map...
Real estate property taxes paid for housing units in 2022:
This zip code:
1.8% ($3,538)
Illinois:
2.0% ($4,912)
Median real estate property taxes paid for housing units with mortgages in 2022: $3,915 (1.9%) Median real estate property taxes paid for housing units with no mortgage in 2022: $3,231 (1.8%)
Business Search- 14 Million verified businesses
Males: 441
(44.3%)
Females: 554
(55.7%)
For population 25 years and over in 61569:
High school or higher: 96.6%
Bachelor's degree or higher: 37.7%
Graduate or professional degree: 8.5%
Unemployed: 1.2%
Mean travel time to work (commute): 27.6 minutes
For population 15 years and over in 61569:
Never married: 16.7%
Now married: 71.8%
Separated: 0.0%
Widowed: 3.2%
Divorced: 8.3%
Zip code 61569 compared to state average:
Unemployed percentage significantly below state average.
Black race population percentage significantly below state average.
Hispanic race population percentage significantly below state average.
Foreign-born population percentage significantly below state average.
Renting percentage significantly below state average.
Length of stay since moving in significantly above state average.
Estimated median house/condo value in 2022: $193,093
61569:
$193,093
Illinois:
$251,600
According to our research of Illinois and other state lists, there was 1 registered sex offender living in 61569 zip code as of May 28, 2024. The ratio of all residents to sex offenders in zip code 61569 is 1,146 to 1. The ratio of registered sex offenders to all residents in this zip code is lower than the state average.
Median resident age:
This zip code:
40.9 years
Illinois median age:
39.1 years
Average household size:
This zip code:
2.3 people
Illinois:
2.4 people
Averages for the 2020 tax year for zip code 61569, filed in 2021:
Average Adjusted Gross Income (AGI) in 2020: $79,347 (Individual Income Tax Returns)
Here:
$79,347
State:
$82,626
Salary/wage: $65,240 (reported on 77.6% of returns)
Here:
$65,240
State:
$66,640
(% of AGI for various income ranges: 883.3% for AGIs below $25k, 3104.4% for AGIs $25k-50k, 5926.7% for AGIs $50k-75k, 8922.0% for AGIs $75k-100k, 13528.9% for AGIs $100k-200k)
Taxable interest for individuals: $1,483 (reported on 62.1% of returns)
This zip code:
$1,483
Illinois:
$2,376
(% of AGI for various income ranges: 47.8% for AGIs below $25k, 70.0% for AGIs $25k-50k, 83.3% for AGIs $50k-75k, 140.0% for AGIs $75k-100k, 78.9% for AGIs $100k-200k)
Ordinary dividends: $3,362 (reported on 22.4% of returns)
Here:
$3,362
State:
$9,061
(% of AGI for various income ranges: 86.7% for AGIs $25k-50k, 60.0% for AGIs $50k-75k, 122.0% for AGIs $75k-100k, 291.1% for AGIs $100k-200k)
Net capital gain/loss in AGI: +$5,433 (reported on 20.7% of returns)
Here:
+$5,433
State:
+$31,684
(% of AGI for various income ranges: 57.8% for AGIs $25k-50k, 124.0% for AGIs $75k-100k, 597.8% for AGIs $100k-200k)
Profit/loss from business: +$4,586 (reported on 12.1% of returns)
Here:
+$4,586
State:
+$12,175
(% of AGI for various income ranges: 140.0% for AGIs below $25k, 153.3% for AGIs $50k-75k, 114.4% for AGIs $100k-200k)
Taxable individual retirement arrangement distribution: $11,900 (reported on 10.3% of returns)
61569:
$11,900
Illinois:
$21,613
(% of AGI for various income ranges: 445.6% for AGIs $25k-50k, 347.8% for AGIs $100k-200k)
Total itemized deductions: $27,133 (reported on 5.2% of returns)
Here:
$27,133
State:
$34,948
(% of AGI for various income ranges: 904.4% for AGIs $100k-200k)
Charity contributions: $9,150 (reported on 3.4% of returns)
Here:
$9,150
State:
$13,122
(% of AGI for various income ranges: 366.0% for AGIs $75k-100k)
Taxes paid: $8,767 (reported on 5.2% of returns)
61569:
$8,767
State:
$8,563
(% of AGI for various income ranges: 292.2% for AGIs $100k-200k)
Earned income credit: $2,100 (reported on 6.9% of returns)
Here:
$2,100
State:
$2,311
(% of AGI for various income ranges: 93.3% for AGIs below $25k)
Percentage of individuals using paid preparers for their 2020 taxes: 93.1%
Here:
93%
State:
93%
(% for various income ranges: 85.7% for AGIs below $25k, 91.7% for AGIs $25k-50k, 88.9% for AGIs $50k-75k, 100.0% for AGIs $75k-100k, 100.0% for AGIs $100k-200k, 100.0% for AGIs over 200k)
Averages for the 2012 tax year for zip code 61569, filed in 2013:
Average Adjusted Gross Income (AGI) in 2012: $61,218 (Individual Income Tax Returns)
Here:
$61,218
State:
$68,058
Salary/wage: $51,678 (reported on 80.3% of returns)
Here:
$51,678
State:
$55,396
(% of AGI for various income ranges: 64.7% for AGIs below $25k, 69.7% for AGIs $25k-50k, 66.0% for AGIs $50k-75k, 72.7% for AGIs $75k-100k, 65.9% for AGIs $100k-200k)
Taxable interest for individuals: $1,281 (reported on 60.7% of returns)
This zip code:
$1,281
Illinois:
$1,969
(% of AGI for various income ranges: 3.2% for AGIs below $25k, 1.2% for AGIs $25k-50k, 1.3% for AGIs $50k-75k, 0.5% for AGIs $75k-100k, 1.4% for AGIs $100k-200k)
Ordinary dividends: $2,908 (reported on 21.3% of returns)
Here:
$2,908
State:
$7,786
(% of AGI for various income ranges: 2.9% for AGIs $25k-50k, 1.9% for AGIs $50k-75k, 0.8% for AGIs $100k-200k)
Net capital gain/loss in AGI: +$173 (reported on 18.0% of returns)
Here:
+$173
State:
+$22,183
(% of AGI for various income ranges: 0.2% for AGIs $25k-50k)
Profit/loss from business: +$1,786 (reported on 11.5% of returns)
Here:
+$1,786
State:
+$12,903
Taxable individual retirement arrangement distribution: $13,678 (reported on 14.8% of returns)
61569:
$13,678
Illinois:
$17,929
(% of AGI for various income ranges: 14.2% for AGIs below $25k, 5.2% for AGIs $50k-75k, 3.7% for AGIs $100k-200k)
Total itemized deductions: $19,586 (20% of AGI, reported on 34.4% of returns)
Here:
$19,586
State:
$26,433
Here:
19.5% of AGI
State:
19.2% of AGI
(% of AGI for various income ranges: 11.5% for AGIs $25k-50k, 9.0% for AGIs $50k-75k, 10.5% for AGIs $75k-100k, 13.5% for AGIs $100k-200k)
Charity contributions: $2,600 (reported on 23.0% of returns)
Here:
$2,600
State:
$4,525
(% of AGI for various income ranges: 1.0% for AGIs below $25k, 0.9% for AGIs $50k-75k, 1.0% for AGIs $75k-100k, 1.3% for AGIs $100k-200k)
Taxes paid: $8,567 (reported on 34.4% of returns)
61569:
$8,567
State:
$11,968
(% of AGI for various income ranges: 3.5% for AGIs $25k-50k, 3.7% for AGIs $50k-75k, 4.6% for AGIs $75k-100k, 6.5% for AGIs $100k-200k)
Earned income credit: $2,083 (reported on 9.8% of returns)
Here:
$2,083
State:
$2,349
(% of AGI for various income ranges: 3.7% for AGIs below $25k, 1.0% for AGIs $25k-50k)
Percentage of individuals using paid preparers for their 2012 taxes: 57.4%
Here:
57%
State:
57%
(% for various income ranges: 47.1% for AGIs below $25k, 61.5% for AGIs $25k-50k, 63.6% for AGIs $50k-75k, 60.0% for AGIs $75k-100k, 60.0% for AGIs $100k-200k)
Averages for the 2004 tax year for zip code 61569, filed in 2005:
Average Adjusted Gross Income (AGI) in 2004: $49,884 (Individual Income Tax Returns)
Here:
$49,884
State:
$54,625
Salary/wage: $43,104 (reported on 80.0% of returns)
Here:
$43,104
State:
$46,811
(% of AGI for various income ranges: 97.4% for AGIs below $10k, 56.6% for AGIs $10k-25k, 65.0% for AGIs $25k-50k, 77.3% for AGIs $50k-75k, 85.4% for AGIs $75k-100k, 53.1% for AGIs over 100k)
Taxable interest for individuals: $2,417 (reported on 65.5% of returns)
This zip code:
$2,417
Illinois:
$2,101
(% of AGI for various income ranges: 6.9% for AGIs below $10k, 7.6% for AGIs $10k-25k, 3.2% for AGIs $25k-50k, 2.2% for AGIs $50k-75k, 0.7% for AGIs $75k-100k, 4.7% for AGIs over 100k)
Taxable dividends: $1,671 (reported on 29.0% of returns)
Here:
$1,671
State:
$4,306
(% of AGI for various income ranges: 1.6% for AGIs $10k-25k, 2.0% for AGIs $25k-50k, 0.4% for AGIs $50k-75k, 0.5% for AGIs $75k-100k, 1.0% for AGIs over 100k)
Net capital gain/loss: +$2,783 (reported on 22.0% of returns)
Here:
+$2,783
State:
+$17,321
(% of AGI for various income ranges: 3.6% for AGIs $10k-25k, -0.1% for AGIs $25k-50k, 0.6% for AGIs $50k-75k, 2.8% for AGIs $75k-100k, 0.8% for AGIs over 100k)
Profit/loss from business: +$1,556 (reported on 12.3% of returns)
Here:
+$1,556
State:
+$11,771
(% of AGI for various income ranges: 3.5% for AGIs $10k-25k, -0.8% for AGIs $25k-50k, 0.8% for AGIs $50k-75k, 0.5% for AGIs $75k-100k)
Total itemized deductions: $15,780 (19% of AGI, reported on 28.7% of returns)
Here:
$15,780
State:
$20,239
Here:
19.1% of AGI
State:
19.5% of AGI
(% of AGI for various income ranges: 16.0% for AGIs $10k-25k, 9.3% for AGIs $25k-50k, 9.7% for AGIs $50k-75k, 9.2% for AGIs $75k-100k, 6.8% for AGIs over 100k)
Charity contributions deductions: $1,821 (2% of AGI, reported on 20.0% of returns)
Here:
$1,821
State:
$3,719
Here:
1.9% of AGI
State:
3.4% of AGI
(% of AGI for various income ranges: 0.4% for AGIs $25k-50k, 0.7% for AGIs $50k-75k, 1.0% for AGIs $75k-100k, 1.1% for AGIs over 100k)
Total tax: $5,823 (reported on 81.9% of returns)
61569:
$5,823
State:
$9,882
(% of AGI for various income ranges: 1.7% for AGIs below $10k, 3.6% for AGIs $10k-25k, 7.3% for AGIs $25k-50k, 8.3% for AGIs $50k-75k, 10.2% for AGIs $75k-100k, 13.7% for AGIs over 100k)
Earned income credit: $1,450 (reported on 6.8% of returns)
Here:
$1,450
State:
$1,788
Percentage of individuals using paid preparers for their 2004 taxes: 67.1%
Here:
67%
State:
61%
(% for various income ranges: 62.4% for AGIs below $10k, 65.6% for AGIs $10k-25k, 68.3% for AGIs $25k-50k, 69.9% for AGIs $50k-75k, 62.8% for AGIs $75k-100k, 77.5% for AGIs over 100k)
Household received Food Stamps/SNAP in the past 12 months: 0 Household did not receive Food Stamps/SNAP in the past 12 months: 427
Women who did not have a birth in the past 12 months: 314 (143 now married, 170 unmarried)
Housing units in zip code 61569 with a mortgage: 236 (17 second mortgage, 17 both second mortgage and home equity loan) Median monthly owner costs for units with a mortgage: $1,466 Median monthly owner costs for units without a mortgage: $589
Residents with income below the poverty level in 2022:
This zip code:
3.3%
Whole state:
11.9%
Median number of rooms in houses and condos:
Here:
6.4
State:
6.4
Median number of rooms in apartments:
Here:
4.8
State:
4.1
Notable locations in this zip code not listed on our city pages
Notable locations in zip code 61569: Christ Orchard (A), Logan - Trivoli Fire Protection District Trivoli Station (B). Display/hide their locations on the map
Cemeteries: Penn Ridge Cemetery (1), Harkness Grove Cemetery (2), Brunswick Cemetery (3), Pleasant Grove Cemetery (4), Trivoli Cemetery (5). Display/hide their locations on the map
Reservoirs: Lake Bloomington (A), Fresh Water Lake (B), Slurry Lake Number 1 (C), Lake Holiday (D), Grahams Lake (E). Display/hide their locations on the map
Size of family households: 235 2-persons, 33 3-persons, 66 4-persons, 20 5-persons
Size of nonfamily households: 77 1-person
172 married couples with children.
31 single-parent households (18 men, 13 women).
97.3% of residents of 61569 zip code speak English at home.
1.9% of residents speak Spanish at home (100% very well).
Foreign born population: 0 (0.0%)
:
0.0%
Whole state:
14.4%
35%American
16%European
13%German
8%English
6%Norwegian
1%French
1%Irish
Facilities with environmental interests located in this zip code:
ASARCO INC, MIDLAND COAL CO - ELM MINE (PO BOX 8 in TRIVOLI, IL)
STATE MASTER (Illinois EPA Project) - AIR PROGRAM AIR MINOR (AIRS/AFS) Business SIC classification: BITUMINOUS COAL UNDERGROUND MINING
41.5%Utility gas
37.5%Bottled, tank, or LP gas
21.3%Electricity
Population in 1990: 1,166. Population change in the 1990s: +49 (+4.2%).
Place of birth for U.S.-born residents:
This state: 860
Midwest: 100
South: 8
West: 23
77% of the 61569 zip code residents lived in the same house 5 years ago. Out of people who lived in different houses, 62% lived in this county. Out of people who lived in different counties, 50% lived in Illinois.
94% of the 61569 zip code residents lived in the same house 1 year ago. Out of people who lived in different houses, 93% moved from this county.
Private vs. public school enrollment:
Students in private schools in grades 1 to 8 (elementary and middle school):
Here:
0.0%
Illinois:
13.3%
Students in private schools in grades 9 to 12 (high school):
Here:
0.0%
Illinois:
9.9%
Students in private undergraduate colleges:
Here:
0.0%
Illinois:
27.4%
Occupation by median earnings in the past 12 months ($)
159,748Health diagnosing and treating practitioners and other technical occupations
59,547Management occupations
51,280Office and administrative support occupations
51,141Installation, maintenance, and repair occupations
50,551Construction and extraction occupations
47,971Production occupations
Companies with federal contracts located in this zip code:
AMY K QUIMBY (3604 N TRIVOLI RD in TRIVOLI, IL; small business) : $65,945 in 4 contractsfrom 2005 to 2006
$47,000 with Army for Program Management/Support Services. Signed on 2005-10-12. Completion date: 2005-09-30.
$15,000, same as above.Signed on 2005-05-12. Completion date: 2005-09-30.
$2,400, same as above.Signed on 2006-05-07. Completion date: 2005-09-30.
$1,545, same as above.Signed on 2005-08-26. Completion date: 2005-09-30.
Top industries in this zip code by the number of employees in 2005:
Finance and Insurance: Commercial Banking (50-99 employees: 1 establishment)
Construction: Electrical Contractors (20-49: 1)
Wholesale Trade: Farm and Garden Machinery and Equipment Merchant Wholesalers (10-19: 1)
Wholesale Trade: Construction and Mining (except Oil Well) Machinery and Equipment Merchant Wholesalers (5-9: 1)
Accommodation and Food Services: Full-Service Restaurants (5-9: 1)
Wholesale Trade: Stationery and Office Supplies Merchant Wholesalers (1-4: 1)
Other Services (except Public Administration): Coin-Operated Laundries and Drycleaners (1-4: 1)
Management of Companies and Enterprises: Offices of Bank Holding Companies (1-4: 1)
Fatal accident statistics in 2012:
Fatal accident count: 1
Vehicles involved in fatal accidents: 2
Fatal accidents caused by drunken drivers: 0
Fatalities: 1
Persons involved in fatal accidents: 5
Pedestrians involved in fatal accidents: 0
Home Mortgage Disclosure Act Aggregated Statistics For Year 2009 (Based on 4 partial tracts)
A) FHA, FSA/RHS & VA Home Purchase Loans
B) Conventional Home Purchase Loans
C) Refinancings
D) Home Improvement Loans
F) Non-occupant Loans on < 5 Family Dwellings (A B C & D)
Number
Average Value
Number
Average Value
Number
Average Value
Number
Average Value
Number
Average Value
LOANS ORIGINATED
22
$120,299
30
$132,297
168
$138,585
10
$67,492
5
$107,918
APPLICATIONS APPROVED, NOT ACCEPTED
2
$117,960
2
$105,930
10
$143,380
1
$21,150
0
$0
APPLICATIONS DENIED
1
$125,790
0
$0
27
$135,574
3
$17,493
0
$0
APPLICATIONS WITHDRAWN
1
$76,620
2
$98,745
21
$156,025
1
$58,490
0
$0
FILES CLOSED FOR INCOMPLETENESS
0
$0
1
$67,200
4
$135,462
0
$0
0
$0
Aggregated Statistics For Year 2008 (Based on 4 partial tracts)
A) FHA, FSA/RHS & VA Home Purchase Loans
B) Conventional Home Purchase Loans
C) Refinancings
D) Home Improvement Loans
E) Loans on Dwellings For 5+ Families
F) Non-occupant Loans on < 5 Family Dwellings (A B C & D)
G) Loans On Manufactured Home Dwelling (A B C & D)
Number
Average Value
Number
Average Value
Number
Average Value
Number
Average Value
Number
Average Value
Number
Average Value
Number
Average Value
LOANS ORIGINATED
21
$113,218
37
$137,224
72
$116,794
14
$29,781
1
$54,750
6
$67,403
0
$0
APPLICATIONS APPROVED, NOT ACCEPTED
1
$59,920
0
$0
5
$95,068
0
$0
0
$0
1
$155,550
0
$0
APPLICATIONS DENIED
5
$157,742
5
$155,144
26
$148,901
11
$75,639
0
$0
0
$0
1
$49,150
APPLICATIONS WITHDRAWN
2
$119,585
3
$252,347
14
$143,356
2
$151,825
0
$0
2
$93,750
0
$0
FILES CLOSED FOR INCOMPLETENESS
0
$0
1
$127,020
1
$159,600
1
$15,560
0
$0
0
$0
0
$0
Aggregated Statistics For Year 2007 (Based on 4 partial tracts)
A) FHA, FSA/RHS & VA Home Purchase Loans
B) Conventional Home Purchase Loans
C) Refinancings
D) Home Improvement Loans
F) Non-occupant Loans on < 5 Family Dwellings (A B C & D)
Number
Average Value
Number
Average Value
Number
Average Value
Number
Average Value
Number
Average Value
LOANS ORIGINATED
8
$124,802
74
$130,994
69
$113,826
18
$57,447
10
$80,209
APPLICATIONS APPROVED, NOT ACCEPTED
0
$0
7
$157,031
9
$104,270
2
$46,930
1
$79,020
APPLICATIONS DENIED
1
$203,350
11
$97,894
44
$107,349
14
$63,089
2
$86,205
APPLICATIONS WITHDRAWN
1
$63,420
3
$138,743
24
$126,766
3
$71,750
0
$0
FILES CLOSED FOR INCOMPLETENESS
0
$0
0
$0
3
$111,817
0
$0
0
$0
Aggregated Statistics For Year 2006 (Based on 4 partial tracts)
A) FHA, FSA/RHS & VA Home Purchase Loans
B) Conventional Home Purchase Loans
C) Refinancings
D) Home Improvement Loans
F) Non-occupant Loans on < 5 Family Dwellings (A B C & D)
G) Loans On Manufactured Home Dwelling (A B C & D)
Number
Average Value
Number
Average Value
Number
Average Value
Number
Average Value
Number
Average Value
Number
Average Value
LOANS ORIGINATED
10
$106,613
79
$121,560
68
$110,634
19
$28,731
10
$89,506
1
$117,060
APPLICATIONS APPROVED, NOT ACCEPTED
2
$140,930
4
$94,042
9
$94,164
1
$23,480
0
$0
0
$0
APPLICATIONS DENIED
1
$105,540
7
$94,766
37
$108,156
12
$52,688
0
$0
0
$0
APPLICATIONS WITHDRAWN
1
$125,680
4
$247,665
26
$134,808
3
$126,580
0
$0
1
$60,350
FILES CLOSED FOR INCOMPLETENESS
0
$0
1
$52,560
8
$141,096
1
$43,450
0
$0
0
$0
Aggregated Statistics For Year 2005 (Based on 4 partial tracts)
A) FHA, FSA/RHS & VA Home Purchase Loans
B) Conventional Home Purchase Loans
C) Refinancings
D) Home Improvement Loans
F) Non-occupant Loans on < 5 Family Dwellings (A B C & D)
Number
Average Value
Number
Average Value
Number
Average Value
Number
Average Value
Number
Average Value
LOANS ORIGINATED
9
$112,157
82
$100,053
78
$99,664
20
$55,698
7
$63,664
APPLICATIONS APPROVED, NOT ACCEPTED
0
$0
6
$100,933
13
$88,607
1
$12,840
0
$0
APPLICATIONS DENIED
1
$47,910
8
$97,322
51
$112,204
10
$48,447
1
$165,620
APPLICATIONS WITHDRAWN
1
$119,840
3
$77,383
30
$123,497
1
$99,860
1
$49,600
FILES CLOSED FOR INCOMPLETENESS
0
$0
1
$161,530
3
$119,317
0
$0
0
$0
Aggregated Statistics For Year 2004 (Based on 4 partial tracts)
A) FHA, FSA/RHS & VA Home Purchase Loans
B) Conventional Home Purchase Loans
C) Refinancings
D) Home Improvement Loans
E) Loans on Dwellings For 5+ Families
F) Non-occupant Loans on < 5 Family Dwellings (A B C & D)
G) Loans On Manufactured Home Dwelling (A B C & D)
Number
Average Value
Number
Average Value
Number
Average Value
Number
Average Value
Number
Average Value
Number
Average Value
Number
Average Value
LOANS ORIGINATED
4
$87,968
70
$103,525
97
$109,480
25
$28,198
1
$99,550
5
$74,198
1
$11,980
APPLICATIONS APPROVED, NOT ACCEPTED
0
$0
2
$89,165
8
$130,101
1
$11,480
0
$0
0
$0
0
$0
APPLICATIONS DENIED
1
$56,760
4
$70,670
42
$105,928
6
$54,363
0
$0
1
$112,000
0
$0
APPLICATIONS WITHDRAWN
0
$0
4
$106,140
36
$120,176
1
$51,640
0
$0
1
$46,660
0
$0
FILES CLOSED FOR INCOMPLETENESS
0
$0
1
$124,260
1
$91,100
0
$0
0
$0
0
$0
0
$0
Aggregated Statistics For Year 2003 (Based on 4 partial tracts)
A) FHA, FSA/RHS & VA Home Purchase Loans
B) Conventional Home Purchase Loans
C) Refinancings
D) Home Improvement Loans
E) Loans on Dwellings For 5+ Families
F) Non-occupant Loans on < 5 Family Dwellings (A B C & D)
Number
Average Value
Number
Average Value
Number
Average Value
Number
Average Value
Number
Average Value
Number
Average Value
LOANS ORIGINATED
7
$104,934
63
$100,158
263
$96,925
18
$27,137
1
$22,400
8
$65,610
APPLICATIONS APPROVED, NOT ACCEPTED
1
$62,840
2
$119,595
16
$127,918
1
$15,990
0
$0
0
$0
APPLICATIONS DENIED
0
$0
5
$89,224
64
$103,630
8
$18,879
0
$0
1
$61,670
APPLICATIONS WITHDRAWN
1
$111,980
5
$88,928
37
$100,852
0
$0
0
$0
0
$0
FILES CLOSED FOR INCOMPLETENESS
0
$0
2
$61,585
2
$128,250
0
$0
0
$0
0
$0
Aggregated Statistics For Year 2002 (Based on 4 partial tracts)
A) FHA, FSA/RHS & VA Home Purchase Loans
B) Conventional Home Purchase Loans
C) Refinancings
D) Home Improvement Loans
F) Non-occupant Loans on < 5 Family Dwellings (A B C & D)
Number
Average Value
Number
Average Value
Number
Average Value
Number
Average Value
Number
Average Value
LOANS ORIGINATED
10
$75,636
56
$100,105
189
$97,593
25
$21,490
5
$49,252
APPLICATIONS APPROVED, NOT ACCEPTED
0
$0
2
$204,120
13
$87,426
1
$9,460
0
$0
APPLICATIONS DENIED
0
$0
6
$82,745
41
$91,622
6
$10,185
0
$0
APPLICATIONS WITHDRAWN
1
$64,090
4
$76,280
23
$97,460
2
$2,355
0
$0
FILES CLOSED FOR INCOMPLETENESS
0
$0
1
$117,720
5
$93,198
0
$0
0
$0
Aggregated Statistics For Year 2001 (Based on 4 partial tracts)
A) FHA, FSA/RHS & VA Home Purchase Loans
B) Conventional Home Purchase Loans
C) Refinancings
D) Home Improvement Loans
F) Non-occupant Loans on < 5 Family Dwellings (A B C & D)
Number
Average Value
Number
Average Value
Number
Average Value
Number
Average Value
Number
Average Value
LOANS ORIGINATED
6
$75,535
61
$96,982
172
$99,017
30
$29,448
11
$44,905
APPLICATIONS APPROVED, NOT ACCEPTED
0
$0
2
$83,985
14
$74,919
4
$73,445
0
$0
APPLICATIONS DENIED
0
$0
3
$66,817
31
$88,070
7
$7,299
1
$24,310
APPLICATIONS WITHDRAWN
0
$0
4
$134,398
21
$84,813
1
$8,250
0
$0
FILES CLOSED FOR INCOMPLETENESS
0
$0
2
$91,585
1
$111,510
0
$0
1
$40,650
Aggregated Statistics For Year 2000 (Based on 4 partial tracts)
A) FHA, FSA/RHS & VA Home Purchase Loans
B) Conventional Home Purchase Loans
C) Refinancings
D) Home Improvement Loans
E) Loans on Dwellings For 5+ Families
F) Non-occupant Loans on < 5 Family Dwellings (A B C & D)
Number
Average Value
Number
Average Value
Number
Average Value
Number
Average Value
Number
Average Value
Number
Average Value
LOANS ORIGINATED
4
$80,525
63
$90,035
55
$76,831
30
$18,114
1
$100,800
6
$55,715
APPLICATIONS APPROVED, NOT ACCEPTED
0
$0
2
$47,960
12
$60,622
5
$10,208
0
$0
0
$0
APPLICATIONS DENIED
0
$0
3
$92,723
27
$70,177
11
$9,740
0
$0
0
$0
APPLICATIONS WITHDRAWN
0
$0
4
$92,300
16
$61,809
1
$11,480
0
$0
0
$0
FILES CLOSED FOR INCOMPLETENESS
0
$0
1
$108,880
2
$65,105
0
$0
0
$0
0
$0
Aggregated Statistics For Year 1999 (Based on 2 partial tracts)
A) FHA, FSA/RHS & VA Home Purchase Loans
B) Conventional Home Purchase Loans
C) Refinancings
D) Home Improvement Loans
F) Non-occupant Loans on < 5 Family Dwellings (A B C & D)
Detailed PMIC statistics for the following Tracts:0040.00
, 0049.02
2002 - 2018 National Fire Incident Reporting System (NFIRS) incidents
According to the data from the years 2002 - 2018 the average number of fire incidents per year is 8. The highest number of fires - 18 took place in 2017, and the least - 1 in 2007. The data has a decreasing trend.
When looking into fire subcategories, the most incidents belonged to: Outside Fires (54.5%), and Structure Fires (32.9%).
Fire incident types reported to NFIRS in Zip Code 61569


 Nearest zip codes: 61529, 61536, 61533, 61531, 61553, 61517.


 According to the data from the years 2002 - 2018 the average number of fire incidents per year is 8. The highest number of fires - 18 took place in 2017, and the least - 1 in 2007. The data has a decreasing trend.
 When looking into fire subcategories, the most incidents belonged to: Outside Fires (54.5%), and Structure Fires (32.9%).