Estimated zip code population in 2022: 1,989 Zip code population in 2010: 2,096 Zip code population in 2000: 2,082
Houses and condos: 766 Renter-occupied apartments: 69
% of renters here:
9%
State:
33%
March 2022 cost of living index in zip code 61732: 85.9 (less than average, U.S. average is 100)
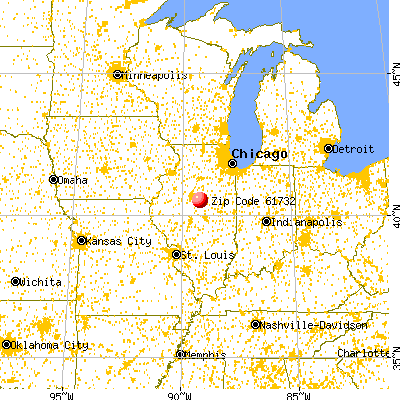
Land area: 55.7 sq. mi. Water area: 0.0 sq. mi.
Population density: 36 people per square mile
(very low).
OSM Map
General Map
Google Map
MSN Map
OSM Map
General Map
Google Map
MSN Map
OSM Map
General Map
Google Map
MSN Map
OSM Map
General Map
Google Map
MSN Map
Please wait while loading the map...
Real estate property taxes paid for housing units in 2022:
This zip code:
2.1% ($4,164)
Illinois:
2.0% ($4,912)
Median real estate property taxes paid for housing units with mortgages in 2022: $4,162 (2.1%) Median real estate property taxes paid for housing units with no mortgage in 2022: $4,128 (2.0%)
Business Search- 14 Million verified businesses
Males: 928
(46.7%)
Females: 1,060
(53.3%)
For population 25 years and over in 61732:
High school or higher: 97.3%
Bachelor's degree or higher: 31.5%
Graduate or professional degree: 8.7%
Unemployed: 2.7%
Mean travel time to work (commute): 27.6 minutes
For population 15 years and over in 61732:
Never married: 25.8%
Now married: 63.0%
Separated: 0.4%
Widowed: 3.4%
Divorced: 7.3%
Zip code 61732 compared to state average:
Unemployed percentage below state average.
Black race population percentage significantly below state average.
Hispanic race population percentage significantly below state average.
Foreign-born population percentage significantly below state average.
Renting percentage significantly below state average.
Length of stay since moving in significantly above state average.
Estimated median house/condo value in 2022: $198,039
61732:
$198,039
Illinois:
$251,600
According to our research of Illinois and other state lists, there were 2 registered sex offenders living in 61732 zip code as of May 28, 2024. The ratio of all residents to sex offenders in zip code 61732 is 1,072 to 1. The ratio of registered sex offenders to all residents in this zip code is lower than the state average.
Median resident age:
This zip code:
42.6 years
Illinois median age:
39.1 years
Average household size:
This zip code:
2.6 people
Illinois:
2.4 people
Averages for the 2020 tax year for zip code 61732, filed in 2021:
Average Adjusted Gross Income (AGI) in 2020: $75,926 (Individual Income Tax Returns)
Here:
$75,926
State:
$82,626
Salary/wage: $63,299 (reported on 82.2% of returns)
Here:
$63,299
State:
$66,640
(% of AGI for various income ranges: 1018.8% for AGIs below $25k, 3331.2% for AGIs $25k-50k, 5669.2% for AGIs $50k-75k, 9481.2% for AGIs $75k-100k, 15051.2% for AGIs $100k-200k)
Taxable interest for individuals: $702 (reported on 53.5% of returns)
This zip code:
$702
Illinois:
$2,376
(% of AGI for various income ranges: 25.6% for AGIs below $25k, 25.6% for AGIs $25k-50k, 27.5% for AGIs $50k-75k, 36.2% for AGIs $75k-100k, 92.5% for AGIs $100k-200k)
Ordinary dividends: $2,927 (reported on 25.7% of returns)
Here:
$2,927
State:
$9,061
(% of AGI for various income ranges: 18.1% for AGIs below $25k, 56.9% for AGIs $25k-50k, 85.0% for AGIs $50k-75k, 130.0% for AGIs $75k-100k, 221.9% for AGIs $100k-200k)
Net capital gain/loss in AGI: +$6,748 (reported on 22.8% of returns)
Here:
+$6,748
State:
+$31,684
(% of AGI for various income ranges: 3.8% for AGIs below $25k, 91.9% for AGIs $25k-50k, 67.5% for AGIs $50k-75k, 273.8% for AGIs $75k-100k, 396.2% for AGIs $100k-200k)
Profit/loss from business: +$11,546 (reported on 12.9% of returns)
Here:
+$11,546
State:
+$12,175
(% of AGI for various income ranges: 80.6% for AGIs below $25k, 141.9% for AGIs $25k-50k, 136.7% for AGIs $50k-75k, 182.5% for AGIs $75k-100k, 521.9% for AGIs $100k-200k)
Taxable individual retirement arrangement distribution: $15,400 (reported on 12.9% of returns)
61732:
$15,400
Illinois:
$21,613
(% of AGI for various income ranges: 221.2% for AGIs below $25k, 295.0% for AGIs $50k-75k, 522.5% for AGIs $75k-100k, 547.5% for AGIs $100k-200k)
Total itemized deductions: $30,917 (reported on 5.9% of returns)
Here:
$30,917
State:
$34,948
(% of AGI for various income ranges: 547.5% for AGIs $50k-75k, 748.8% for AGIs $100k-200k)
Charity contributions: $8,360 (reported on 5.0% of returns)
Here:
$8,360
State:
$13,122
(% of AGI for various income ranges: 261.2% for AGIs $100k-200k)
Taxes paid: $8,117 (reported on 5.9% of returns)
61732:
$8,117
State:
$8,563
(% of AGI for various income ranges: 165.8% for AGIs $50k-75k, 180.0% for AGIs $100k-200k)
Earned income credit: $2,311 (reported on 8.9% of returns)
Here:
$2,311
State:
$2,311
(% of AGI for various income ranges: 60.0% for AGIs below $25k, 70.0% for AGIs $25k-50k)
Percentage of individuals using paid preparers for their 2020 taxes: 95.0%
Here:
95%
State:
93%
(% for various income ranges: 95.7% for AGIs below $25k, 95.0% for AGIs $25k-50k, 93.8% for AGIs $50k-75k, 92.3% for AGIs $75k-100k, 96.0% for AGIs $100k-200k, 100.0% for AGIs over 200k)
Averages for the 2012 tax year for zip code 61732, filed in 2013:
Average Adjusted Gross Income (AGI) in 2012: $67,141 (Individual Income Tax Returns)
Here:
$67,141
State:
$68,058
Salary/wage: $54,180 (reported on 84.6% of returns)
Here:
$54,180
State:
$55,396
(% of AGI for various income ranges: 72.1% for AGIs below $25k, 79.6% for AGIs $25k-50k, 78.5% for AGIs $50k-75k, 70.7% for AGIs $75k-100k, 90.4% for AGIs $100k-200k)
Taxable interest for individuals: $881 (reported on 50.0% of returns)
This zip code:
$881
Illinois:
$1,969
(% of AGI for various income ranges: 1.8% for AGIs below $25k, 1.1% for AGIs $25k-50k, 0.3% for AGIs $50k-75k, 0.4% for AGIs $75k-100k, 0.7% for AGIs $100k-200k, 0.6% for AGIs over 200k)
Ordinary dividends: $2,093 (reported on 26.9% of returns)
Here:
$2,093
State:
$7,786
(% of AGI for various income ranges: 0.5% for AGIs below $25k, 0.7% for AGIs $25k-50k, 0.8% for AGIs $50k-75k, 0.6% for AGIs $75k-100k, 1.5% for AGIs $100k-200k)
Net capital gain/loss in AGI: +$7,944 (reported on 15.4% of returns)
Here:
+$7,944
State:
+$22,183
(% of AGI for various income ranges: 0.4% for AGIs $25k-50k, 0.4% for AGIs $50k-75k, 0.4% for AGIs $75k-100k, 4.9% for AGIs $100k-200k)
Profit/loss from business: +$5,764 (reported on 13.5% of returns)
Here:
+$5,764
State:
+$12,903
(% of AGI for various income ranges: 7.0% for AGIs below $25k, 1.8% for AGIs $25k-50k, 0.5% for AGIs $50k-75k, 0.4% for AGIs $75k-100k, 1.3% for AGIs $100k-200k)
Taxable individual retirement arrangement distribution: $11,036 (reported on 10.6% of returns)
61732:
$11,036
Illinois:
$17,929
(% of AGI for various income ranges: 4.8% for AGIs below $25k, 1.6% for AGIs $50k-75k, 3.0% for AGIs $75k-100k, 2.0% for AGIs $100k-200k)
Total itemized deductions: $18,626 (18% of AGI, reported on 41.3% of returns)
Here:
$18,626
State:
$26,433
Here:
18.2% of AGI
State:
19.2% of AGI
(% of AGI for various income ranges: 9.6% for AGIs below $25k, 10.4% for AGIs $25k-50k, 10.8% for AGIs $50k-75k, 13.3% for AGIs $75k-100k, 12.5% for AGIs $100k-200k, 9.2% for AGIs over 200k)
Charity contributions: $2,953 (reported on 30.8% of returns)
Here:
$2,953
State:
$4,525
(% of AGI for various income ranges: 1.1% for AGIs $25k-50k, 0.7% for AGIs $50k-75k, 1.8% for AGIs $75k-100k, 2.4% for AGIs $100k-200k)
Taxes paid: $8,200 (reported on 41.3% of returns)
61732:
$8,200
State:
$11,968
(% of AGI for various income ranges: 2.7% for AGIs below $25k, 3.3% for AGIs $25k-50k, 4.2% for AGIs $50k-75k, 5.7% for AGIs $75k-100k, 6.0% for AGIs $100k-200k, 5.3% for AGIs over 200k)
Earned income credit: $1,990 (reported on 9.6% of returns)
Here:
$1,990
State:
$2,349
(% of AGI for various income ranges: 4.1% for AGIs below $25k, 0.6% for AGIs $25k-50k)
Percentage of individuals using paid preparers for their 2012 taxes: 55.8%
Here:
56%
State:
57%
(% for various income ranges: 46.7% for AGIs below $25k, 52.4% for AGIs $25k-50k, 66.7% for AGIs $50k-75k, 57.1% for AGIs $75k-100k, 55.6% for AGIs $100k-200k, 100.0% for AGIs over 200k)
Averages for the 2004 tax year for zip code 61732, filed in 2005:
Average Adjusted Gross Income (AGI) in 2004: $48,433 (Individual Income Tax Returns)
Here:
$48,433
State:
$54,625
Salary/wage: $43,757 (reported on 87.5% of returns)
Here:
$43,757
State:
$46,811
(% of AGI for various income ranges: 112.0% for AGIs below $10k, 73.9% for AGIs $10k-25k, 76.2% for AGIs $25k-50k, 84.7% for AGIs $50k-75k, 83.0% for AGIs $75k-100k, 70.5% for AGIs over 100k)
Taxable interest for individuals: $1,261 (reported on 57.0% of returns)
This zip code:
$1,261
Illinois:
$2,101
(% of AGI for various income ranges: 2.3% for AGIs below $10k, 4.5% for AGIs $10k-25k, 2.7% for AGIs $25k-50k, 1.2% for AGIs $50k-75k, 0.6% for AGIs $75k-100k, 1.1% for AGIs over 100k)
Taxable dividends: $917 (reported on 30.0% of returns)
Here:
$917
State:
$4,306
(% of AGI for various income ranges: 1.0% for AGIs below $10k, 1.1% for AGIs $10k-25k, 1.1% for AGIs $25k-50k, 0.3% for AGIs $50k-75k, 0.4% for AGIs $75k-100k, 0.7% for AGIs over 100k)
Net capital gain/loss: +$1,180 (reported on 19.2% of returns)
Here:
+$1,180
State:
+$17,321
(% of AGI for various income ranges: -3.7% for AGIs below $10k, -0.5% for AGIs $10k-25k, 0.1% for AGIs $25k-50k, 0.0% for AGIs $50k-75k, 0.4% for AGIs $75k-100k, 1.6% for AGIs over 100k)
Profit/loss from business: +$4,172 (reported on 18.4% of returns)
Here:
+$4,172
State:
+$11,771
(% of AGI for various income ranges: 6.5% for AGIs below $10k, 6.2% for AGIs $10k-25k, 3.4% for AGIs $25k-50k, 0.9% for AGIs $50k-75k, 0.8% for AGIs $75k-100k, 0.7% for AGIs over 100k)
Profit/loss from farming: +$9,479 (reported on 6.8% of returns)
Here:
+$9,479
State:
+$2,327
(% of AGI for various income ranges: -5.0% for AGIs below $10k, 2.2% for AGIs $25k-50k, 1.3% for AGIs $50k-75k, 3.2% for AGIs $75k-100k, -0.1% for AGIs over 100k)
IRA payment deduction: $2,840 (reported on 2.4% of returns)
61732:
$2,840
Illinois:
$3,087
Total itemized deductions: $14,682 (19% of AGI, reported on 36.4% of returns)
Here:
$14,682
State:
$20,239
Here:
18.7% of AGI
State:
19.5% of AGI
(% of AGI for various income ranges: 12.6% for AGIs $10k-25k, 12.0% for AGIs $25k-50k, 10.9% for AGIs $50k-75k, 11.8% for AGIs $75k-100k, 10.2% for AGIs over 100k)
Charity contributions deductions: $2,441 (3% of AGI, reported on 29.8% of returns)
Here:
$2,441
State:
$3,719
Here:
2.9% of AGI
State:
3.4% of AGI
(% of AGI for various income ranges: 1.3% for AGIs $10k-25k, 1.2% for AGIs $25k-50k, 1.6% for AGIs $50k-75k, 1.3% for AGIs $75k-100k, 1.8% for AGIs over 100k)
Total tax: $6,689 (reported on 80.9% of returns)
61732:
$6,689
State:
$9,882
(% of AGI for various income ranges: 3.8% for AGIs below $10k, 4.7% for AGIs $10k-25k, 7.1% for AGIs $25k-50k, 8.7% for AGIs $50k-75k, 10.6% for AGIs $75k-100k, 18.4% for AGIs over 100k)
Earned income credit: $1,667 (reported on 8.0% of returns)
Here:
$1,667
State:
$1,788
Percentage of individuals using paid preparers for their 2004 taxes: 59.0%
Here:
59%
State:
61%
(% for various income ranges: 50.0% for AGIs below $10k, 60.0% for AGIs $10k-25k, 61.4% for AGIs $25k-50k, 62.5% for AGIs $50k-75k, 59.4% for AGIs $75k-100k, 63.9% for AGIs over 100k)
Household received Food Stamps/SNAP in the past 12 months: 41 Household did not receive Food Stamps/SNAP in the past 12 months: 706
Women who had a birth in the past 12 months: 49 (48 now married, 0 unmarried) Women who did not have a birth in the past 12 months: 395 (135 now married, 260 unmarried)
Housing units in zip code 61732 with a mortgage: 499 (17 second mortgage, 16 both second mortgage and home equity loan) Houses without a mortgage: 22
Median monthly owner costs for units with a mortgage: $1,557 Median monthly owner costs for units without a mortgage: $688
Residents with income below the poverty level in 2022:
This zip code:
3.4%
Whole state:
11.9%
Residents with income below 50% of the poverty level in 2022:
This zip code:
1.1%
Whole state:
5.7%
Median number of rooms in houses and condos:
Here:
7.0
State:
6.4
Median number of rooms in apartments:
Here:
4.2
State:
4.1
Notable locations in this zip code not listed on our city pages
Notable locations in zip code 61732: Danvers Community Fire Protection District (A), Danvers Emergency and Rescue Service (B). Display/hide their locations on the map
Size of family households: 254 2-persons, 93 3-persons, 171 4-persons, 26 5-persons, 23 6-persons, 5 7-or-more-persons
Size of nonfamily households: 144 1-person, 34 2-persons
344 married couples with children.
41 single-parent households (16 men, 25 women).
98.2% of residents of 61732 zip code speak English at home.
0.7% of residents speak Spanish at home (62% very well, 38% well).
0.4% of residents speak other Indo-European language at home (75% well, 25% not well).
Foreign born population: 19 (1.0%) (58.1% of them are naturalized citizens)
This zip code:
1.0%
Whole state:
14.4%
42%Bhutan
32%Eritrea
21%Honduras
49%German
10%Irish
9%English
8%American
8%European
6%Polish
2%Italian
Year of entry for the foreign-born population
22010 or later
52000 to 2009
51990 to 1999
29Before 1990
Facilities with environmental interests located in this zip code:
DANVERS FARMERS ELEVATOR (100 WEST MAIN STREET in DANVERS, IL)
STATE MASTER (Illinois EPA Project) - AIR PROGRAM AIR MINOR (AIRS/AFS) CRITERIA AND HAZARDOUS AIR POLLUTANT INVENTORY (Inventory of air pollution sources) Business SIC classification: GRAIN AND FIELD BEANS; PETROLEUM BULK STATIONS AND TERMINALS
MCLEAN COUNTY SERVICE CO (RFD in DANVERS, IL)
STATE MASTER (Illinois EPA Project) - AIR PROGRAM AIR MINOR (AIRS/AFS) Business SIC classification: FERTILIZERS, MIXING ONLY
DANVERS STP (PO BOX 398 in DANVERS, IL)
STATE MASTER (Illinois EPA Project) - National Pollutant Discharge Elimination System Permit National Pollutant Discharge Elimination System NON-MAJOR (Tracking pollutant discharge elimination systems) - permit Business SIC classification: SEWERAGE SYSTEMS Alternative names: DANVERS STP, VILLAGE OF
DANVERS ELEM SCHOOL (205 N STATE in DANVERS, IL)
(National Center for Education Statistics) - STATE ID-1706401602003 Organizations: OLYMPIA C U SCHOOL DIST 16 (SCHOOL DISTRICT)
DANVERS FARMERS ELEVATOR CO (200 S WEST ST in DANVERS, IL)
STATE MASTER (Illinois EPA Project) - AIR PROGRAM COMPLIANCE ACTIVITY (Tracking inspections of insecticide, fungicide, and rodenticide, and toxic substances) Alternative names: DANVERS FARMERS ELE CO
MCLEAN COUNTY SERVICE COMPANY DANVERS (ILLINOIS HIGHWAY 9 in DANVERS, IL)
ENFORCEMENT/COMPLIANCE ACTIVITY (Integrated Compliance Information System) (Resource Conservation and Recovery Act (tracking hazardous waste))
56.3%Utility gas
31.0%Bottled, tank, or LP gas
8.8%Electricity
2.2%Wood
1.9%No fuel used
Population in 1990: 1,825. Population change in the 1990s: +257 (+14.1%).
Place of birth for U.S.-born residents:
This state: 1,529
Northeast: 50
Midwest: 288
South: 24
West: 48
65% of the 61732 zip code residents lived in the same house 5 years ago. Out of people who lived in different houses, 75% lived in this county. Out of people who lived in different counties, 50% lived in Illinois.
99% of the 61732 zip code residents lived in the same house 1 year ago. Out of people who lived in different houses, 15% moved from this county. Out of people who lived in different houses, 54% moved from different county within same state. Out of people who lived in different houses, 31% moved from different state.
Private vs. public school enrollment:
Students in private schools in grades 1 to 8 (elementary and middle school): 11
Here:
7.0%
Illinois:
13.3%
Students in private schools in grades 9 to 12 (high school): 2
Here:
2.5%
Illinois:
9.9%
Students in private undergraduate colleges:
Here:
0.0%
Illinois:
27.4%
Occupation by median earnings in the past 12 months ($)
83,479Installation, maintenance, and repair occupations
77,328Management occupations
69,422Health diagnosing and treating practitioners and other technical occupations
55,896Construction and extraction occupations
47,118Production occupations
45,787Sales and related occupations
Top industries in this zip code by the number of employees in 2005:
Detailed PMIC statistics for the following Tracts:0052.02
2002 - 2018 National Fire Incident Reporting System (NFIRS) incidents
Based on the data from the years 2002 - 2018 the average number of fire incidents per year is 16. The highest number of fires - 26 took place in 2004, and the least - 4 in 2010. The data has a decreasing trend.
When looking into fire subcategories, the most incidents belonged to: Outside Fires (52.4%), and Structure Fires (32.6%).
Fire incident types reported to NFIRS in Zip Code 61732


 Nearest zip codes: 61774, 61729, 61725, 61742, 61755, 61733.


 Based on the data from the years 2002 - 2018 the average number of fire incidents per year is 16. The highest number of fires - 26 took place in 2004, and the least - 4 in 2010. The data has a decreasing trend.
 When looking into fire subcategories, the most incidents belonged to: Outside Fires (52.4%), and Structure Fires (32.6%).