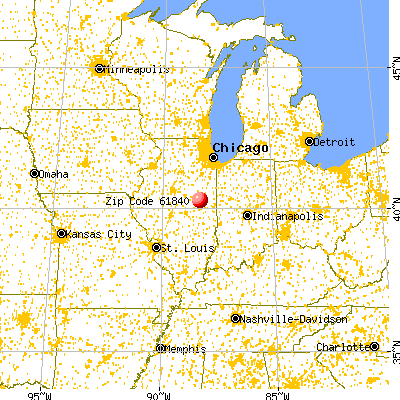
Averages for the 2020 tax year for zip code 61840, filed in 2021:
Average Adjusted Gross Income (AGI) in 2020: $92,219 (Individual Income Tax Returns)
Here:
$92,219
State:
$82,626
Salary/wage: $75,941 (reported on 86.5% of returns)
Here:
$75,941
State:
$66,640
(% of AGI for various income ranges: 1045.7% for AGIs below $25k, 3422.5% for AGIs $25k-50k, 5706.7% for AGIs $50k-75k, 8002.5% for AGIs $75k-100k, 16275.0% for AGIs $100k-200k)
Taxable interest for individuals: $731 (reported on 43.2% of returns)
This zip code:
$731
Illinois:
$2,376
(% of AGI for various income ranges: 50.0% for AGIs $25k-50k, 32.5% for AGIs $75k-100k, 101.7% for AGIs $100k-200k)
Ordinary dividends: $3,278 (reported on 24.3% of returns)
Here:
$3,278
State:
$9,061
(% of AGI for various income ranges: 115.0% for AGIs $25k-50k, 415.0% for AGIs $100k-200k)
Net capital gain/loss in AGI: +$4,588 (reported on 21.6% of returns)
Here:
+$4,588
State:
+$31,684
(% of AGI for various income ranges: 135.0% for AGIs $25k-50k, 521.7% for AGIs $100k-200k)
Profit/loss from business: +$5,820 (reported on 13.5% of returns)
Here:
+$5,820
State:
+$12,175
(% of AGI for various income ranges: 307.1% for AGIs below $25k, 126.7% for AGIs $100k-200k)
Taxable individual retirement arrangement distribution: $18,800 (reported on 10.8% of returns)
61840:
$18,800
Illinois:
$21,613
(% of AGI for various income ranges: 1253.3% for AGIs $100k-200k)
Total itemized deductions: $31,850 (reported on 10.8% of returns)
Here:
$31,850
State:
$34,948
(% of AGI for various income ranges: 2123.3% for AGIs $100k-200k)
Charity contributions: $12,133 (reported on 8.1% of returns)
Here:
$12,133
State:
$13,122
(% of AGI for various income ranges: 606.7% for AGIs $100k-200k)
Taxes paid: $9,175 (reported on 10.8% of returns)
61840:
$9,175
State:
$8,563
(% of AGI for various income ranges: 611.7% for AGIs $100k-200k)
Earned income credit: $2,425 (reported on 10.8% of returns)
Here:
$2,425
State:
$2,311
(% of AGI for various income ranges: 138.6% for AGIs below $25k)
Percentage of individuals using paid preparers for their 2020 taxes: 94.6%
Here:
95%
State:
93%
(% for various income ranges: 90.0% for AGIs below $25k, 100.0% for AGIs $25k-50k, 100.0% for AGIs $50k-75k, 100.0% for AGIs $75k-100k, 90.0% for AGIs $100k-200k, 100.0% for AGIs over 200k)
Averages for the 2012 tax year for zip code 61840, filed in 2013:
Average Adjusted Gross Income (AGI) in 2012: $77,515 (Individual Income Tax Returns)
Here:
$77,515
State:
$68,058
Salary/wage: $55,697 (reported on 91.2% of returns)
Here:
$55,697
State:
$55,396
(% of AGI for various income ranges: 69.9% for AGIs below $25k, 72.3% for AGIs $25k-50k, 73.6% for AGIs $50k-75k, 72.5% for AGIs $75k-100k, 59.9% for AGIs $100k-200k)
Taxable interest for individuals: $1,482 (reported on 50.0% of returns)
This zip code:
$1,482
Illinois:
$1,969
(% of AGI for various income ranges: 0.7% for AGIs $25k-50k, 0.5% for AGIs $50k-75k, 0.5% for AGIs $75k-100k, 1.3% for AGIs $100k-200k)
Ordinary dividends: $1,525 (reported on 23.5% of returns)
Here:
$1,525
State:
$7,786
(% of AGI for various income ranges: 2.4% for AGIs below $25k, 0.5% for AGIs $50k-75k, 0.5% for AGIs $100k-200k)
Profit/loss from business: +$2,700 (reported on 20.6% of returns)
Here:
+$2,700
State:
+$12,903
Taxable individual retirement arrangement distribution: $11,600 (reported on 11.8% of returns)
61840:
$11,600
Illinois:
$17,929
Total itemized deductions: $21,907 (19% of AGI, reported on 44.1% of returns)
Here:
$21,907
State:
$26,433
Here:
18.5% of AGI
State:
19.2% of AGI
(% of AGI for various income ranges: 18.6% for AGIs $25k-50k, 10.4% for AGIs $50k-75k, 12.6% for AGIs $75k-100k, 13.0% for AGIs $100k-200k)
Charity contributions: $4,936 (reported on 32.4% of returns)
Here:
$4,936
State:
$4,525
(% of AGI for various income ranges: 2.0% for AGIs $50k-75k, 2.4% for AGIs $75k-100k, 2.5% for AGIs $100k-200k)
Taxes paid: $9,393 (reported on 44.1% of returns)
61840:
$9,393
State:
$11,968
(% of AGI for various income ranges: 5.2% for AGIs $25k-50k, 4.0% for AGIs $50k-75k, 5.5% for AGIs $75k-100k, 6.1% for AGIs $100k-200k)
Earned income credit: $2,633 (reported on 8.8% of returns)
Here:
$2,633
State:
$2,349
(% of AGI for various income ranges: 7.0% for AGIs below $25k)
Percentage of individuals using paid preparers for their 2012 taxes: 70.6%
Here:
71%
State:
57%
(% for various income ranges: 55.6% for AGIs below $25k, 83.3% for AGIs $25k-50k, 66.7% for AGIs $50k-75k, 80.0% for AGIs $75k-100k, 75.0% for AGIs $100k-200k)
Averages for the 2004 tax year for zip code 61840, filed in 2005:
Average Adjusted Gross Income (AGI) in 2004: $46,781 (Individual Income Tax Returns)
Here:
$46,781
State:
$54,625
Salary/wage: $41,070 (reported on 84.6% of returns)
Here:
$41,070
State:
$46,811
(% of AGI for various income ranges: 109.5% for AGIs below $10k, 67.1% for AGIs $10k-25k, 74.9% for AGIs $25k-50k, 84.2% for AGIs $50k-75k, 77.4% for AGIs $75k-100k, 66.1% for AGIs over 100k)
Taxable interest for individuals: $1,053 (reported on 56.5% of returns)
This zip code:
$1,053
Illinois:
$2,101
(% of AGI for various income ranges: 6.9% for AGIs below $10k, 2.6% for AGIs $10k-25k, 1.6% for AGIs $25k-50k, 0.3% for AGIs $50k-75k, 0.6% for AGIs $75k-100k, 1.5% for AGIs over 100k)
Taxable dividends: $1,160 (reported on 25.4% of returns)
Here:
$1,160
State:
$4,306
(% of AGI for various income ranges: 0.6% for AGIs $10k-25k, 0.6% for AGIs $25k-50k, 0.3% for AGIs $50k-75k, 0.5% for AGIs $75k-100k, 0.9% for AGIs over 100k)
Net capital gain/loss: +$2,162 (reported on 18.4% of returns)
Here:
+$2,162
State:
+$17,321
(% of AGI for various income ranges: 5.6% for AGIs below $10k, -0.2% for AGIs $25k-50k, -0.4% for AGIs $50k-75k, 1.3% for AGIs $75k-100k, 2.1% for AGIs over 100k)
Profit/loss from business: +$4,661 (reported on 15.1% of returns)
Here:
+$4,661
State:
+$11,771
(% of AGI for various income ranges: -2.6% for AGIs below $10k, 4.9% for AGIs $25k-50k, 0.5% for AGIs $75k-100k, 1.6% for AGIs over 100k)
Profit/loss from farming: +$2,038 (reported on 7.0% of returns)
Here:
+$2,038
State:
+$2,327
IRA payment deduction: $2,722 (reported on 4.9% of returns)
61840:
$2,722
Illinois:
$3,087
Total itemized deductions: $17,677 (22% of AGI, reported on 34.3% of returns)
Here:
$17,677
State:
$20,239
Here:
21.9% of AGI
State:
19.5% of AGI
(% of AGI for various income ranges: 17.6% for AGIs $10k-25k, 10.4% for AGIs $25k-50k, 11.0% for AGIs $50k-75k, 11.9% for AGIs $75k-100k, 15.7% for AGIs over 100k)
Charity contributions deductions: $3,387 (4% of AGI, reported on 28.6% of returns)
Here:
$3,387
State:
$3,719
Here:
3.9% of AGI
State:
3.4% of AGI
(% of AGI for various income ranges: 14.2% for AGIs below $10k, 1.5% for AGIs $25k-50k, 1.3% for AGIs $50k-75k, 1.4% for AGIs $75k-100k, 3.3% for AGIs over 100k)
Total tax: $6,525 (reported on 80.8% of returns)
61840:
$6,525
State:
$9,882
(% of AGI for various income ranges: 3.9% for AGIs below $10k, 5.4% for AGIs $10k-25k, 7.7% for AGIs $25k-50k, 8.9% for AGIs $50k-75k, 10.5% for AGIs $75k-100k, 17.1% for AGIs over 100k)
Earned income credit: $1,742 (reported on 8.4% of returns)
Here:
$1,742
State:
$1,788
Percentage of individuals using paid preparers for their 2004 taxes: 63.2%
Here:
63%
State:
61%
(% for various income ranges: 50.0% for AGIs below $10k, 54.4% for AGIs $10k-25k, 74.2% for AGIs $25k-50k, 65.5% for AGIs $50k-75k, 66.7% for AGIs $75k-100k, 72.2% for AGIs over 100k)
Household received Food Stamps/SNAP in the past 12 months: 22 Household did not receive Food Stamps/SNAP in the past 12 months: 193
Women who did not have a birth in the past 12 months: 105 (17 now married, 89 unmarried)
Housing units in zip code 61840 with a mortgage: 76 (6 second mortgage) Median monthly owner costs for units with a mortgage: $1,421 Median monthly owner costs for units without a mortgage: $749
Residents with income below the poverty level in 2022:
This zip code:
7.0%
Whole state:
11.9%
Median number of rooms in houses and condos:
Here:
6.4
State:
6.4
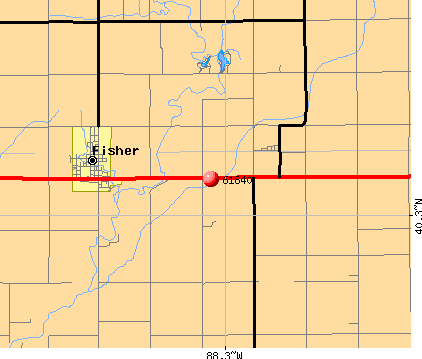
Notable locations in this zip code not listed on our city pages
Size of family households: 159 2-persons, 12 3-persons, 21 4-persons, 8 5-persons
Size of nonfamily households: 11 1-person, 4 2-persons
64 married couples with children.
9 single-parent households (9 women).
99.8% of residents of 61840 zip code speak English at home.
Foreign born population: 6 (1.3%) (0.0% of them are naturalized citizens)
:
1.3%
Whole state:
14.4%
100%United Kingdom, excluding England and Scotland
86%Sweden
31%English
25%German
12%American
10%Italian
8%Polish
5%African
5%Irish
Year of entry for the foreign-born population
02010 or later
02000 to 2009
01990 to 1999
8Before 1990
Facilities with environmental interests located in this zip code:
ILLINI FS INC (1009 CR 3000 N in DEWEY, IL)
AIR MINOR (AIRS/AFS) ENFORCEMENT/COMPLIANCE ACTIVITY (Integrated Compliance Information System) National Pollutant Discharge Elimination System NON-MAJOR (Tracking pollutant discharge elimination systems) - permit (Resource Conservation and Recovery Act (tracking hazardous waste)) Business SIC classification: FERTILIZERS, MIXING ONLY Organizations: TERRA INTERNATIONAL (CONTACT/OWNER)
Alternative names: CENEX LAND O LAKES AGRO DISTRIBUTION, TERRA INDUSTRIES, INC., TERRA INTERNATIONAL
RICHARD TARVIN INC (1096 CR-3000 N. in DEWEY, IL)
STATE MASTER (Illinois EPA Project) - National Pollutant Discharge Elimination System Permit National Pollutant Discharge Elimination System NON-MAJOR (Tracking pollutant discharge elimination systems) - permit Organizations: TARVIN, INC.?RICHARD (CONTACT/OWNER)
Alternative names: TARVIN, INC.?RICHARD, TARVIN, RICHARD INC.
DATA COMM FOR BUSINESS INC (2949 COUNTY RD 1000 E in DEWEY, IL)
TRI REPORTER (Tracking of toxic chemicals releasing facilities) Business SIC classification: COMMUNICATIONS EQUIPMENT
30.0%Bottled, tank, or LP gas
28.1%Utility gas
26.7%Electricity
15.5%Other fuel
Population in 1990: 548. Population change in the 1990s: +161 (+29.4%).
Place of birth for U.S.-born residents:
This state: 390
Northeast: 19
Midwest: 40
South: 53
West: 8
75% of the 61840 zip code residents lived in the same house 5 years ago. Out of people who lived in different houses, 74% lived in this county. Out of people who lived in different counties, 50% lived in Illinois.
96% of the 61840 zip code residents lived in the same house 1 year ago. Out of people who lived in different houses, 94% moved from this county.
Private vs. public school enrollment:
Students in private schools in grades 1 to 8 (elementary and middle school):
Here:
0.0%
Illinois:
13.3%
Students in private schools in grades 9 to 12 (high school):
Here:
0.0%
Illinois:
9.9%
Students in private undergraduate colleges:
Here:
0.0%
Illinois:
27.4%
Occupation by median earnings in the past 12 months ($)
46,870Health technologists and technicians
22,434Office and administrative support occupations
Top industries in this zip code by the number of employees in 2005:
Health Care and Social Assistance: Child Day Care Services (50-99 employees: 1 establishment)
Wholesale Trade: Other Electronic Parts and Equipment Merchant Wholesalers (10-19: 1)
Wholesale Trade: Grain and Field Bean Merchant Wholesalers (10-19: 1)
Construction: Electrical Contractors (5-9: 1)
Finance and Insurance: Commercial Banking (5-9: 1)
Construction: New Single-Family Housing Construction (except Operative Builders) (1-4: 2)
Other Services (except Public Administration): Religious Organizations (1-4: 2)
Other Services (except Public Administration): Appliance Repair and Maintenance (1-4: 1)
Fatal accident statistics in 2013:
Fatal accident count: 1
Vehicles involved in fatal accidents: 2
Fatal accidents caused by drunken drivers: 0
Fatalities: 2
Persons involved in fatal accidents: 3
Pedestrians involved in fatal accidents: 0
Home Mortgage Disclosure Act Aggregated Statistics For Year 2009 (Based on 2 partial tracts)
A) FHA, FSA/RHS & VA Home Purchase Loans
B) Conventional Home Purchase Loans
C) Refinancings
D) Home Improvement Loans
F) Non-occupant Loans on < 5 Family Dwellings (A B C & D)
G) Loans On Manufactured Home Dwelling (A B C & D)
Number
Average Value
Number
Average Value
Number
Average Value
Number
Average Value
Number
Average Value
Number
Average Value
LOANS ORIGINATED
7
$134,500
14
$183,956
89
$152,780
5
$103,810
2
$70,485
2
$85,740
APPLICATIONS APPROVED, NOT ACCEPTED
1
$116,470
2
$98,220
9
$156,070
0
$0
0
$0
1
$50,380
APPLICATIONS DENIED
1
$128,950
3
$96,907
14
$167,679
1
$55,460
0
$0
0
$0
APPLICATIONS WITHDRAWN
0
$0
1
$146,060
7
$161,770
0
$0
0
$0
0
$0
FILES CLOSED FOR INCOMPLETENESS
0
$0
0
$0
2
$185,340
0
$0
0
$0
0
$0
Aggregated Statistics For Year 2008 (Based on 2 partial tracts)
A) FHA, FSA/RHS & VA Home Purchase Loans
B) Conventional Home Purchase Loans
C) Refinancings
D) Home Improvement Loans
F) Non-occupant Loans on < 5 Family Dwellings (A B C & D)
G) Loans On Manufactured Home Dwelling (A B C & D)
Number
Average Value
Number
Average Value
Number
Average Value
Number
Average Value
Number
Average Value
Number
Average Value
LOANS ORIGINATED
6
$114,010
28
$173,309
43
$147,334
6
$38,670
5
$87,818
1
$58,700
APPLICATIONS APPROVED, NOT ACCEPTED
0
$0
2
$199,900
6
$142,588
1
$50,840
0
$0
0
$0
APPLICATIONS DENIED
3
$144,207
4
$80,655
16
$135,540
4
$86,548
0
$0
0
$0
APPLICATIONS WITHDRAWN
1
$139,120
4
$220,585
6
$150,523
0
$0
1
$61,930
0
$0
FILES CLOSED FOR INCOMPLETENESS
0
$0
0
$0
0
$0
1
$113,240
0
$0
0
$0
Aggregated Statistics For Year 2007 (Based on 2 partial tracts)
A) FHA, FSA/RHS & VA Home Purchase Loans
B) Conventional Home Purchase Loans
C) Refinancings
D) Home Improvement Loans
F) Non-occupant Loans on < 5 Family Dwellings (A B C & D)
G) Loans On Manufactured Home Dwelling (A B C & D)
Number
Average Value
Number
Average Value
Number
Average Value
Number
Average Value
Number
Average Value
Number
Average Value
LOANS ORIGINATED
2
$192,505
38
$130,657
44
$127,115
15
$46,405
6
$102,532
3
$51,767
APPLICATIONS APPROVED, NOT ACCEPTED
0
$0
4
$136,350
5
$88,742
2
$52,460
0
$0
0
$0
APPLICATIONS DENIED
0
$0
6
$134,268
14
$140,476
8
$34,202
0
$0
1
$57,770
APPLICATIONS WITHDRAWN
0
$0
2
$134,500
6
$136,195
1
$62,400
0
$0
0
$0
FILES CLOSED FOR INCOMPLETENESS
0
$0
1
$116,010
2
$180,950
0
$0
0
$0
0
$0
Aggregated Statistics For Year 2006 (Based on 2 partial tracts)
A) FHA, FSA/RHS & VA Home Purchase Loans
B) Conventional Home Purchase Loans
C) Refinancings
D) Home Improvement Loans
F) Non-occupant Loans on < 5 Family Dwellings (A B C & D)
G) Loans On Manufactured Home Dwelling (A B C & D)
Number
Average Value
Number
Average Value
Number
Average Value
Number
Average Value
Number
Average Value
Number
Average Value
LOANS ORIGINATED
2
$71,870
45
$134,048
32
$144,438
10
$38,224
5
$58,514
1
$40,670
APPLICATIONS APPROVED, NOT ACCEPTED
0
$0
4
$157,495
5
$168,980
2
$39,285
0
$0
0
$0
APPLICATIONS DENIED
0
$0
6
$130,957
17
$109,079
3
$71,950
0
$0
1
$82,730
APPLICATIONS WITHDRAWN
0
$0
0
$0
11
$133,660
0
$0
0
$0
0
$0
FILES CLOSED FOR INCOMPLETENESS
0
$0
1
$89,200
5
$127,844
0
$0
0
$0
0
$0
Aggregated Statistics For Year 2005 (Based on 2 partial tracts)
A) FHA, FSA/RHS & VA Home Purchase Loans
B) Conventional Home Purchase Loans
C) Refinancings
D) Home Improvement Loans
F) Non-occupant Loans on < 5 Family Dwellings (A B C & D)
G) Loans On Manufactured Home Dwelling (A B C & D)
Number
Average Value
Number
Average Value
Number
Average Value
Number
Average Value
Number
Average Value
Number
Average Value
LOANS ORIGINATED
1
$97,060
46
$145,643
44
$131,286
9
$48,377
4
$123,178
0
$0
APPLICATIONS APPROVED, NOT ACCEPTED
0
$0
3
$222,163
5
$152,988
0
$0
0
$0
1
$149,290
APPLICATIONS DENIED
0
$0
9
$146,003
21
$122,769
3
$55,310
1
$174,710
2
$68,870
APPLICATIONS WITHDRAWN
0
$0
1
$117,860
11
$171,224
1
$143,280
1
$179,330
0
$0
FILES CLOSED FOR INCOMPLETENESS
0
$0
1
$151,600
0
$0
0
$0
0
$0
0
$0
Aggregated Statistics For Year 2004 (Based on 2 partial tracts)
A) FHA, FSA/RHS & VA Home Purchase Loans
B) Conventional Home Purchase Loans
C) Refinancings
D) Home Improvement Loans
F) Non-occupant Loans on < 5 Family Dwellings (A B C & D)
G) Loans On Manufactured Home Dwelling (A B C & D)
Number
Average Value
Number
Average Value
Number
Average Value
Number
Average Value
Number
Average Value
Number
Average Value
LOANS ORIGINATED
5
$101,868
31
$125,748
60
$134,500
17
$48,368
4
$47,952
2
$82,040
APPLICATIONS APPROVED, NOT ACCEPTED
0
$0
2
$30,045
7
$112,447
0
$0
0
$0
1
$61,010
APPLICATIONS DENIED
2
$100,990
6
$149,445
29
$95,309
6
$47,145
0
$0
4
$55,925
APPLICATIONS WITHDRAWN
0
$0
1
$116,470
11
$109,709
1
$21,720
0
$0
0
$0
FILES CLOSED FOR INCOMPLETENESS
0
$0
0
$0
6
$146,980
0
$0
0
$0
0
$0
Aggregated Statistics For Year 2003 (Based on 2 partial tracts)
A) FHA, FSA/RHS & VA Home Purchase Loans
B) Conventional Home Purchase Loans
C) Refinancings
D) Home Improvement Loans
F) Non-occupant Loans on < 5 Family Dwellings (A B C & D)
Number
Average Value
Number
Average Value
Number
Average Value
Number
Average Value
Number
Average Value
LOANS ORIGINATED
5
$93,088
21
$99,087
98
$104,665
7
$23,836
4
$58,468
APPLICATIONS APPROVED, NOT ACCEPTED
0
$0
1
$143,740
9
$119,299
1
$45,300
0
$0
APPLICATIONS DENIED
0
$0
3
$98,603
26
$80,654
4
$25,538
0
$0
APPLICATIONS WITHDRAWN
0
$0
2
$94,520
11
$111,978
0
$0
0
$0
FILES CLOSED FOR INCOMPLETENESS
0
$0
1
$128,950
3
$120,173
0
$0
0
$0
Aggregated Statistics For Year 2002 (Based on 2 partial tracts)
A) FHA, FSA/RHS & VA Home Purchase Loans
B) Conventional Home Purchase Loans
C) Refinancings
D) Home Improvement Loans
F) Non-occupant Loans on < 5 Family Dwellings (A B C & D)
Number
Average Value
Number
Average Value
Number
Average Value
Number
Average Value
Number
Average Value
LOANS ORIGINATED
6
$84,660
32
$99,561
76
$107,693
5
$36,698
8
$86,548
APPLICATIONS APPROVED, NOT ACCEPTED
0
$0
1
$178,870
6
$89,282
1
$18,030
0
$0
APPLICATIONS DENIED
0
$0
4
$50,032
16
$83,341
3
$41,443
1
$170,090
APPLICATIONS WITHDRAWN
0
$0
3
$90,437
8
$126,759
0
$0
0
$0
FILES CLOSED FOR INCOMPLETENESS
0
$0
0
$0
4
$145,825
0
$0
0
$0
Aggregated Statistics For Year 2001 (Based on 2 partial tracts)
A) FHA, FSA/RHS & VA Home Purchase Loans
B) Conventional Home Purchase Loans
C) Refinancings
D) Home Improvement Loans
F) Non-occupant Loans on < 5 Family Dwellings (A B C & D)
Number
Average Value
Number
Average Value
Number
Average Value
Number
Average Value
Number
Average Value
LOANS ORIGINATED
5
$81,994
19
$77,479
62
$89,928
10
$33,510
3
$37,437
APPLICATIONS APPROVED, NOT ACCEPTED
0
$0
1
$66,560
5
$70,532
1
$30,040
0
$0
APPLICATIONS DENIED
0
$0
2
$94,750
19
$84,850
2
$28,425
1
$93,830
APPLICATIONS WITHDRAWN
0
$0
0
$0
7
$100,627
2
$5,545
0
$0
FILES CLOSED FOR INCOMPLETENESS
0
$0
0
$0
1
$69,790
0
$0
0
$0
Aggregated Statistics For Year 2000 (Based on 2 partial tracts)
A) FHA, FSA/RHS & VA Home Purchase Loans
B) Conventional Home Purchase Loans
C) Refinancings
D) Home Improvement Loans
F) Non-occupant Loans on < 5 Family Dwellings (A B C & D)
Number
Average Value
Number
Average Value
Number
Average Value
Number
Average Value
Number
Average Value
LOANS ORIGINATED
1
$105,380
22
$81,011
21
$75,889
6
$27,502
1
$93,360
APPLICATIONS APPROVED, NOT ACCEPTED
0
$0
1
$54,540
3
$61,320
0
$0
0
$0
APPLICATIONS DENIED
0
$0
2
$92,210
12
$64,322
2
$24,960
0
$0
APPLICATIONS WITHDRAWN
0
$0
0
$0
6
$77,110
0
$0
0
$0
FILES CLOSED FOR INCOMPLETENESS
0
$0
1
$47,610
0
$0
0
$0
0
$0
Aggregated Statistics For Year 1999 (Based on 1 partial tract)
A) FHA, FSA/RHS & VA Home Purchase Loans
B) Conventional Home Purchase Loans
C) Refinancings
D) Home Improvement Loans
F) Non-occupant Loans on < 5 Family Dwellings (A B C & D)


 Nearest zip codes: 61843, 61845, 61866, 61853, 61822, 61878.


