Estimated zip code population in 2022: 1,389 Zip code population in 2010: 1,438 Zip code population in 2000: 1,573
Houses and condos: 655 Renter-occupied apartments: 83
% of renters here:
14%
State:
33%
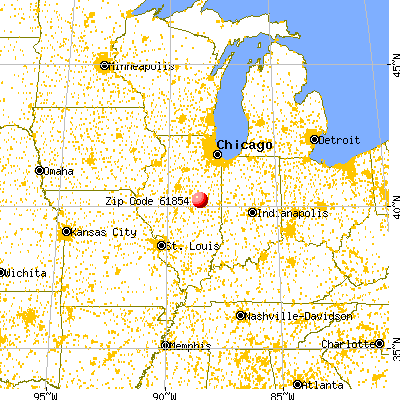
March 2022 cost of living index in zip code 61854: 85.1 (less than average, U.S. average is 100)
Land area: 53.6 sq. mi. Water area: 0.0 sq. mi.
Population density: 26 people per square mile
(very low).
OSM Map
General Map
Google Map
MSN Map
OSM Map
General Map
Google Map
MSN Map
OSM Map
General Map
Google Map
MSN Map
OSM Map
General Map
Google Map
MSN Map
Please wait while loading the map...
Real estate property taxes paid for housing units in 2022:
This zip code:
1.9% ($3,017)
Illinois:
2.0% ($4,912)
Median real estate property taxes paid for housing units with mortgages in 2022: $2,730 (1.8%) Median real estate property taxes paid for housing units with no mortgage in 2022: $3,343 (1.8%)
Business Search- 14 Million verified businesses
Males: 687
(49.5%)
Females: 701
(50.5%)
For population 25 years and over in 61854:
High school or higher: 96.1%
Bachelor's degree or higher: 25.3%
Graduate or professional degree: 11.4%
Unemployed: 1.7%
Mean travel time to work (commute): 24.2 minutes
For population 15 years and over in 61854:
Never married: 16.8%
Now married: 68.9%
Separated: 0.5%
Widowed: 3.5%
Divorced: 10.4%
Zip code 61854 compared to state average:
Median house value below state average.
Unemployed percentage below state average.
Black race population percentage significantly below state average.
Hispanic race population percentage significantly below state average.
Median age above state average.
Foreign-born population percentage significantly below state average.
Renting percentage significantly below state average.
Length of stay since moving in significantly above state average.
Averages for the 2020 tax year for zip code 61854, filed in 2021:
Average Adjusted Gross Income (AGI) in 2020: $64,188 (Individual Income Tax Returns)
Here:
$64,188
State:
$82,626
Salary/wage: $53,415 (reported on 81.1% of returns)
Here:
$53,415
State:
$66,640
(% of AGI for various income ranges: 1215.3% for AGIs below $25k, 3617.9% for AGIs $25k-50k, 6223.3% for AGIs $50k-75k, 10602.0% for AGIs $75k-100k, 14032.5% for AGIs $100k-200k)
Taxable interest for individuals: $864 (reported on 33.8% of returns)
This zip code:
$864
Illinois:
$2,376
(% of AGI for various income ranges: 8.7% for AGIs below $25k, 7.9% for AGIs $25k-50k, 38.9% for AGIs $50k-75k, 62.0% for AGIs $75k-100k, 157.5% for AGIs $100k-200k)
Ordinary dividends: $2,420 (reported on 20.3% of returns)
Here:
$2,420
State:
$9,061
(% of AGI for various income ranges: 18.7% for AGIs below $25k, 72.2% for AGIs $50k-75k, 88.0% for AGIs $75k-100k, 282.5% for AGIs $100k-200k)
Net capital gain/loss in AGI: +$9,045 (reported on 14.9% of returns)
Here:
+$9,045
State:
+$31,684
(% of AGI for various income ranges: 18.0% for AGIs below $25k, 113.3% for AGIs $50k-75k, 1082.5% for AGIs $100k-200k)
Profit/loss from business: +$4,922 (reported on 12.2% of returns)
Here:
+$4,922
State:
+$12,175
(% of AGI for various income ranges: 74.0% for AGIs below $25k, 92.9% for AGIs $25k-50k, 252.5% for AGIs $100k-200k)
Taxable individual retirement arrangement distribution: $18,412 (reported on 10.8% of returns)
61854:
$18,412
Illinois:
$21,613
(% of AGI for various income ranges: 164.0% for AGIs below $25k, 690.0% for AGIs $50k-75k, 757.5% for AGIs $100k-200k)
Total itemized deductions: $24,433 (reported on 4.1% of returns)
Here:
$24,433
State:
$34,948
(% of AGI for various income ranges: 1466.0% for AGIs $75k-100k)
Charity contributions: $7,850 (reported on 2.7% of returns)
Here:
$7,850
State:
$13,122
(% of AGI for various income ranges: 314.0% for AGIs $75k-100k)
Taxes paid: $6,700 (reported on 4.1% of returns)
61854:
$6,700
State:
$8,563
(% of AGI for various income ranges: 402.0% for AGIs $75k-100k)
Earned income credit: $2,289 (reported on 12.2% of returns)
Here:
$2,289
State:
$2,311
(% of AGI for various income ranges: 91.3% for AGIs below $25k, 49.3% for AGIs $25k-50k)
Percentage of individuals using paid preparers for their 2020 taxes: 97.3%
Here:
97%
State:
93%
(% for various income ranges: 95.0% for AGIs below $25k, 94.4% for AGIs $25k-50k, 100.0% for AGIs $50k-75k, 100.0% for AGIs $75k-100k, 100.0% for AGIs $100k-200k, 100.0% for AGIs over 200k)
Averages for the 2012 tax year for zip code 61854, filed in 2013:
Average Adjusted Gross Income (AGI) in 2012: $53,785 (Individual Income Tax Returns)
Here:
$53,785
State:
$68,058
Salary/wage: $42,706 (reported on 82.7% of returns)
Here:
$42,706
State:
$55,396
(% of AGI for various income ranges: 72.9% for AGIs below $25k, 76.4% for AGIs $25k-50k, 74.4% for AGIs $50k-75k, 73.0% for AGIs $75k-100k, 51.0% for AGIs $100k-200k)
Taxable interest for individuals: $963 (reported on 40.0% of returns)
This zip code:
$963
Illinois:
$1,969
(% of AGI for various income ranges: 0.9% for AGIs below $25k, 1.3% for AGIs $25k-50k, 0.6% for AGIs $50k-75k, 0.2% for AGIs $75k-100k, 0.7% for AGIs $100k-200k)
Ordinary dividends: $2,036 (reported on 18.7% of returns)
Here:
$2,036
State:
$7,786
(% of AGI for various income ranges: 0.7% for AGIs below $25k, 0.3% for AGIs $25k-50k, 0.1% for AGIs $50k-75k, 0.5% for AGIs $75k-100k, 1.3% for AGIs $100k-200k)
Net capital gain/loss in AGI: +$2,290 (reported on 13.3% of returns)
Here:
+$2,290
State:
+$22,183
(% of AGI for various income ranges: 2.0% for AGIs $25k-50k, 0.3% for AGIs $75k-100k, 0.5% for AGIs $100k-200k)
Profit/loss from business: +$8,850 (reported on 13.3% of returns)
Here:
+$8,850
State:
+$12,903
(% of AGI for various income ranges: 3.9% for AGIs below $25k, 6.7% for AGIs $25k-50k, 4.4% for AGIs $75k-100k)
Taxable individual retirement arrangement distribution: $13,900 (reported on 12.0% of returns)
61854:
$13,900
Illinois:
$17,929
(% of AGI for various income ranges: 10.9% for AGIs below $25k, 2.8% for AGIs $50k-75k, 9.5% for AGIs $75k-100k)
Total itemized deductions: $16,457 (19% of AGI, reported on 30.7% of returns)
Here:
$16,457
State:
$26,433
Here:
19.3% of AGI
State:
19.2% of AGI
(% of AGI for various income ranges: 12.2% for AGIs $25k-50k, 9.0% for AGIs $50k-75k, 9.0% for AGIs $75k-100k, 10.2% for AGIs $100k-200k)
Charity contributions: $2,588 (reported on 21.3% of returns)
Here:
$2,588
State:
$4,525
(% of AGI for various income ranges: 0.6% for AGIs $25k-50k, 0.7% for AGIs $50k-75k, 1.3% for AGIs $75k-100k, 1.4% for AGIs $100k-200k)
Taxes paid: $6,935 (reported on 30.7% of returns)
61854:
$6,935
State:
$11,968
(% of AGI for various income ranges: 3.8% for AGIs $25k-50k, 3.4% for AGIs $50k-75k, 3.9% for AGIs $75k-100k, 5.1% for AGIs $100k-200k)
Earned income credit: $2,100 (reported on 12.0% of returns)
Here:
$2,100
State:
$2,349
(% of AGI for various income ranges: 4.6% for AGIs below $25k, 1.0% for AGIs $25k-50k)
Percentage of individuals using paid preparers for their 2012 taxes: 54.7%
Here:
55%
State:
57%
(% for various income ranges: 50.0% for AGIs below $25k, 52.6% for AGIs $25k-50k, 61.5% for AGIs $50k-75k, 55.6% for AGIs $75k-100k, 60.0% for AGIs $100k-200k)
Averages for the 2004 tax year for zip code 61854, filed in 2005:
Average Adjusted Gross Income (AGI) in 2004: $44,402 (Individual Income Tax Returns)
Here:
$44,402
State:
$54,625
Salary/wage: $37,541 (reported on 86.1% of returns)
Here:
$37,541
State:
$46,811
(% of AGI for various income ranges: 83.1% for AGIs below $10k, 73.2% for AGIs $10k-25k, 74.6% for AGIs $25k-50k, 77.9% for AGIs $50k-75k, 80.8% for AGIs $75k-100k, 57.6% for AGIs over 100k)
Taxable interest for individuals: $1,467 (reported on 51.4% of returns)
This zip code:
$1,467
Illinois:
$2,101
(% of AGI for various income ranges: 7.1% for AGIs below $10k, 2.9% for AGIs $10k-25k, 2.2% for AGIs $25k-50k, 1.2% for AGIs $50k-75k, 0.8% for AGIs $75k-100k, 1.8% for AGIs over 100k)
Taxable dividends: $1,425 (reported on 22.5% of returns)
Here:
$1,425
State:
$4,306
(% of AGI for various income ranges: 0.7% for AGIs below $10k, 1.0% for AGIs $10k-25k, 1.4% for AGIs $25k-50k, 0.8% for AGIs $50k-75k, 0.4% for AGIs $75k-100k, 0.1% for AGIs over 100k)
Net capital gain/loss: +$8,396 (reported on 15.0% of returns)
Here:
+$8,396
State:
+$17,321
(% of AGI for various income ranges: -1.1% for AGIs below $10k, -0.4% for AGIs $10k-25k, 0.4% for AGIs $25k-50k, 0.5% for AGIs $50k-75k, 0.1% for AGIs $75k-100k, 11.5% for AGIs over 100k)
Profit/loss from business: +$2,554 (reported on 13.6% of returns)
Here:
+$2,554
State:
+$11,771
(% of AGI for various income ranges: 1.4% for AGIs $10k-25k, 1.2% for AGIs $25k-50k, 0.8% for AGIs $50k-75k, 1.4% for AGIs $75k-100k, -0.3% for AGIs over 100k)
Profit/loss from farming: +$457 (reported on 4.7% of returns)
Here:
+$457
State:
+$2,327
IRA payment deduction: $2,824 (reported on 2.3% of returns)
61854:
$2,824
Illinois:
$3,087
Total itemized deductions: $14,369 (21% of AGI, reported on 27.4% of returns)
Here:
$14,369
State:
$20,239
Here:
21.2% of AGI
State:
19.5% of AGI
(% of AGI for various income ranges: 19.9% for AGIs $10k-25k, 8.6% for AGIs $25k-50k, 7.5% for AGIs $50k-75k, 10.3% for AGIs $75k-100k, 6.8% for AGIs over 100k)
Charity contributions deductions: $2,171 (3% of AGI, reported on 18.9% of returns)
Here:
$2,171
State:
$3,719
Here:
2.9% of AGI
State:
3.4% of AGI
(% of AGI for various income ranges: 0.9% for AGIs $10k-25k, 0.8% for AGIs $25k-50k, 0.8% for AGIs $50k-75k, 1.7% for AGIs $75k-100k, 0.6% for AGIs over 100k)
Total tax: $6,079 (reported on 77.1% of returns)
61854:
$6,079
State:
$9,882
(% of AGI for various income ranges: 2.1% for AGIs below $10k, 4.5% for AGIs $10k-25k, 7.1% for AGIs $25k-50k, 8.6% for AGIs $50k-75k, 11.4% for AGIs $75k-100k, 18.0% for AGIs over 100k)
Earned income credit: $1,568 (reported on 10.9% of returns)
Here:
$1,568
State:
$1,788
Percentage of individuals using paid preparers for their 2004 taxes: 57.8%
Here:
58%
State:
61%
(% for various income ranges: 44.8% for AGIs below $10k, 54.3% for AGIs $10k-25k, 58.9% for AGIs $25k-50k, 64.1% for AGIs $50k-75k, 65.3% for AGIs $75k-100k, 72.7% for AGIs over 100k)
Household received Food Stamps/SNAP in the past 12 months: 12 Household did not receive Food Stamps/SNAP in the past 12 months: 561
Women who had a birth in the past 12 months: 16 (16 now married, 0 unmarried) Women who did not have a birth in the past 12 months: 220 (145 now married, 72 unmarried)
Housing units in zip code 61854 with a mortgage: 241 Median monthly owner costs for units with a mortgage: $1,331 Median monthly owner costs for units without a mortgage: $658
Residents with income below the poverty level in 2022:
This zip code:
5.9%
Whole state:
11.9%
Residents with income below 50% of the poverty level in 2022:
This zip code:
2.1%
Whole state:
5.7%
Median number of rooms in houses and condos:
Here:
6.7
State:
6.4
Median number of rooms in apartments:
Here:
6.4
State:
4.1
Notable locations in this zip code not listed on our city pages
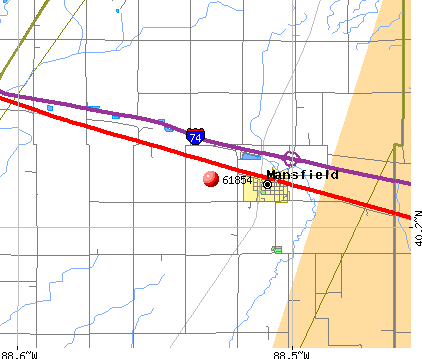
Notable locations in zip code 61854: Mansfield Public Library (A), Northern Piatt County Fire Protection District (B). Display/hide their locations on the map
Size of family households: 215 2-persons, 94 3-persons, 94 4-persons, 17 5-persons
Size of nonfamily households: 149 1-person, 10 2-persons
183 married couples with children.
31 single-parent households (4 men, 27 women).
94.1% of residents of 61854 zip code speak English at home.
4.5% of residents speak Spanish at home (73% very well, 12% well, 15% not well).
0.6% of residents speak other Indo-European language at home (100% very well).
0.5% of residents speak Asian or Pacific Island language at home (100% well).
Foreign born population: 18 (1.4%) (10.6% of them are naturalized citizens)
This zip code:
1.4%
Whole state:
14.4%
84%Honduras
5%Croatia
30%English
21%German
18%American
4%Italian
2%Irish
2%British
2%Norwegian
Year of entry for the foreign-born population
02010 or later
282000 to 2009
01990 to 1999
1Before 1990
Major facilities with environmental interests located in this zip code:
COMMUNITY GRAIN CO (RR #1 in MANSFIELD, IL)
STATE MASTER (Illinois EPA Project) - AIR PROGRAM AIR MINOR (AIRS/AFS) Business SIC classification: GRAIN AND FIELD BEANS Alternative names: COMMUNITY GRAIN COMPANY BLUE RIDGE ELVTR
GRAND PRAIRIE COOP INC (1008 CASS ST in MANSFIELD, IL)
STATE MASTER (Illinois EPA Project) - AIR PROGRAM AIR MINOR (AIRS/AFS) CRITERIA AND HAZARDOUS AIR POLLUTANT INVENTORY (Inventory of air pollution sources) Business SIC classification: GRAIN AND FIELD BEANS
MITCHELLS TRUCKING (#3 DAVIS COURT in MANSFIELD, IL)
STATE MASTER (Illinois EPA Project) - National Pollutant Discharge Elimination System Permit National Pollutant Discharge Elimination System NON-MAJOR (Tracking pollutant discharge elimination systems) - permit Organizations: MITCHELL'S TRUCKING (CONTACT/OWNER)
O MALLEY GRAIN INC (LIBERTY & NEWTON ST. in MANSFIELD, IL)
STATE MASTER (Illinois EPA Project) - AIR PROGRAM AIR MINOR (AIRS/AFS) CRITERIA AND HAZARDOUS AIR POLLUTANT INVENTORY (Inventory of air pollution sources) Business SIC classification: GRAIN AND FIELD BEANS Alternative names: O'MALLEY GRAIN INC
GRAND PRAIRIE CO-OP INC (R. R. 1 in MANSFIELD, IL)
STATE MASTER (Illinois EPA Project) - AIR PROGRAM AIR MINOR (AIRS/AFS) Business SIC classification: NONCLASSIFIABLE ESTABLISHMENTS
JAY REYNOLDS (#20 SHORT ST in MANSFIELD, IL)
STATE MASTER (Illinois EPA Project) - AIR PROGRAM AIR MINOR (AIRS/AFS) Business SIC classification: NONCLASSIFIABLE ESTABLISHMENTS
MARK SHEPPARD (106 WEST SOUTH ST in MANSFIELD, IL)
STATE MASTER (Illinois EPA Project) - AIR PROGRAM AIR MINOR (AIRS/AFS) Business SIC classification: NONCLASSIFIABLE ESTABLISHMENTS
PIATT COUNTY SERVICE CO (MANSFIELD PLANT in MANSFIELD, IL)
STATE MASTER (Illinois EPA Project) - AIR PROGRAM AIR MINOR (AIRS/AFS) Business SIC classification: FARM SUPPLIES
DAVID SCHEURICH (2950N 1475E in MANSFIELD, IL)
STATE MASTER (Illinois EPA Project) - AIR PROGRAM AIR MINOR (AIRS/AFS) Business SIC classification: NONCLASSIFIABLE ESTABLISHMENTS
MANSFIELD ELEMENTARY SCHOOL (PO BOX 69 in MANSFIELD, IL)
(Geographic Names Information System) (National Center for Education Statistics) - STATE ID-1702001802005 Organizations: BLUE RIDGE COMM UNIT SCH DIST 18 (SCHOOL DISTRICT)
BLUE RIDGE JUNIOR HIGH SCHOOL (PO BOX 69 in MANSFIELD, IL)
(Geographic Names Information System) (National Center for Education Statistics) - STATE ID-1702001801001 Organizations: BLUE RIDGE COMM UNIT SCH DIST 18 (SCHOOL DISTRICT)
PIATT COUNTY SERVICE CO (RTE 150 in MANSFIELD, IL)
(Resource Conservation and Recovery Act (tracking hazardous waste))
MANSFIELD GRAIN INC (PO BOX 327 in MANSFIELD, IL)
AIR MINOR (AIRS/AFS) CRITERIA AND HAZARDOUS AIR POLLUTANT INVENTORY (Inventory of air pollution sources) Business SIC classification: GRAIN AND FIELD BEANS
Housing units lacking complete plumbing facilities: 1.2%
68.0%Utility gas
17.7%Electricity
14.7%Bottled, tank, or LP gas
Population in 1990: 1,407. Population change in the 1990s: +166 (+11.8%).
Place of birth for U.S.-born residents:
This state: 1,226
Northeast: 29
Midwest: 71
South: 21
West: 3
66% of the 61854 zip code residents lived in the same house 5 years ago. Out of people who lived in different houses, 31% lived in this county. Out of people who lived in different counties, 50% lived in Illinois.
88% of the 61854 zip code residents lived in the same house 1 year ago. Out of people who lived in different houses, 34% moved from this county. Out of people who lived in different houses, 69% moved from different county within same state.
Private vs. public school enrollment:
Students in private schools in grades 1 to 8 (elementary and middle school): 46
Here:
45.4%
Illinois:
13.3%
Students in private schools in grades 9 to 12 (high school):
Here:
0.0%
Illinois:
9.9%
Students in private undergraduate colleges: 4
Here:
13.9%
Illinois:
27.4%
Occupation by median earnings in the past 12 months ($)
155,332Business and financial operations occupations
70,701Health diagnosing and treating practitioners and other technical occupations
64,200Health technologists and technicians
64,101Production occupations
63,497Computer and mathematical occupations
59,576Construction and extraction occupations
Top industries in this zip code by the number of employees in 2005:
Management of Companies and Enterprises: Offices of Bank Holding Companies (20-49 employees: 1 establishment)
Construction: Commercial and Institutional Building Construction (10-19: 1)
Administrative and Support and Waste Management and Remediation Services: Other Services to Buildings and Dwellings (10-19: 1)
Finance and Insurance: Commercial Banking (10-19: 1)
Construction: Poured Concrete Foundation and Structure Contractors (10-19: 1)
Accommodation and Food Services: Drinking Places (Alcoholic Beverages) (5-9: 1)
Administrative and Support and Waste Management and Remediation Services: Solid Waste Collection (5-9: 1)
2002 - 2018 National Fire Incident Reporting System (NFIRS) incidents
Based on the data from the years 2002 - 2018 the average number of fires per year is 13. The highest number of reported fires - 29 took place in 2005, and the least - 6 in 2015. The data has a decreasing trend.
When looking into fire subcategories, the most incidents belonged to: Outside Fires (48.0%), and Structure Fires (26.2%).
Fire incident types reported to NFIRS in Zip Code 61854


 Nearest zip codes: 61853, 61839, 61884, 61724, 61842, 61875.


 Based on the data from the years 2002 - 2018 the average number of fires per year is 13. The highest number of reported fires - 29 took place in 2005, and the least - 6 in 2015. The data has a decreasing trend.
 When looking into fire subcategories, the most incidents belonged to: Outside Fires (48.0%), and Structure Fires (26.2%).