Estimated zip code population in 2022: 684 Zip code population in 2010: 510 Zip code population in 2000: 511
Houses and condos: 247 Renter-occupied apartments: 26
% of renters here:
11%
State:
33%
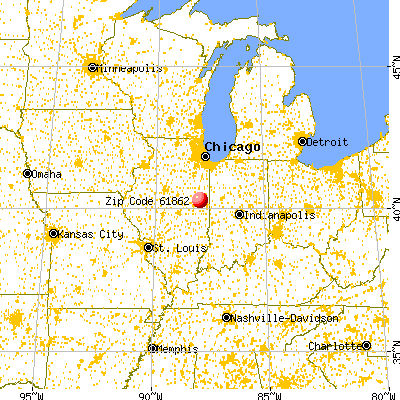
March 2022 cost of living index in zip code 61862: 83.0 (low, U.S. average is 100)
Land area: 40.3 sq. mi. Water area: 0.1 sq. mi.
Population density: 17 people per square mile
(very low).
OSM Map
General Map
Google Map
MSN Map
OSM Map
General Map
Google Map
MSN Map
OSM Map
General Map
Google Map
MSN Map
OSM Map
General Map
Google Map
MSN Map
Please wait while loading the map...
Real estate property taxes paid for housing units in 2022:
This zip code:
1.9% ($2,764)
Illinois:
2.0% ($4,912)
Median real estate property taxes paid for housing units with mortgages in 2022: $2,980 (1.8%) Median real estate property taxes paid for housing units with no mortgage in 2022: $2,371 (2.1%)
Business Search- 14 Million verified businesses
Males: 372
(54.5%)
Females: 311
(45.5%)
For population 25 years and over in 61862:
High school or higher: 98.3%
Bachelor's degree or higher: 29.7%
Graduate or professional degree: 9.8%
Mean travel time to work (commute): 22.6 minutes
For population 15 years and over in 61862:
Never married: 17.8%
Now married: 65.1%
Separated: 0.5%
Widowed: 6.0%
Divorced: 10.5%
Zip code 61862 compared to state average:
Median household income above state average.
Median house value below state average.
Unemployed percentage significantly below state average.
Black race population percentage significantly below state average.
Hispanic race population percentage significantly below state average.
Foreign-born population percentage significantly below state average.
Renting percentage significantly below state average.
Length of stay since moving in significantly above state average.
Averages for the 2020 tax year for zip code 61862, filed in 2021:
Average Adjusted Gross Income (AGI) in 2020: $68,829 (Individual Income Tax Returns)
Here:
$68,829
State:
$82,626
Salary/wage: $46,125 (reported on 83.3% of returns)
Here:
$46,125
State:
$66,640
(% of AGI for various income ranges: 1065.0% for AGIs below $25k, 3925.0% for AGIs $25k-50k, 4415.0% for AGIs $50k-75k, 19165.0% for AGIs $100k-200k)
Taxable interest for individuals: $367 (reported on 37.5% of returns)
This zip code:
$367
Illinois:
$2,376
(% of AGI for various income ranges: 10.0% for AGIs below $25k, 17.5% for AGIs $50k-75k, 110.0% for AGIs $100k-200k)
Ordinary dividends: $1,150 (reported on 16.7% of returns)
Here:
$1,150
State:
$9,061
(% of AGI for various income ranges: 115.0% for AGIs $50k-75k)
Net capital gain/loss in AGI: +$4,325 (reported on 16.7% of returns)
Here:
+$4,325
State:
+$31,684
(% of AGI for various income ranges: )
Profit/loss from business: +$4,700 (reported on 12.5% of returns)
Here:
+$4,700
State:
+$12,175
(% of AGI for various income ranges: 352.5% for AGIs $50k-75k)
Earned income credit: $1,800 (reported on 12.5% of returns)
Here:
$1,800
State:
$2,311
(% of AGI for various income ranges: 135.0% for AGIs below $25k)
Percentage of individuals using paid preparers for their 2020 taxes: 100.0%
Here:
100%
State:
93%
(% for various income ranges: 100.0% for AGIs below $25k, 100.0% for AGIs $25k-50k, 100.0% for AGIs $50k-75k, 100.0% for AGIs $75k-100k, 100.0% for AGIs $100k-200k)
Averages for the 2012 tax year for zip code 61862, filed in 2013:
Average Adjusted Gross Income (AGI) in 2012: $55,471 (Individual Income Tax Returns)
Here:
$55,471
State:
$68,058
Salary/wage: $40,168 (reported on 79.2% of returns)
Here:
$40,168
State:
$55,396
(% of AGI for various income ranges: 76.1% for AGIs below $25k, 72.6% for AGIs $25k-50k, 55.4% for AGIs $50k-75k, 69.4% for AGIs $75k-100k, 45.8% for AGIs $100k-200k)
Taxable interest for individuals: $511 (reported on 37.5% of returns)
This zip code:
$511
Illinois:
$1,969
(% of AGI for various income ranges: 0.6% for AGIs $25k-50k, 0.3% for AGIs $50k-75k, 0.4% for AGIs $100k-200k)
Ordinary dividends: $567 (reported on 12.5% of returns)
Here:
$567
State:
$7,786
Net capital gain/loss in AGI: +$200 (reported on 8.3% of returns)
Here:
+$200
State:
+$22,183
Profit/loss from business: +$2,475 (reported on 16.7% of returns)
Here:
+$2,475
State:
+$12,903
Total itemized deductions: $18,350 (20% of AGI, reported on 25.0% of returns)
Here:
$18,350
State:
$26,433
Here:
19.8% of AGI
State:
19.2% of AGI
Charity contributions: $3,875 (reported on 16.7% of returns)
Here:
$3,875
State:
$4,525
Taxes paid: $6,467 (reported on 25.0% of returns)
61862:
$6,467
State:
$11,968
Earned income credit: $1,300 (reported on 12.5% of returns)
Here:
$1,300
State:
$2,349
(% of AGI for various income ranges: 4.8% for AGIs below $25k)
Percentage of individuals using paid preparers for their 2012 taxes: 70.8%
Here:
71%
State:
57%
(% for various income ranges: 71.4% for AGIs below $25k, 66.7% for AGIs $25k-50k, 125.0% for AGIs $50k-75k, 75.0% for AGIs $100k-200k)
Averages for the 2004 tax year for zip code 61862, filed in 2005:
Average Adjusted Gross Income (AGI) in 2004: $41,862 (Individual Income Tax Returns)
Here:
$41,862
State:
$54,625
Salary/wage: $35,467 (reported on 83.5% of returns)
Here:
$35,467
State:
$46,811
(% of AGI for various income ranges: 161.5% for AGIs below $10k, 74.5% for AGIs $10k-25k, 71.9% for AGIs $25k-50k, 77.8% for AGIs $50k-75k, 73.6% for AGIs $75k-100k, 56.2% for AGIs over 100k)
Taxable interest for individuals: $842 (reported on 52.4% of returns)
This zip code:
$842
Illinois:
$2,101
(% of AGI for various income ranges: 1.8% for AGIs below $10k, 1.5% for AGIs $10k-25k, 2.8% for AGIs $25k-50k, 0.5% for AGIs $50k-75k, 0.1% for AGIs $75k-100k, 0.6% for AGIs over 100k)
Taxable dividends: $455 (reported on 21.7% of returns)
Here:
$455
State:
$4,306
(% of AGI for various income ranges: 0.6% for AGIs below $10k, 0.7% for AGIs $25k-50k, 0.2% for AGIs $50k-75k, 0.2% for AGIs $75k-100k)
Profit/loss from business: +$2,049 (reported on 16.1% of returns)
Here:
+$2,049
State:
+$11,771
Profit/loss from farming: +$4,000 (reported on 17.3% of returns)
Here:
+$4,000
State:
+$2,327
Total itemized deductions: $12,909 (18% of AGI, reported on 21.7% of returns)
Here:
$12,909
State:
$20,239
Here:
17.9% of AGI
State:
19.5% of AGI
(% of AGI for various income ranges: 12.2% for AGIs $25k-50k, 5.6% for AGIs $50k-75k, 8.7% for AGIs $75k-100k, 4.7% for AGIs over 100k)
Charity contributions deductions: $1,867 (2% of AGI, reported on 17.7% of returns)
Here:
$1,867
State:
$3,719
Here:
2.3% of AGI
State:
3.4% of AGI
Total tax: $6,454 (reported on 72.0% of returns)
61862:
$6,454
State:
$9,882
(% of AGI for various income ranges: 4.1% for AGIs below $10k, 4.5% for AGIs $10k-25k, 8.2% for AGIs $25k-50k, 10.3% for AGIs $50k-75k, 10.7% for AGIs $75k-100k, 16.9% for AGIs over 100k)
Earned income credit: $1,875 (reported on 12.6% of returns)
Here:
$1,875
State:
$1,788
Percentage of individuals using paid preparers for their 2004 taxes: 69.7%
Here:
70%
State:
61%
(% for various income ranges: 54.7% for AGIs below $10k, 80.3% for AGIs $10k-25k, 69.8% for AGIs $25k-50k, 65.7% for AGIs $50k-75k, 73.9% for AGIs $75k-100k, 78.9% for AGIs over 100k)
Household received Food Stamps/SNAP in the past 12 months: 13 Household did not receive Food Stamps/SNAP in the past 12 months: 215
Women who had a birth in the past 12 months: 6 (3 now married, 2 unmarried) Women who did not have a birth in the past 12 months: 95 (53 now married, 40 unmarried)
Housing units in zip code 61862 with a mortgage: 89 (8 second mortgage, 7 both second mortgage and home equity loan) Median monthly owner costs for units with a mortgage: $1,345 Median monthly owner costs for units without a mortgage: $539
Residents with income below the poverty level in 2022:
This zip code:
1.8%
Whole state:
11.9%
Median number of rooms in houses and condos:
Here:
5.7
State:
6.4
Median number of rooms in apartments:
Here:
6.1
State:
4.1
Notable locations in this zip code not listed on our city pages
Cemeteries: Welles Cemetery (1), Patton Cemetery (2), Saint Lawrence Cemetery (3), Tomlinson Cemetery (4), Chenoweth Cemetery (5). Display/hide their locations on the map
Size of family households: 98 2-persons, 12 3-persons, 40 4-persons, 15 5-persons, 11 6-persons
Size of nonfamily households: 36 1-person, 9 2-persons, 6 5-persons
160 married couples with children.
0 single-parent households ().
98.8% of residents of 61862 zip code speak English at home.
1.1% of residents speak Spanish at home (100% very well).
Foreign born population: 0 (0.0%)
:
0.0%
Whole state:
14.4%
56%German
17%Irish
9%American
3%Italian
0%Polish
0%Scottish
Year of entry for the foreign-born population
02010 or later
02000 to 2009
01990 to 1999
6Before 1990
Facilities with environmental interests located in this zip code:
PENFIELD WATER DISTRICT WTP (CORNER SOUTH & FRANKLIN in PENFIELD, IL)
STATE MASTER (Illinois EPA Project) - National Pollutant Discharge Elimination System Permit National Pollutant Discharge Elimination System NON-MAJOR (Tracking pollutant discharge elimination systems) - permit Business SIC classification: WATER SUPPLY
ROBERTS?GERALD D. (3342 COUNTY ROAD #2700 E. in PENFIELD, IL)
National Pollutant Discharge Elimination System NON-MAJOR (Tracking pollutant discharge elimination systems) - permit Organizations: GERALD D. ROBERTS (CONTACT/OWNER)
Alternative names: ROBERTS, GERALD D.
ILLINI FS INC. (2472 CR - 2700 E in PENFIELD, IL)
ENFORCEMENT/COMPLIANCE ACTIVITY (Integrated Compliance Information System)
Housing units lacking complete plumbing facilities: 2.6% Housing units lacking complete kitchen facilities: 2.7%
33.6%Utility gas
31.0%Bottled, tank, or LP gas
23.9%Electricity
6.6%Other fuel
4.9%Wood
0.9%No fuel used
Population in 1990: 601.
Place of birth for U.S.-born residents:
This state: 623
Northeast: 7
Midwest: 9
South: 26
West: 7
64% of the 61862 zip code residents lived in the same house 5 years ago. Out of people who lived in different houses, 69% lived in this county. Out of people who lived in different counties, 50% lived in Illinois.
91% of the 61862 zip code residents lived in the same house 1 year ago. Out of people who lived in different houses, 90% moved from this county.
Private vs. public school enrollment:
Students in private schools in grades 1 to 8 (elementary and middle school): 5
Here:
5.5%
Illinois:
13.3%
Students in private schools in grades 9 to 12 (high school): 1
Here:
5.5%
Illinois:
9.9%
Students in private undergraduate colleges:
Here:
0.0%
Illinois:
27.4%
Occupation by median earnings in the past 12 months ($)
132,709Sales and related occupations
104,668Business and financial operations occupations
80,305Health diagnosing and treating practitioners and other technical occupations
53,106Management occupations
45,366Production occupations
39,577Building and grounds cleaning and maintenance occupations
Top industries in this zip code by the number of employees in 2005:
Accommodation and Food Services: Full-Service Restaurants (20-49 employees: 1 establishment)
Construction: New Housing Operative Builders (5-9: 1)
Construction: Poured Concrete Foundation and Structure Contractors (5-9: 1)
Utilities: Water Supply and Irrigation Systems (1-4: 1)
Wholesale Trade: Grain and Field Bean Merchant Wholesalers (1-4: 1)
Construction: Site Preparation Contractors (1-4: 1)
Other Services (except Public Administration): Religious Organizations (1-4: 1)
Accommodation and Food Services: Drinking Places (Alcoholic Beverages) (1-4: 1)
Home Mortgage Disclosure Act Aggregated Statistics For Year 2009 (Based on 2 partial tracts)
A) FHA, FSA/RHS & VA Home Purchase Loans
B) Conventional Home Purchase Loans
C) Refinancings
D) Home Improvement Loans
F) Non-occupant Loans on < 5 Family Dwellings (A B C & D)
G) Loans On Manufactured Home Dwelling (A B C & D)
Number
Average Value
Number
Average Value
Number
Average Value
Number
Average Value
Number
Average Value
Number
Average Value
LOANS ORIGINATED
2
$142,600
6
$52,183
33
$106,621
7
$35,207
3
$28,520
2
$29,605
APPLICATIONS APPROVED, NOT ACCEPTED
0
$0
0
$0
2
$86,335
0
$0
0
$0
0
$0
APPLICATIONS DENIED
1
$55,800
1
$95,480
11
$107,542
1
$15,810
0
$0
2
$60,140
APPLICATIONS WITHDRAWN
0
$0
0
$0
5
$106,578
0
$0
0
$0
1
$60,760
FILES CLOSED FOR INCOMPLETENESS
0
$0
0
$0
2
$48,825
0
$0
0
$0
0
$0
Aggregated Statistics For Year 2008 (Based on 2 partial tracts)
A) FHA, FSA/RHS & VA Home Purchase Loans
B) Conventional Home Purchase Loans
C) Refinancings
D) Home Improvement Loans
F) Non-occupant Loans on < 5 Family Dwellings (A B C & D)
G) Loans On Manufactured Home Dwelling (A B C & D)
Number
Average Value
Number
Average Value
Number
Average Value
Number
Average Value
Number
Average Value
Number
Average Value
LOANS ORIGINATED
4
$106,020
11
$78,825
27
$112,473
4
$30,225
5
$69,006
2
$67,735
APPLICATIONS APPROVED, NOT ACCEPTED
0
$0
1
$47,430
2
$108,035
0
$0
0
$0
1
$43,090
APPLICATIONS DENIED
3
$79,980
2
$59,520
8
$114,351
4
$74,478
0
$0
2
$60,760
APPLICATIONS WITHDRAWN
1
$71,300
1
$73,160
3
$126,687
0
$0
0
$0
0
$0
FILES CLOSED FOR INCOMPLETENESS
0
$0
0
$0
0
$0
0
$0
0
$0
0
$0
Aggregated Statistics For Year 2007 (Based on 2 partial tracts)
A) FHA, FSA/RHS & VA Home Purchase Loans
B) Conventional Home Purchase Loans
C) Refinancings
D) Home Improvement Loans
E) Loans on Dwellings For 5+ Families
F) Non-occupant Loans on < 5 Family Dwellings (A B C & D)
G) Loans On Manufactured Home Dwelling (A B C & D)
Number
Average Value
Number
Average Value
Number
Average Value
Number
Average Value
Number
Average Value
Number
Average Value
Number
Average Value
LOANS ORIGINATED
5
$88,412
12
$91,088
23
$89,994
7
$26,217
1
$108,190
2
$79,980
2
$35,495
APPLICATIONS APPROVED, NOT ACCEPTED
0
$0
1
$60,450
4
$128,417
2
$12,245
0
$0
0
$0
0
$0
APPLICATIONS DENIED
2
$68,510
3
$79,670
14
$99,266
7
$40,876
0
$0
0
$0
1
$58,280
APPLICATIONS WITHDRAWN
0
$0
0
$0
5
$83,204
0
$0
0
$0
0
$0
0
$0
FILES CLOSED FOR INCOMPLETENESS
0
$0
1
$85,870
2
$81,685
0
$0
0
$0
0
$0
0
$0
Aggregated Statistics For Year 2006 (Based on 2 partial tracts)
A) FHA, FSA/RHS & VA Home Purchase Loans
B) Conventional Home Purchase Loans
C) Refinancings
D) Home Improvement Loans
F) Non-occupant Loans on < 5 Family Dwellings (A B C & D)
G) Loans On Manufactured Home Dwelling (A B C & D)
Number
Average Value
Number
Average Value
Number
Average Value
Number
Average Value
Number
Average Value
Number
Average Value
LOANS ORIGINATED
4
$97,108
19
$82,591
23
$82,366
9
$31,172
6
$54,353
5
$52,452
APPLICATIONS APPROVED, NOT ACCEPTED
0
$0
1
$46,190
3
$79,463
1
$35,030
0
$0
0
$0
APPLICATIONS DENIED
0
$0
5
$75,516
12
$84,759
7
$94,151
0
$0
1
$35,030
APPLICATIONS WITHDRAWN
0
$0
0
$0
8
$88,466
1
$83,080
0
$0
1
$36,270
FILES CLOSED FOR INCOMPLETENESS
0
$0
1
$85,870
3
$83,390
1
$41,850
0
$0
0
$0
Aggregated Statistics For Year 2005 (Based on 2 partial tracts)
A) FHA, FSA/RHS & VA Home Purchase Loans
B) Conventional Home Purchase Loans
C) Refinancings
D) Home Improvement Loans
F) Non-occupant Loans on < 5 Family Dwellings (A B C & D)
G) Loans On Manufactured Home Dwelling (A B C & D)
Number
Average Value
Number
Average Value
Number
Average Value
Number
Average Value
Number
Average Value
Number
Average Value
LOANS ORIGINATED
3
$111,600
20
$69,890
24
$92,005
9
$34,479
5
$46,252
4
$52,235
APPLICATIONS APPROVED, NOT ACCEPTED
0
$0
2
$101,525
4
$81,918
1
$29,760
0
$0
1
$25,110
APPLICATIONS DENIED
1
$27,280
4
$80,522
20
$86,040
5
$72,912
0
$0
3
$45,363
APPLICATIONS WITHDRAWN
0
$0
0
$0
8
$87,226
3
$174,840
0
$0
0
$0
FILES CLOSED FOR INCOMPLETENESS
0
$0
0
$0
2
$106,795
0
$0
0
$0
0
$0
Aggregated Statistics For Year 2004 (Based on 2 partial tracts)
A) FHA, FSA/RHS & VA Home Purchase Loans
B) Conventional Home Purchase Loans
C) Refinancings
D) Home Improvement Loans
F) Non-occupant Loans on < 5 Family Dwellings (A B C & D)
G) Loans On Manufactured Home Dwelling (A B C & D)
Number
Average Value
Number
Average Value
Number
Average Value
Number
Average Value
Number
Average Value
Number
Average Value
LOANS ORIGINATED
3
$90,727
19
$76,064
30
$79,866
8
$27,048
4
$89,048
4
$71,688
APPLICATIONS APPROVED, NOT ACCEPTED
0
$0
1
$56,420
3
$62,413
0
$0
0
$0
0
$0
APPLICATIONS DENIED
0
$0
6
$52,803
14
$87,376
2
$26,350
1
$93,310
2
$51,615
APPLICATIONS WITHDRAWN
0
$0
1
$40,300
8
$85,056
0
$0
1
$42,780
0
$0
FILES CLOSED FOR INCOMPLETENESS
0
$0
0
$0
5
$66,154
0
$0
0
$0
0
$0
Aggregated Statistics For Year 2003 (Based on 2 partial tracts)
A) FHA, FSA/RHS & VA Home Purchase Loans
B) Conventional Home Purchase Loans
C) Refinancings
D) Home Improvement Loans
F) Non-occupant Loans on < 5 Family Dwellings (A B C & D)
Number
Average Value
Number
Average Value
Number
Average Value
Number
Average Value
Number
Average Value
LOANS ORIGINATED
5
$72,044
17
$71,446
51
$83,913
9
$25,489
3
$52,183
APPLICATIONS APPROVED, NOT ACCEPTED
0
$0
0
$0
5
$76,446
2
$48,980
0
$0
APPLICATIONS DENIED
1
$23,250
5
$62,992
22
$67,016
3
$20,770
1
$24,180
APPLICATIONS WITHDRAWN
0
$0
1
$93,930
8
$81,879
0
$0
0
$0
FILES CLOSED FOR INCOMPLETENESS
0
$0
1
$54,870
1
$104,470
0
$0
0
$0
Aggregated Statistics For Year 2002 (Based on 2 partial tracts)
A) FHA, FSA/RHS & VA Home Purchase Loans
B) Conventional Home Purchase Loans
C) Refinancings
D) Home Improvement Loans
E) Loans on Dwellings For 5+ Families
F) Non-occupant Loans on < 5 Family Dwellings (A B C & D)
Number
Average Value
Number
Average Value
Number
Average Value
Number
Average Value
Number
Average Value
Number
Average Value
LOANS ORIGINATED
3
$77,913
11
$82,094
42
$73,891
7
$24,091
1
$126,790
6
$64,222
APPLICATIONS APPROVED, NOT ACCEPTED
0
$0
0
$0
5
$71,362
0
$0
0
$0
0
$0
APPLICATIONS DENIED
1
$69,130
2
$55,800
16
$63,240
5
$14,694
0
$0
1
$18,600
APPLICATIONS WITHDRAWN
0
$0
0
$0
2
$91,760
1
$77,190
0
$0
0
$0
FILES CLOSED FOR INCOMPLETENESS
0
$0
0
$0
3
$62,827
0
$0
0
$0
0
$0
Aggregated Statistics For Year 2001 (Based on 2 partial tracts)
A) FHA, FSA/RHS & VA Home Purchase Loans
B) Conventional Home Purchase Loans
C) Refinancings
D) Home Improvement Loans
F) Non-occupant Loans on < 5 Family Dwellings (A B C & D)
Number
Average Value
Number
Average Value
Number
Average Value
Number
Average Value
Number
Average Value
LOANS ORIGINATED
4
$76,415
15
$58,735
31
$69,510
8
$25,420
3
$58,487
APPLICATIONS APPROVED, NOT ACCEPTED
0
$0
1
$34,720
4
$53,165
0
$0
0
$0
APPLICATIONS DENIED
1
$40,920
2
$40,145
9
$58,556
4
$11,392
0
$0
APPLICATIONS WITHDRAWN
0
$0
2
$66,185
5
$72,974
1
$17,360
0
$0
FILES CLOSED FOR INCOMPLETENESS
0
$0
0
$0
1
$96,720
1
$33,170
0
$0
Aggregated Statistics For Year 2000 (Based on 2 partial tracts)
A) FHA, FSA/RHS & VA Home Purchase Loans
B) Conventional Home Purchase Loans
C) Refinancings
D) Home Improvement Loans
F) Non-occupant Loans on < 5 Family Dwellings (A B C & D)
Number
Average Value
Number
Average Value
Number
Average Value
Number
Average Value
Number
Average Value
LOANS ORIGINATED
3
$77,913
13
$61,475
10
$66,464
7
$15,677
1
$96,720
APPLICATIONS APPROVED, NOT ACCEPTED
0
$0
1
$59,210
3
$53,527
1
$19,530
0
$0
APPLICATIONS DENIED
0
$0
4
$35,185
13
$42,160
3
$26,143
0
$0
APPLICATIONS WITHDRAWN
0
$0
1
$35,030
4
$38,828
1
$13,950
0
$0
FILES CLOSED FOR INCOMPLETENESS
0
$0
0
$0
1
$66,030
0
$0
0
$0
Aggregated Statistics For Year 1999 (Based on 1 partial tract)


 Nearest zip codes: 61847, 61812, 61871, 60960, 61859, 61865.


