Estimated zip code population in 2022: 5,731 Zip code population in 2010: 6,250 Zip code population in 2000: 5,020
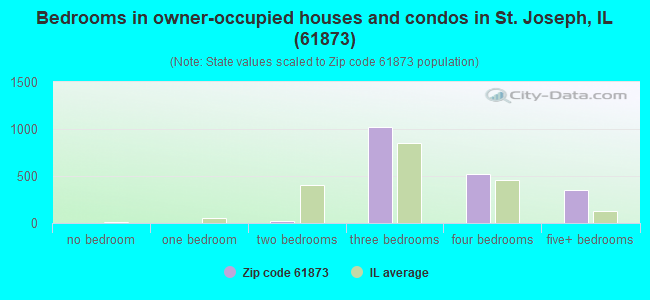
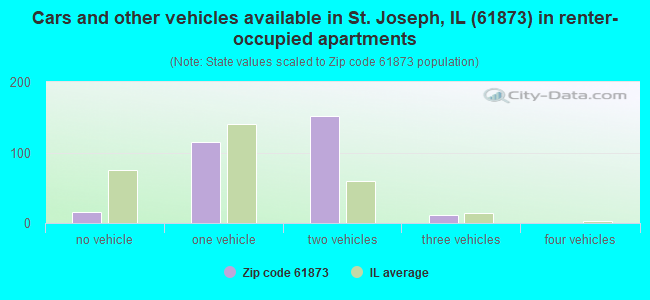
Houses and condos: 2,258 Renter-occupied apartments: 301
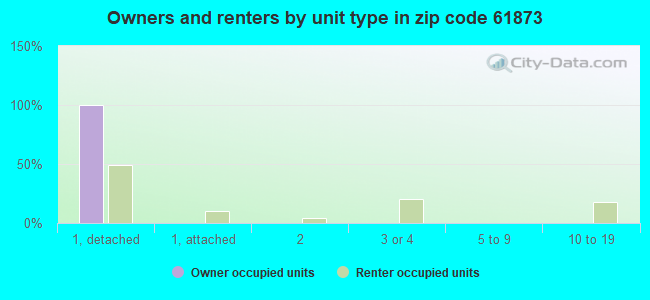
% of renters here:
14%
State:
33%
March 2022 cost of living index in zip code 61873: 84.6 (less than average, U.S. average is 100)
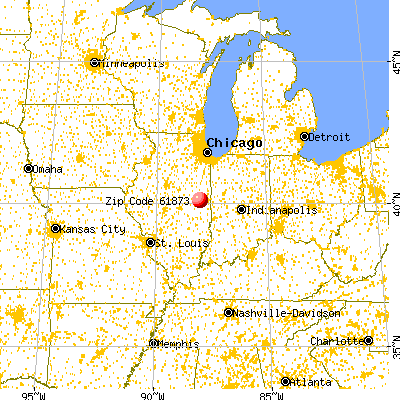
Land area: 67.3 sq. mi. Water area: 0.3 sq. mi.
Population density: 85 people per square mile
(very low).
OSM Map
General Map
Google Map
MSN Map
OSM Map
General Map
Google Map
MSN Map
OSM Map
General Map
Google Map
MSN Map
OSM Map
General Map
Google Map
MSN Map
Please wait while loading the map...
Real estate property taxes paid for housing units in 2022:
This zip code:
1.9% ($4,500)
Illinois:
2.0% ($4,912)
Median real estate property taxes paid for housing units with mortgages in 2022: $4,331 (1.9%) Median real estate property taxes paid for housing units with no mortgage in 2022: $4,855 (1.9%)
Business Search- 14 Million verified businesses
Males: 2,748
(48.0%)
Females: 2,981
(52.0%)
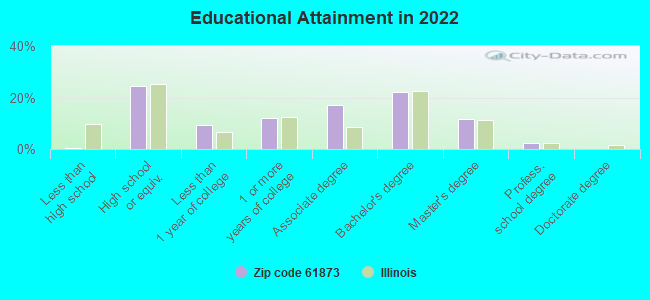
For population 25 years and over in 61873:
High school or higher: 99.7%
Bachelor's degree or higher: 36.3%
Graduate or professional degree: 14.1%
Unemployed: 3.5%
Mean travel time to work (commute): 25.1 minutes
For population 15 years and over in 61873:
Never married: 23.6%
Now married: 56.8%
Separated: 0.3%
Widowed: 7.2%
Divorced: 12.0%
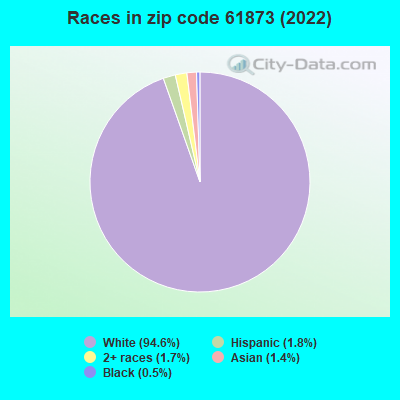
Zip code 61873 compared to state average:
Black race population percentage significantly below state average.
Hispanic race population percentage significantly below state average.
Foreign-born population percentage significantly below state average.
Renting percentage significantly below state average.
Length of stay since moving in significantly above state average.
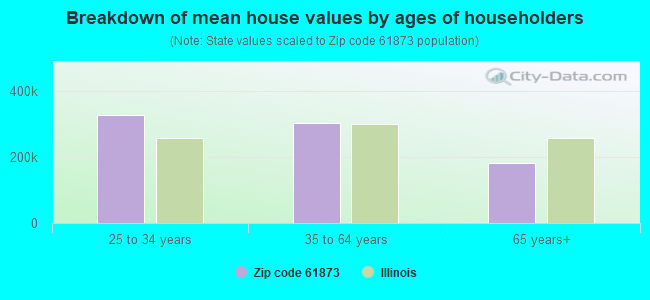
Estimated median house/condo value in 2022: $240,656
61873:
$240,656
Illinois:
$251,600
According to our research of Illinois and other state lists, there were 4 registered sex offenders living in 61873 zip code as of May 28, 2024. The ratio of all residents to sex offenders in zip code 61873 is 1,653 to 1. The ratio of registered sex offenders to all residents in this zip code is lower than the state average.
Median resident age:
This zip code:
40.4 years
Illinois median age:
39.1 years
Average household size:
This zip code:
2.6 people
Illinois:
2.4 people
Averages for the 2020 tax year for zip code 61873, filed in 2021:
Average Adjusted Gross Income (AGI) in 2020: $79,284 (Individual Income Tax Returns)
Here:
$79,284
State:
$82,626
Salary/wage: $66,201 (reported on 82.3% of returns)
Here:
$66,201
State:
$66,640
(% of AGI for various income ranges: 1071.8% for AGIs below $25k, 3485.5% for AGIs $25k-50k, 5644.8% for AGIs $50k-75k, 8170.8% for AGIs $75k-100k, 17895.8% for AGIs $100k-200k, 55020.0% for AGIs over 200k)
Taxable interest for individuals: $1,209 (reported on 39.2% of returns)
This zip code:
$1,209
Illinois:
$2,376
(% of AGI for various income ranges: 16.3% for AGIs below $25k, 15.8% for AGIs $25k-50k, 70.0% for AGIs $50k-75k, 85.8% for AGIs $75k-100k, 122.6% for AGIs $100k-200k, 640.0% for AGIs over 200k)
Ordinary dividends: $4,332 (reported on 25.7% of returns)
Here:
$4,332
State:
$9,061
(% of AGI for various income ranges: 37.3% for AGIs below $25k, 52.0% for AGIs $25k-50k, 86.5% for AGIs $50k-75k, 131.9% for AGIs $75k-100k, 242.3% for AGIs $100k-200k, 2905.0% for AGIs over 200k)
Net capital gain/loss in AGI: +$6,427 (reported on 22.2% of returns)
Here:
+$6,427
State:
+$31,684
(% of AGI for various income ranges: 4.1% for AGIs below $25k, 7.8% for AGIs $25k-50k, 51.0% for AGIs $50k-75k, 98.1% for AGIs $75k-100k, 489.8% for AGIs $100k-200k, 3857.5% for AGIs over 200k)
Profit/loss from business: +$14,625 (reported on 15.3% of returns)
Here:
+$14,625
State:
+$12,175
(% of AGI for various income ranges: 99.0% for AGIs below $25k, 156.2% for AGIs $25k-50k, 206.5% for AGIs $50k-75k, 222.3% for AGIs $75k-100k, 607.0% for AGIs $100k-200k, 3742.5% for AGIs over 200k)
Taxable individual retirement arrangement distribution: $16,276 (reported on 11.5% of returns)
61873:
$16,276
Illinois:
$21,613
(% of AGI for various income ranges: 43.3% for AGIs below $25k, 137.2% for AGIs $25k-50k, 224.8% for AGIs $50k-75k, 373.5% for AGIs $75k-100k, 526.7% for AGIs $100k-200k, 1692.5% for AGIs over 200k)
Total itemized deductions: $27,583 (reported on 6.2% of returns)
Here:
$27,583
State:
$34,948
(% of AGI for various income ranges: 110.4% for AGIs below $25k, 207.7% for AGIs $50k-75k, 181.9% for AGIs $75k-100k, 566.5% for AGIs $100k-200k, 2177.5% for AGIs over 200k)
Charity contributions: $12,192 (reported on 4.5% of returns)
Here:
$12,192
State:
$13,122
(% of AGI for various income ranges: 79.4% for AGIs $50k-75k, 194.7% for AGIs $100k-200k, 1255.0% for AGIs over 200k)
Taxes paid: $8,022 (reported on 6.2% of returns)
61873:
$8,022
State:
$8,563
(% of AGI for various income ranges: 14.7% for AGIs below $25k, 57.4% for AGIs $50k-75k, 65.0% for AGIs $75k-100k, 184.2% for AGIs $100k-200k, 582.5% for AGIs over 200k)
Earned income credit: $1,986 (reported on 7.6% of returns)
Here:
$1,986
State:
$2,311
(% of AGI for various income ranges: 48.0% for AGIs below $25k, 50.5% for AGIs $25k-50k)
Percentage of individuals using paid preparers for their 2020 taxes: 94.4%
Here:
94%
State:
93%
(% for various income ranges: 94.0% for AGIs below $25k, 94.2% for AGIs $25k-50k, 95.3% for AGIs $50k-75k, 92.1% for AGIs $75k-100k, 96.0% for AGIs $100k-200k, 92.3% for AGIs over 200k)
Averages for the 2012 tax year for zip code 61873, filed in 2013:
Average Adjusted Gross Income (AGI) in 2012: $63,451 (Individual Income Tax Returns)
Here:
$63,451
State:
$68,058
Salary/wage: $54,645 (reported on 84.4% of returns)
Here:
$54,645
State:
$55,396
(% of AGI for various income ranges: 74.1% for AGIs below $25k, 75.3% for AGIs $25k-50k, 75.5% for AGIs $50k-75k, 75.3% for AGIs $75k-100k, 75.5% for AGIs $100k-200k, 50.3% for AGIs over 200k)
Taxable interest for individuals: $965 (reported on 44.3% of returns)
This zip code:
$965
Illinois:
$1,969
(% of AGI for various income ranges: 1.3% for AGIs below $25k, 0.8% for AGIs $25k-50k, 0.5% for AGIs $50k-75k, 0.6% for AGIs $75k-100k, 0.6% for AGIs $100k-200k, 0.9% for AGIs over 200k)
Ordinary dividends: $2,848 (reported on 26.0% of returns)
Here:
$2,848
State:
$7,786
(% of AGI for various income ranges: 1.8% for AGIs below $25k, 1.1% for AGIs $25k-50k, 1.4% for AGIs $50k-75k, 1.0% for AGIs $75k-100k, 1.1% for AGIs $100k-200k, 1.2% for AGIs over 200k)
Net capital gain/loss in AGI: +$4,267 (reported on 19.0% of returns)
Here:
+$4,267
State:
+$22,183
(% of AGI for various income ranges: 0.4% for AGIs $50k-75k, 0.4% for AGIs $75k-100k, 0.9% for AGIs $100k-200k, 8.1% for AGIs over 200k)
Profit/loss from business: +$12,844 (reported on 14.2% of returns)
Here:
+$12,844
State:
+$12,903
(% of AGI for various income ranges: 3.5% for AGIs below $25k, 1.3% for AGIs $25k-50k, 1.5% for AGIs $50k-75k, 2.4% for AGIs $75k-100k, 5.2% for AGIs $100k-200k)
Taxable individual retirement arrangement distribution: $10,259 (reported on 12.8% of returns)
61873:
$10,259
Illinois:
$17,929
(% of AGI for various income ranges: 4.2% for AGIs below $25k, 2.7% for AGIs $25k-50k, 3.0% for AGIs $50k-75k, 1.6% for AGIs $75k-100k, 2.0% for AGIs $100k-200k)
Self-employment retirement plans: $18,250 (reported on 0.7% of returns)
61873:
$18,250
Illinois:
$24,666
Total itemized deductions: $18,340 (19% of AGI, reported on 41.9% of returns)
Here:
$18,340
State:
$26,433
Here:
19.1% of AGI
State:
19.2% of AGI
(% of AGI for various income ranges: 9.6% for AGIs below $25k, 10.0% for AGIs $25k-50k, 12.5% for AGIs $50k-75k, 13.6% for AGIs $75k-100k, 12.6% for AGIs $100k-200k, 10.0% for AGIs over 200k)
Charity contributions: $3,393 (reported on 31.1% of returns)
Here:
$3,393
State:
$4,525
(% of AGI for various income ranges: 0.5% for AGIs below $25k, 1.0% for AGIs $25k-50k, 1.4% for AGIs $50k-75k, 1.6% for AGIs $75k-100k, 2.0% for AGIs $100k-200k, 2.4% for AGIs over 200k)
Taxes paid: $7,878 (reported on 41.2% of returns)
61873:
$7,878
State:
$11,968
(% of AGI for various income ranges: 1.8% for AGIs below $25k, 3.3% for AGIs $25k-50k, 4.6% for AGIs $50k-75k, 5.8% for AGIs $75k-100k, 6.0% for AGIs $100k-200k, 5.1% for AGIs over 200k)
Earned income credit: $2,033 (reported on 8.3% of returns)
Here:
$2,033
State:
$2,349
(% of AGI for various income ranges: 3.9% for AGIs below $25k, 0.7% for AGIs $25k-50k)
Percentage of individuals using paid preparers for their 2012 taxes: 50.5%
Here:
51%
State:
57%
(% for various income ranges: 41.0% for AGIs below $25k, 51.0% for AGIs $25k-50k, 50.9% for AGIs $50k-75k, 55.3% for AGIs $75k-100k, 56.2% for AGIs $100k-200k, 85.7% for AGIs over 200k)
Averages for the 2004 tax year for zip code 61873, filed in 2005:
Average Adjusted Gross Income (AGI) in 2004: $47,792 (Individual Income Tax Returns)
Here:
$47,792
State:
$54,625
Salary/wage: $43,418 (reported on 85.9% of returns)
Here:
$43,418
State:
$46,811
(% of AGI for various income ranges: 110.2% for AGIs below $10k, 69.5% for AGIs $10k-25k, 73.3% for AGIs $25k-50k, 81.3% for AGIs $50k-75k, 85.6% for AGIs $75k-100k, 70.3% for AGIs over 100k)
Taxable interest for individuals: $1,184 (reported on 54.7% of returns)
This zip code:
$1,184
Illinois:
$2,101
(% of AGI for various income ranges: 4.7% for AGIs below $10k, 3.8% for AGIs $10k-25k, 1.5% for AGIs $25k-50k, 1.2% for AGIs $50k-75k, 0.8% for AGIs $75k-100k, 1.2% for AGIs over 100k)
Taxable dividends: $1,883 (reported on 29.1% of returns)
Here:
$1,883
State:
$4,306
(% of AGI for various income ranges: 3.1% for AGIs below $10k, 1.7% for AGIs $10k-25k, 1.0% for AGIs $25k-50k, 0.5% for AGIs $50k-75k, 1.3% for AGIs $75k-100k, 1.6% for AGIs over 100k)
Net capital gain/loss: +$4,777 (reported on 20.0% of returns)
Here:
+$4,777
State:
+$17,321
(% of AGI for various income ranges: -0.3% for AGIs below $10k, 0.5% for AGIs $10k-25k, 0.7% for AGIs $25k-50k, 0.7% for AGIs $50k-75k, 1.0% for AGIs $75k-100k, 6.0% for AGIs over 100k)
Profit/loss from business: +$9,009 (reported on 16.2% of returns)
Here:
+$9,009
State:
+$11,771
(% of AGI for various income ranges: 1.4% for AGIs below $10k, 3.6% for AGIs $10k-25k, 3.0% for AGIs $25k-50k, 2.7% for AGIs $50k-75k, 2.5% for AGIs $75k-100k, 4.1% for AGIs over 100k)
Profit/loss from farming: +$10,904 (reported on 4.2% of returns)
Here:
+$10,904
State:
+$2,327
(% of AGI for various income ranges: 1.2% for AGIs below $10k, 1.4% for AGIs $10k-25k, 1.2% for AGIs $25k-50k, 0.5% for AGIs $50k-75k, 0.5% for AGIs $75k-100k, 1.6% for AGIs over 100k)
IRA payment deduction: $2,880 (reported on 2.7% of returns)
61873:
$2,880
Illinois:
$3,087
Self-employed pension: $5,324 (reported on 1.2% of returns)
Here:
$5,324
Illinois:
$16,965
Total itemized deductions: $14,638 (20% of AGI, reported on 36.5% of returns)
Here:
$14,638
State:
$20,239
Here:
19.9% of AGI
State:
19.5% of AGI
(% of AGI for various income ranges: 7.9% for AGIs below $10k, 9.4% for AGIs $10k-25k, 10.3% for AGIs $25k-50k, 11.4% for AGIs $50k-75k, 12.1% for AGIs $75k-100k, 11.5% for AGIs over 100k)
Charity contributions deductions: $2,744 (4% of AGI, reported on 29.8% of returns)
Here:
$2,744
State:
$3,719
Here:
3.6% of AGI
State:
3.4% of AGI
(% of AGI for various income ranges: 1.1% for AGIs $10k-25k, 1.5% for AGIs $25k-50k, 1.5% for AGIs $50k-75k, 1.8% for AGIs $75k-100k, 2.4% for AGIs over 100k)
Total tax: $5,964 (reported on 81.4% of returns)
61873:
$5,964
State:
$9,882
(% of AGI for various income ranges: 3.6% for AGIs below $10k, 4.5% for AGIs $10k-25k, 7.1% for AGIs $25k-50k, 8.6% for AGIs $50k-75k, 10.2% for AGIs $75k-100k, 16.1% for AGIs over 100k)
Earned income credit: $1,529 (reported on 8.2% of returns)
Here:
$1,529
State:
$1,788
Percentage of individuals using paid preparers for their 2004 taxes: 52.8%
Here:
53%
State:
61%
(% for various income ranges: 42.9% for AGIs below $10k, 51.1% for AGIs $10k-25k, 57.3% for AGIs $25k-50k, 54.8% for AGIs $50k-75k, 57.7% for AGIs $75k-100k, 52.5% for AGIs over 100k)
Household received Food Stamps/SNAP in the past 12 months: 58 Household did not receive Food Stamps/SNAP in the past 12 months: 2,111
Women who had a birth in the past 12 months: 30 (30 now married, 0 unmarried) Women who did not have a birth in the past 12 months: 1,243 (613 now married, 625 unmarried)
Housing units in zip code 61873 with a mortgage: 1,156 (99 second mortgage, 100 both second mortgage and home equity loan) Houses without a mortgage: 11
Median monthly owner costs for units with a mortgage: $1,620 Median monthly owner costs for units without a mortgage: $832
Residents with income below the poverty level in 2022:
This zip code:
7.2%
Whole state:
11.9%
Residents with income below 50% of the poverty level in 2022:
This zip code:
1.8%
Whole state:
5.7%
Median number of rooms in houses and condos:
Here:
7.2
State:
6.4
Median number of rooms in apartments:
Here:
4.7
State:
4.1
Notable locations in this zip code not listed on our city pages
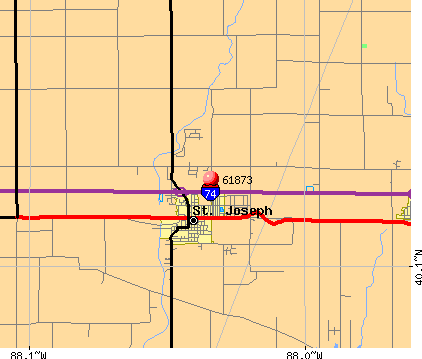
Notable locations in zip code 61873: Saint Joseph - Stanton Fire Protection District (A), Saint Joseph Rescue Squad (B). Display/hide their locations on the map
Churches in zip code 61873 include: Church of Christ (A), Prince of Peace Lutheran Church (B), Saint Joseph United Methodist Church (C). Display/hide their locations on the map
Cemeteries: Peters Cemetery (1), Old Huss Cemetery (2), Huss Cemetery (3), Kopman Cemetery (4), Patterson Cemetery (5). Display/hide their locations on the map
In group quarters: 14 (-1 institutionalized population)
Size of family households: 586 2-persons, 352 3-persons, 344 4-persons, 127 5-persons, 24 6-persons, 21 7-or-more-persons
Size of nonfamily households: 605 1-person, 137 2-persons
1,226 married couples with children.
257 single-parent households (37 men, 220 women).
95.8% of residents of 61873 zip code speak English at home.
2.0% of residents speak Spanish at home (72% very well, 5% well, 23% not well).
1.6% of residents speak Asian or Pacific Island language at home (58% very well, 8% well, 34% not well).
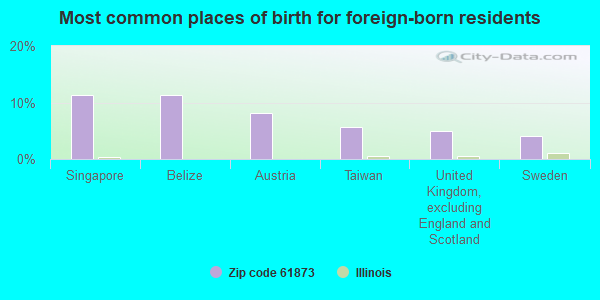
Foreign born population: 123 (2.2%) (56.3% of them are naturalized citizens)
This zip code:
2.2%
Whole state:
14.4%
11%Singapore
11%Belize
8%Austria
6%Taiwan
5%United Kingdom, excluding England and Scotland
4%Sweden
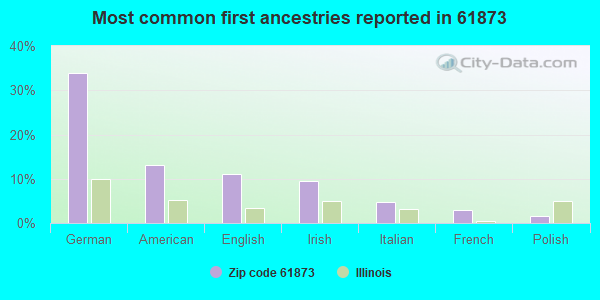
34%German
13%American
11%English
10%Irish
5%Italian
3%French
2%Polish
Year of entry for the foreign-born population
572010 or later
692000 to 2009
251990 to 1999
29Before 1990
Facilities with environmental interests located in this zip code:
COEVAL DIVISION OF ADM (2412 COUNTY ROAD 1600 N. in SAINT JOSEPH, IL)
STATE MASTER (Illinois EPA Project) - AIR PROGRAM AIR MINOR (AIRS/AFS) National Pollutant Discharge Elimination System NON-MAJOR (Tracking pollutant discharge elimination systems) - permit Business SIC classification: FOOD PREPARATIONS Organizations: COEVAL INC. (CONTACT/OWNER)
Alternative names: COEVAL INC
PIONEER HI-BRED INTERNATIONAL INC (2112 COUNTY ROAD 1600 N in SAINT JOSEPH, IL)
STATE MASTER (Illinois EPA Project) - HAZARDOUS WASTE PROGRAM, AIR PROGRAM, SOLID WASTE PROGRAM AIR MINOR (AIRS/AFS) CRITERIA AND HAZARDOUS AIR POLLUTANT INVENTORY (Inventory of air pollution sources) Business SIC classification: PREPARED FEEDS AND FEED INGREDIENTS FOR ANIMALS AND FOWLS, EXCEPT DOGS AND CATS
GRAND PRAIRIE CO-OP (1975 E 1600 N in ST JOSEPH, IL)
STATE MASTER (Illinois EPA Project) - SOLID WASTE PROGRAM, AIR PROGRAM AIR MINOR (AIRS/AFS) CRITERIA AND HAZARDOUS AIR POLLUTANT INVENTORY (Inventory of air pollution sources) Business SIC classification: GRAIN AND FIELD BEANS Alternative names: GRAND PRAIRIE COOP INCORPORATED, GRAND PRAIRIE COOP INC
HARMS TRUCKING CO. (2191 COUNTY ROAD 2200 E. in ST JOSEPH, IL)
National Pollutant Discharge Elimination System NON-MAJOR (Tracking pollutant discharge elimination systems) - permit
ILDOT BRG 010 0027 0028 (1PT 5MI W OF ST JOSEPH ON 174 in ST JOSEPH, IL)
(Resource Conservation and Recovery Act (tracking hazardous waste))
ILDOT BRG 010 0029 0030 (3 MI W ST JOSEPH ON I74 in ST JOSEPH, IL)
(Resource Conservation and Recovery Act (tracking hazardous waste))
ILDOT BRG 010 0031 0032 (1PT 1 MI E ST JOSEPH ON I74 in ST JOSEPH, IL)
(Resource Conservation and Recovery Act (tracking hazardous waste))
PIONEER HI BRED INTL INC (2112 CO RD 1600N in ST JOSEPH, IL)
Small Quantity Generators, between 100 kg and 1000 kg of hazardous waste/month (Resource Conservation and Recovery Act (tracking hazardous waste)) - notification
Housing units lacking complete plumbing facilities: 0.5% Housing units lacking complete kitchen facilities: 0.5%
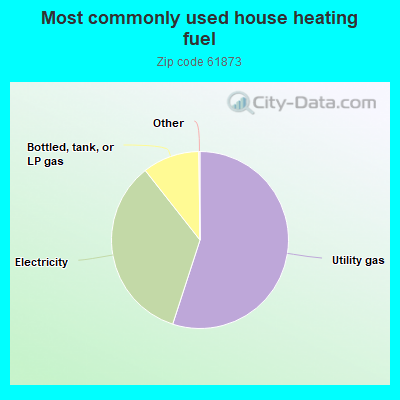
55.0%Utility gas
34.4%Electricity
10.4%Bottled, tank, or LP gas
Population in 1990: 4,168. Population change in the 1990s: +852 (+20.4%).
Place of birth for U.S.-born residents:
This state: 4,554
Northeast: 44
Midwest: 612
South: 184
West: 136
62% of the 61873 zip code residents lived in the same house 5 years ago. Out of people who lived in different houses, 71% lived in this county. Out of people who lived in different counties, 50% lived in Illinois.
94% of the 61873 zip code residents lived in the same house 1 year ago. Out of people who lived in different houses, 70% moved from this county. Out of people who lived in different houses, 24% moved from different county within same state. Out of people who lived in different houses, 4% moved from abroad.
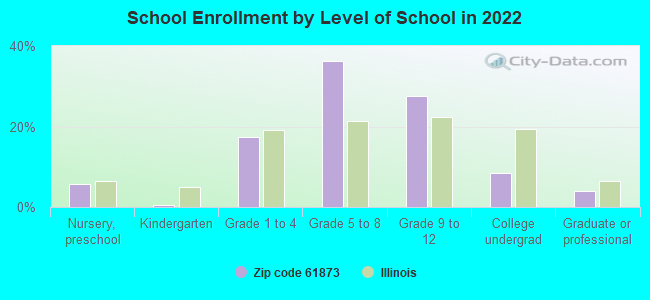
Private vs. public school enrollment:
Students in private schools in grades 1 to 8 (elementary and middle school): 80
Here:
9.7%
Illinois:
13.3%
Students in private schools in grades 9 to 12 (high school):
Here:
0.0%
Illinois:
9.9%
Students in private undergraduate colleges:
Here:
0.0%
Illinois:
27.4%
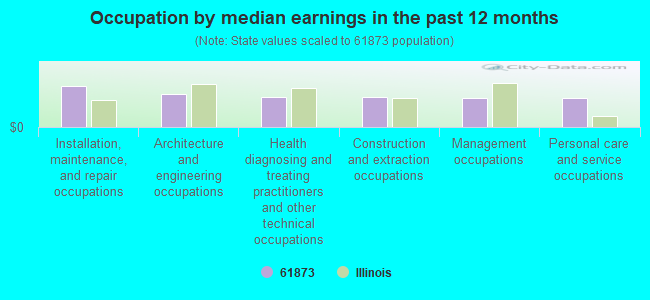
Occupation by median earnings in the past 12 months ($)
118,911Installation, maintenance, and repair occupations
96,357Architecture and engineering occupations
86,188Health diagnosing and treating practitioners and other technical occupations
86,100Construction and extraction occupations
84,749Management occupations
83,643Personal care and service occupations
Companies with federal contracts located in this zip code:
FRESH CUT (2218 MORNINGSIDE in SAINT JOSEPH, IL; small business)
$25,000 with Army for Landscaping/Groundskeeping Services. Signed on 2005-11-09. Completion date: 2006-11-30.
Top industries in this zip code by the number of employees in 2005:
Health Care and Social Assistance: Child Day Care Services (20-49 employees: 1 establishment)
Finance and Insurance: Commercial Banking (10-19: 1, 5-9: 1)
Accommodation and Food Services: Limited-Service Restaurants (10-19: 1, 5-9: 1)
Administrative and Support and Waste Management and Remediation Services: Landscaping Services (10-19: 1, 1-4: 3)
Construction: Commercial and Institutional Building Construction (10-19: 1, 1-4: 2)
Wholesale Trade: Grain and Field Bean Merchant Wholesalers (10-19: 1, 1-4: 1)
Health Care and Social Assistance: Offices of Dentists (10-19: 1, 1-4: 1)
People in group quarters in 2010:
14 people in group homes intended for adults
People in group quarters in 2000:
6 people in homes for the physically handicapped
Fatal accident statistics in 2014:
Fatal accident count: 2
Vehicles involved in fatal accidents: 5
Fatal accidents caused by drunken drivers: 1
Fatalities: 2
Persons involved in fatal accidents: 9
Pedestrians involved in fatal accidents: 0
Fatal accident statistics in 2013:
Fatal accident count: 2
Vehicles involved in fatal accidents: 3
Fatal accidents caused by drunken drivers: 1
Fatalities: 2
Persons involved in fatal accidents: 3
Pedestrians involved in fatal accidents: 0
Home Mortgage Disclosure Act Aggregated Statistics For Year 2009 (Based on 2 partial tracts)
A) FHA, FSA/RHS & VA Home Purchase Loans
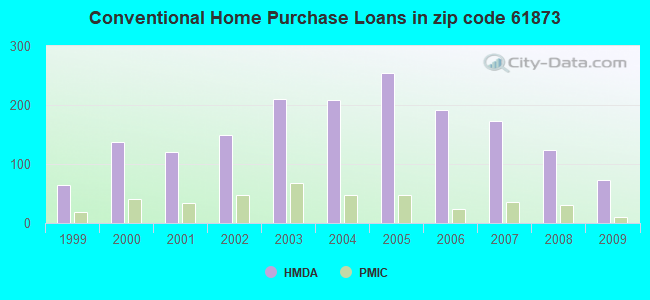
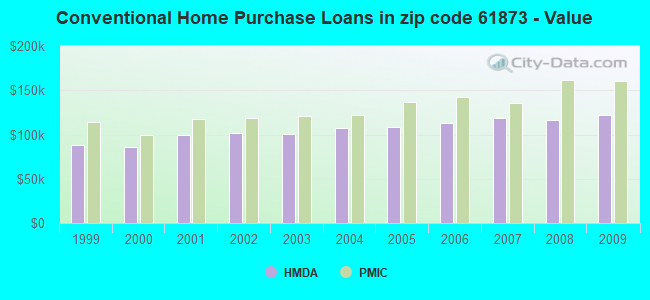
B) Conventional Home Purchase Loans
C) Refinancings
D) Home Improvement Loans
E) Loans on Dwellings For 5+ Families
F) Non-occupant Loans on < 5 Family Dwellings (A B C & D)
G) Loans On Manufactured Home Dwelling (A B C & D)
Number
Average Value
Number
Average Value
Number
Average Value
Number
Average Value
Number
Average Value
Number
Average Value
Number
Average Value
LOANS ORIGINATED
62
$130,948
73
$121,712
415
$138,376
30
$58,164
2
$100,795
17
$85,238
5
$96,458
APPLICATIONS APPROVED, NOT ACCEPTED
2
$112,175
5
$168,422
30
$131,573
0
$0
0
$0
0
$0
1
$95,370
APPLICATIONS DENIED
10
$109,355
8
$108,786
47
$139,972
7
$53,726
0
$0
2
$97,540
2
$97,000
APPLICATIONS WITHDRAWN
3
$133,670
0
$0
39
$136,920
1
$46,600
0
$0
1
$87,790
1
$173,410
FILES CLOSED FOR INCOMPLETENESS
0
$0
2
$276,910
13
$145,479
2
$92,125
0
$0
0
$0
0
$0
Aggregated Statistics For Year 2008 (Based on 2 partial tracts)
A) FHA, FSA/RHS & VA Home Purchase Loans
B) Conventional Home Purchase Loans
C) Refinancings
D) Home Improvement Loans
E) Loans on Dwellings For 5+ Families
F) Non-occupant Loans on < 5 Family Dwellings (A B C & D)
G) Loans On Manufactured Home Dwelling (A B C & D)
Number
Average Value
Number
Average Value
Number
Average Value
Number
Average Value
Number
Average Value
Number
Average Value
Number
Average Value
LOANS ORIGINATED
35
$152,785
124
$116,823
186
$128,535
33
$36,521
0
$0
24
$79,705
3
$87,067
APPLICATIONS APPROVED, NOT ACCEPTED
0
$0
5
$255,994
24
$104,496
2
$9,210
0
$0
3
$26,010
1
$201,590
APPLICATIONS DENIED
3
$102,240
7
$86,084
47
$118,987
16
$98,964
1
$807,430
1
$27,090
1
$27,090
APPLICATIONS WITHDRAWN
3
$149,203
9
$127,287
30
$133,596
4
$80,472
0
$0
0
$0
0
$0
FILES CLOSED FOR INCOMPLETENESS
0
$0
0
$0
3
$155,343
1
$81,280
0
$0
1
$81,280
0
$0
Aggregated Statistics For Year 2007 (Based on 2 partial tracts)
A) FHA, FSA/RHS & VA Home Purchase Loans
B) Conventional Home Purchase Loans
C) Refinancings
D) Home Improvement Loans
E) Loans on Dwellings For 5+ Families
F) Non-occupant Loans on < 5 Family Dwellings (A B C & D)
G) Loans On Manufactured Home Dwelling (A B C & D)
Number
Average Value
Number
Average Value
Number
Average Value
Number
Average Value
Number
Average Value
Number
Average Value
Number
Average Value
LOANS ORIGINATED
27
$148,962
173
$118,197
145
$118,702
55
$40,436
2
$322,970
17
$95,821
1
$171,240
APPLICATIONS APPROVED, NOT ACCEPTED
1
$148,480
11
$92,911
14
$88,175
4
$50,398
0
$0
2
$98,085
1
$55,270
APPLICATIONS DENIED
0
$0
13
$119,218
62
$121,508
24
$52,790
0
$0
2
$140,895
2
$94,830
APPLICATIONS WITHDRAWN
1
$123,550
7
$141,513
22
$124,883
4
$110,548
0
$0
1
$82,370
1
$130,060
FILES CLOSED FOR INCOMPLETENESS
0
$0
1
$308,880
15
$103,467
1
$13,010
0
$0
0
$0
0
$0
Aggregated Statistics For Year 2006 (Based on 2 partial tracts)
A) FHA, FSA/RHS & VA Home Purchase Loans
B) Conventional Home Purchase Loans
C) Refinancings
D) Home Improvement Loans
F) Non-occupant Loans on < 5 Family Dwellings (A B C & D)
G) Loans On Manufactured Home Dwelling (A B C & D)
Number
Average Value
Number
Average Value
Number
Average Value
Number
Average Value
Number
Average Value
Number
Average Value
LOANS ORIGINATED
22
$119,366
191
$112,590
146
$101,358
51
$38,571
27
$90,758
9
$60,211
APPLICATIONS APPROVED, NOT ACCEPTED
0
$0
11
$101,187
15
$101,733
5
$37,500
2
$60,150
2
$56,900
APPLICATIONS DENIED
2
$149,565
15
$94,507
52
$103,690
13
$94,541
3
$94,290
5
$60,910
APPLICATIONS WITHDRAWN
1
$154,980
11
$100,794
51
$132,096
5
$84,536
2
$97,000
1
$122,470
FILES CLOSED FOR INCOMPLETENESS
0
$0
5
$120,736
8
$115,154
0
$0
0
$0
0
$0
Aggregated Statistics For Year 2005 (Based on 2 partial tracts)
A) FHA, FSA/RHS & VA Home Purchase Loans
B) Conventional Home Purchase Loans
C) Refinancings
D) Home Improvement Loans
F) Non-occupant Loans on < 5 Family Dwellings (A B C & D)
G) Loans On Manufactured Home Dwelling (A B C & D)
Number
Average Value
Number
Average Value
Number
Average Value
Number
Average Value
Number
Average Value
Number
Average Value
LOANS ORIGINATED
23
$130,197
254
$108,751
193
$114,389
34
$35,606
26
$73,323
8
$96,865
APPLICATIONS APPROVED, NOT ACCEPTED
1
$148,480
16
$91,242
24
$97,903
7
$86,240
0
$0
1
$110,550
APPLICATIONS DENIED
1
$106,210
15
$103,611
77
$112,589
18
$49,373
1
$69,360
1
$35,770
APPLICATIONS WITHDRAWN
0
$0
12
$85,982
46
$131,800
8
$93,749
1
$183,160
0
$0
FILES CLOSED FOR INCOMPLETENESS
0
$0
3
$139,087
5
$114,016
3
$37,210
0
$0
0
$0
Aggregated Statistics For Year 2004 (Based on 2 partial tracts)
A) FHA, FSA/RHS & VA Home Purchase Loans
B) Conventional Home Purchase Loans
C) Refinancings
D) Home Improvement Loans
F) Non-occupant Loans on < 5 Family Dwellings (A B C & D)
G) Loans On Manufactured Home Dwelling (A B C & D)
Number
Average Value
Number
Average Value
Number
Average Value
Number
Average Value
Number
Average Value
Number
Average Value
LOANS ORIGINATED
26
$121,844
209
$107,384
240
$109,947
50
$38,475
31
$92,368
2
$32,515
APPLICATIONS APPROVED, NOT ACCEPTED
3
$113,800
8
$102,825
14
$123,321
4
$69,362
0
$0
1
$93,210
APPLICATIONS DENIED
0
$0
12
$96,368
61
$116,411
13
$26,095
2
$97,000
2
$49,855
APPLICATIONS WITHDRAWN
1
$126,800
11
$129,465
59
$110,033
5
$46,170
2
$118,135
1
$83,450
FILES CLOSED FOR INCOMPLETENESS
0
$0
1
$136,560
16
$119,489
0
$0
2
$122,470
0
$0
Aggregated Statistics For Year 2003 (Based on 2 partial tracts)
A) FHA, FSA/RHS & VA Home Purchase Loans
B) Conventional Home Purchase Loans
C) Refinancings
D) Home Improvement Loans
F) Non-occupant Loans on < 5 Family Dwellings (A B C & D)
Number
Average Value
Number
Average Value
Number
Average Value
Number
Average Value
Number
Average Value
LOANS ORIGINATED
27
$115,445
210
$100,489
541
$98,331
49
$21,079
40
$69,770
APPLICATIONS APPROVED, NOT ACCEPTED
0
$0
5
$114,666
50
$84,840
5
$18,858
8
$45,114
APPLICATIONS DENIED
1
$73,700
11
$116,164
79
$104,456
10
$43,027
4
$73,698
APPLICATIONS WITHDRAWN
2
$131,140
9
$104,888
37
$104,426
3
$19,147
1
$52,020
FILES CLOSED FOR INCOMPLETENESS
0
$0
2
$130,055
11
$88,280
3
$35,403
1
$93,210
Aggregated Statistics For Year 2002 (Based on 2 partial tracts)
A) FHA, FSA/RHS & VA Home Purchase Loans
B) Conventional Home Purchase Loans
C) Refinancings
D) Home Improvement Loans
F) Non-occupant Loans on < 5 Family Dwellings (A B C & D)
Number
Average Value
Number
Average Value
Number
Average Value
Number
Average Value
Number
Average Value
LOANS ORIGINATED
26
$110,673
150
$101,299
373
$95,456
46
$23,207
25
$71,748
APPLICATIONS APPROVED, NOT ACCEPTED
2
$66,110
7
$136,714
25
$76,386
1
$6,500
0
$0
APPLICATIONS DENIED
0
$0
4
$122,198
57
$92,427
8
$15,038
2
$42,270
APPLICATIONS WITHDRAWN
0
$0
9
$133,548
28
$107,645
2
$71,530
1
$134,390
FILES CLOSED FOR INCOMPLETENESS
0
$0
0
$0
9
$93,689
0
$0
0
$0
Aggregated Statistics For Year 2001 (Based on 2 partial tracts)
A) FHA, FSA/RHS & VA Home Purchase Loans
B) Conventional Home Purchase Loans
C) Refinancings
D) Home Improvement Loans
F) Non-occupant Loans on < 5 Family Dwellings (A B C & D)
Number
Average Value
Number
Average Value
Number
Average Value
Number
Average Value
Number
Average Value
LOANS ORIGINATED
24
$100,071
120
$99,899
264
$90,399
53
$24,191
17
$84,281
APPLICATIONS APPROVED, NOT ACCEPTED
1
$119,220
4
$104,045
17
$67,068
4
$26,282
0
$0
APPLICATIONS DENIED
3
$110,187
2
$119,220
52
$66,008
10
$15,282
2
$42,810
APPLICATIONS WITHDRAWN
0
$0
7
$101,103
35
$82,307
2
$14,630
1
$96,460
FILES CLOSED FOR INCOMPLETENESS
0
$0
2
$46,605
4
$133,308
0
$0
0
$0
Aggregated Statistics For Year 2000 (Based on 2 partial tracts)
A) FHA, FSA/RHS & VA Home Purchase Loans
B) Conventional Home Purchase Loans
C) Refinancings
D) Home Improvement Loans
F) Non-occupant Loans on < 5 Family Dwellings (A B C & D)
Number
Average Value
Number
Average Value
Number
Average Value
Number
Average Value
Number
Average Value
LOANS ORIGINATED
12
$81,918
137
$85,873
79
$70,474
49
$13,647
18
$66,533
APPLICATIONS APPROVED, NOT ACCEPTED
1
$151,730
1
$117,050
7
$59,300
3
$27,457
1
$65,030
APPLICATIONS DENIED
1
$151,730
15
$53,034
33
$42,202
10
$30,997
1
$60,690
APPLICATIONS WITHDRAWN
1
$76,950
7
$70,293
13
$76,366
4
$35,765
0
$0
FILES CLOSED FOR INCOMPLETENESS
1
$134,390
0
$0
1
$10,840
0
$0
0
$0
Aggregated Statistics For Year 1999 (Based on 1 partial tract)
A) FHA, FSA/RHS & VA Home Purchase Loans
B) Conventional Home Purchase Loans
C) Refinancings
D) Home Improvement Loans
E) Loans on Dwellings For 5+ Families
F) Non-occupant Loans on < 5 Family Dwellings (A B C & D)
Detailed PMIC statistics for the following Tracts:0107.00
2002 - 2018 National Fire Incident Reporting System (NFIRS) incidents
Based on the data from the years 2002 - 2018 the average number of fire incidents per year is 26. The highest number of fire incidents - 46 took place in 2015, and the least - 8 in 2005. The data has a rising trend.
When looking into fire subcategories, the most incidents belonged to: Outside Fires (39.9%), and Structure Fires (38.3%).
Fire incident types reported to NFIRS in Zip Code 61873


 Nearest zip codes: 61859, 61871, 61802, 61849, 61877, 61878.


 Based on the data from the years 2002 - 2018 the average number of fire incidents per year is 26. The highest number of fire incidents - 46 took place in 2015, and the least - 8 in 2005. The data has a rising trend.
 When looking into fire subcategories, the most incidents belonged to: Outside Fires (39.9%), and Structure Fires (38.3%).