Estimated zip code population in 2022: 821 Zip code population in 2010: 800 Zip code population in 2000: 851
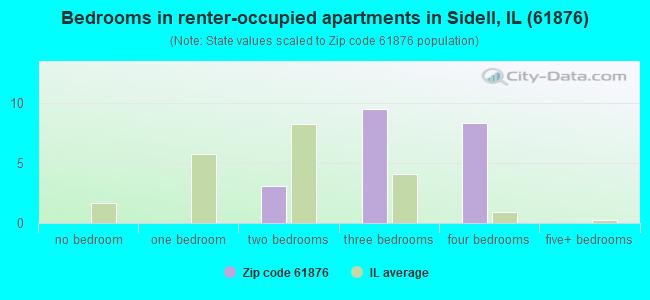
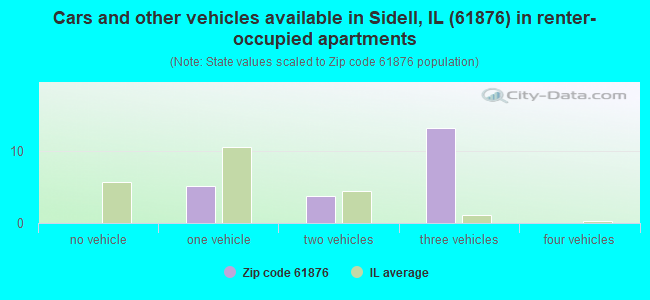
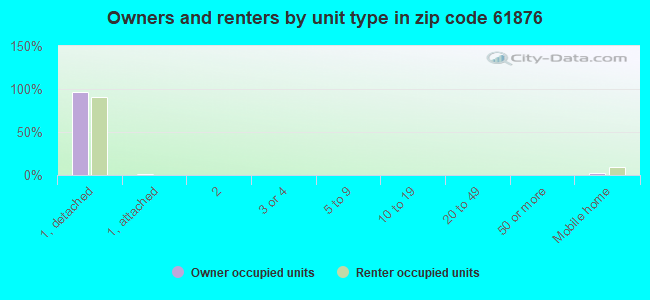
Houses and condos: 297 Renter-occupied apartments: 22
% of renters here:
8%
State:
33%
March 2022 cost of living index in zip code 61876: 83.7 (less than average, U.S. average is 100)
Land area: 43.5 sq. mi. Water area: 0.0 sq. mi.
Population density: 19 people per square mile
(very low).
OSM Map
General Map
Google Map
MSN Map
OSM Map
General Map
Google Map
MSN Map
OSM Map
General Map
Google Map
MSN Map
OSM Map
General Map
Google Map
MSN Map
Please wait while loading the map...
Real estate property taxes paid for housing units in 2022:
This zip code:
1.9% ($1,391)
Illinois:
2.0% ($4,912)
Median real estate property taxes paid for housing units with mortgages in 2022: $2,291 (1.8%) Median real estate property taxes paid for housing units with no mortgage in 2022: $733 (1.4%)
Business Search- 14 Million verified businesses
Males: 442
(53.8%)
Females: 379
(46.2%)
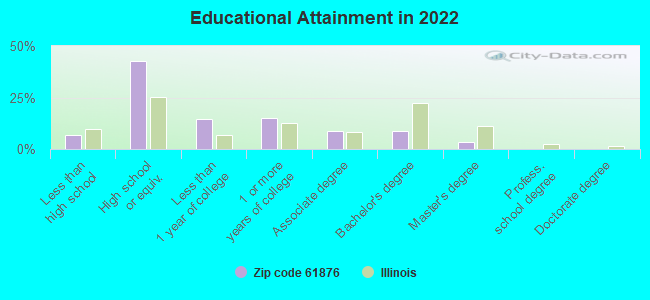
For population 25 years and over in 61876:
High school or higher: 91.2%
Bachelor's degree or higher: 11.9%
Graduate or professional degree: 3.6%
Unemployed: 2.7%
Mean travel time to work (commute): 33.9 minutes
For population 15 years and over in 61876:
Never married: 25.0%
Now married: 59.0%
Separated: 1.7%
Widowed: 9.1%
Divorced: 5.3%
Zip code 61876 compared to state average:
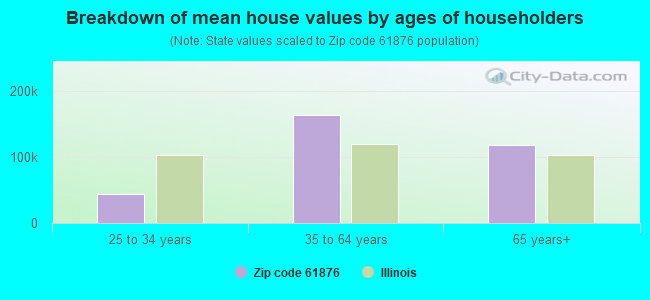
Median house value significantly below state average.
Unemployed percentage below state average.
Black race population percentage significantly below state average.
Hispanic race population percentage significantly below state average.
Foreign-born population percentage significantly below state average.
Renting percentage significantly below state average.
Length of stay since moving in significantly below state average.
Number of college students below state average.
Percentage of population with a bachelor's degree or higher significantly below state average.
Averages for the 2020 tax year for zip code 61876, filed in 2021:
Average Adjusted Gross Income (AGI) in 2020: $58,322 (Individual Income Tax Returns)
Here:
$58,322
State:
$82,626
Salary/wage: $43,871 (reported on 75.0% of returns)
Here:
$43,871
State:
$66,640
(% of AGI for various income ranges: 1023.8% for AGIs below $25k, 2810.0% for AGIs $25k-50k, 4990.0% for AGIs $50k-75k, 4408.0% for AGIs $75k-100k)
Taxable interest for individuals: $610 (reported on 31.2% of returns)
This zip code:
$610
Illinois:
$2,376
(% of AGI for various income ranges: 7.5% for AGIs below $25k, 20.0% for AGIs $50k-75k)
Ordinary dividends: $2,475 (reported on 12.5% of returns)
Here:
$2,475
State:
$9,061
(% of AGI for various income ranges: 23.8% for AGIs below $25k)
Net capital gain/loss in AGI: +$1,575 (reported on 12.5% of returns)
Here:
+$1,575
State:
+$31,684
(% of AGI for various income ranges: 126.0% for AGIs $75k-100k)
Profit/loss from business: +$5,175 (reported on 12.5% of returns)
Here:
+$5,175
State:
+$12,175
(% of AGI for various income ranges: 345.0% for AGIs $25k-50k)
Taxable individual retirement arrangement distribution: $8,600 (reported on 9.4% of returns)
61876:
$8,600
Illinois:
$21,613
(% of AGI for various income ranges: 430.0% for AGIs $25k-50k)
Earned income credit: $2,980 (reported on 15.6% of returns)
Here:
$2,980
State:
$2,311
(% of AGI for various income ranges: 111.2% for AGIs below $25k, 100.0% for AGIs $25k-50k)
Percentage of individuals using paid preparers for their 2020 taxes: 87.5%
Here:
88%
State:
93%
(% for various income ranges: 90.0% for AGIs below $25k, 85.7% for AGIs $25k-50k, 80.0% for AGIs $50k-75k, 100.0% for AGIs $75k-100k, 83.3% for AGIs $100k-200k)
Averages for the 2012 tax year for zip code 61876, filed in 2013:
Average Adjusted Gross Income (AGI) in 2012: $52,135 (Individual Income Tax Returns)
Here:
$52,135
State:
$68,058
Salary/wage: $37,125 (reported on 82.4% of returns)
Here:
$37,125
State:
$55,396
(% of AGI for various income ranges: 69.6% for AGIs below $25k, 78.6% for AGIs $25k-50k, 65.3% for AGIs $50k-75k, 74.2% for AGIs $75k-100k, 37.0% for AGIs $100k-200k)
Taxable interest for individuals: $710 (reported on 29.4% of returns)
This zip code:
$710
Illinois:
$1,969
(% of AGI for various income ranges: 0.4% for AGIs below $25k, 0.4% for AGIs $50k-75k, 0.8% for AGIs $100k-200k)
Ordinary dividends: $1,240 (reported on 14.7% of returns)
Here:
$1,240
State:
$7,786
Profit/loss from business: +$4,900 (reported on 11.8% of returns)
Here:
+$4,900
State:
+$12,903
Taxable individual retirement arrangement distribution: $7,467 (reported on 8.8% of returns)
61876:
$7,467
Illinois:
$17,929
Total itemized deductions: $17,317 (15% of AGI, reported on 17.6% of returns)
Here:
$17,317
State:
$26,433
Here:
15.2% of AGI
State:
19.2% of AGI
Charity contributions: $3,625 (reported on 11.8% of returns)
Here:
$3,625
State:
$4,525
Taxes paid: $7,417 (reported on 17.6% of returns)
61876:
$7,417
State:
$11,968
Earned income credit: $2,229 (reported on 20.6% of returns)
Here:
$2,229
State:
$2,349
(% of AGI for various income ranges: 6.5% for AGIs below $25k, 1.4% for AGIs $25k-50k)
Percentage of individuals using paid preparers for their 2012 taxes: 67.6%
Here:
68%
State:
57%
(% for various income ranges: 53.8% for AGIs below $25k, 66.7% for AGIs $25k-50k, 60.0% for AGIs $50k-75k, 100.0% for AGIs $75k-100k, 100.0% for AGIs $100k-200k)
Averages for the 2004 tax year for zip code 61876, filed in 2005:
Average Adjusted Gross Income (AGI) in 2004: $34,784 (Individual Income Tax Returns)
Here:
$34,784
State:
$54,625
Salary/wage: $29,942 (reported on 87.0% of returns)
Here:
$29,942
State:
$46,811
(% of AGI for various income ranges: 90.8% for AGIs below $10k, 66.7% for AGIs $10k-25k, 81.7% for AGIs $25k-50k, 82.9% for AGIs $50k-75k, 66.3% for AGIs $75k-100k, 61.5% for AGIs over 100k)
Taxable interest for individuals: $685 (reported on 36.4% of returns)
This zip code:
$685
Illinois:
$2,101
(% of AGI for various income ranges: 1.3% for AGIs below $10k, 0.9% for AGIs $10k-25k, 0.3% for AGIs $25k-50k, 0.3% for AGIs $50k-75k, 2.0% for AGIs $75k-100k, 0.7% for AGIs over 100k)
Taxable dividends: $538 (reported on 20.4% of returns)
Here:
$538
State:
$4,306
(% of AGI for various income ranges: 1.6% for AGIs below $10k, 0.3% for AGIs $10k-25k, 0.4% for AGIs $25k-50k, 0.1% for AGIs $50k-75k, 0.2% for AGIs $75k-100k, 0.5% for AGIs over 100k)
Net capital gain/loss: +$568 (reported on 11.2% of returns)
Here:
+$568
State:
+$17,321
Profit/loss from business: +$3,485 (reported on 16.8% of returns)
Here:
+$3,485
State:
+$11,771
(% of AGI for various income ranges: 11.5% for AGIs below $10k, 3.2% for AGIs $25k-50k, 1.2% for AGIs $50k-75k, 1.1% for AGIs $75k-100k)
Profit/loss from farming: +$1,269 (reported on 6.6% of returns)
Here:
+$1,269
State:
+$2,327
Total itemized deductions: $15,451 (20% of AGI, reported on 13.0% of returns)
Here:
$15,451
State:
$20,239
Here:
20.1% of AGI
State:
19.5% of AGI
(% of AGI for various income ranges: 4.4% for AGIs $25k-50k, 6.0% for AGIs $50k-75k, 7.8% for AGIs $75k-100k, 10.5% for AGIs over 100k)
Charity contributions deductions: $4,190 (5% of AGI, reported on 10.7% of returns)
Here:
$4,190
State:
$3,719
Here:
5.3% of AGI
State:
3.4% of AGI
(% of AGI for various income ranges: 1.9% for AGIs $50k-75k, 1.9% for AGIs $75k-100k, 2.8% for AGIs over 100k)
Total tax: $4,403 (reported on 72.0% of returns)
61876:
$4,403
State:
$9,882
(% of AGI for various income ranges: 2.4% for AGIs below $10k, 4.2% for AGIs $10k-25k, 6.4% for AGIs $25k-50k, 9.3% for AGIs $50k-75k, 11.1% for AGIs $75k-100k, 15.7% for AGIs over 100k)
Earned income credit: $1,687 (reported on 17.0% of returns)
Here:
$1,687
State:
$1,788
Percentage of individuals using paid preparers for their 2004 taxes: 65.6%
Here:
66%
State:
61%
(% for various income ranges: 52.6% for AGIs below $10k, 66.7% for AGIs $10k-25k, 62.1% for AGIs $25k-50k, 75.8% for AGIs $50k-75k, 92.0% for AGIs $75k-100k, 81.2% for AGIs over 100k)
Household received Food Stamps/SNAP in the past 12 months: 34 Household did not receive Food Stamps/SNAP in the past 12 months: 250
Women who had a birth in the past 12 months: 11 (0 now married, 11 unmarried) Women who did not have a birth in the past 12 months: 139 (95 now married, 42 unmarried)
Housing units in zip code 61876 with a mortgage: 133 Houses without a mortgage: 3
Median monthly owner costs for units with a mortgage: $1,153 Median monthly owner costs for units without a mortgage: $296
Residents with income below the poverty level in 2022:
This zip code:
10.3%
Whole state:
11.9%
Residents with income below 50% of the poverty level in 2022:
This zip code:
2.8%
Whole state:
5.7%
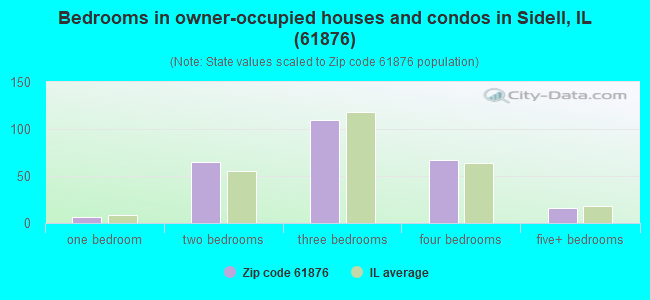
Median number of rooms in houses and condos:
Here:
6.5
State:
6.4
Median number of rooms in apartments:
Here:
6.8
State:
4.1
Notable locations in this zip code not listed on our city pages
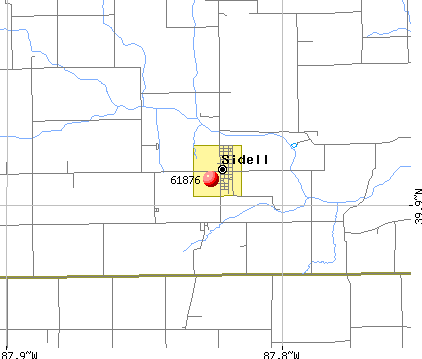
Streams, rivers, and creeks: Baum Branch (A), Archie Creek (B), Dillon Branch (C), Goodall Branch (D), Freedwell Branch (E). Display/hide their locations on the map
Size of family households: 95 2-persons, 32 3-persons, 30 4-persons, 35 5-persons, 15 6-persons, 3 7-or-more-persons
Size of nonfamily households: 59 1-person, 11 2-persons
199 married couples with children.
68 single-parent households (14 men, 54 women).
96.3% of residents of 61876 zip code speak English at home.
1.7% of residents speak Spanish at home (100% very well).
1.2% of residents speak other Indo-European language at home (100% very well).
0.3% of residents speak Asian or Pacific Island language at home (100% not well).
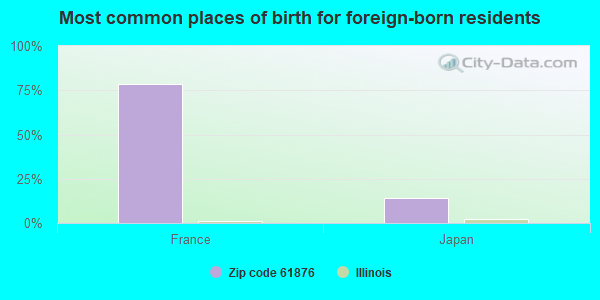
Foreign born population: 14 (1.7%) (43.1% of them are naturalized citizens)
This zip code:
1.7%
Whole state:
14.4%
79%France
14%Japan
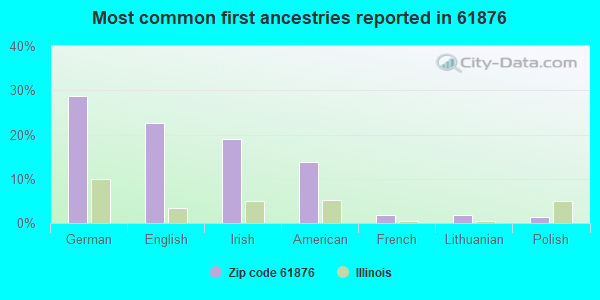
29%German
22%English
19%Irish
14%American
2%French
2%Lithuanian
1%Polish
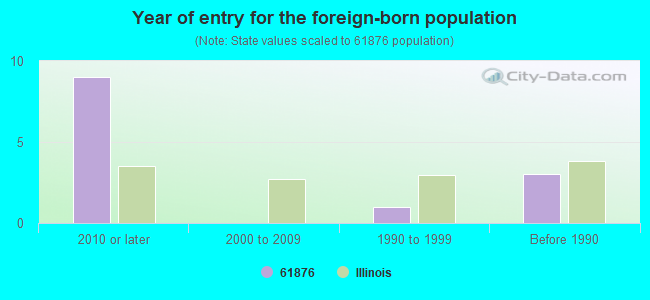
Year of entry for the foreign-born population
92010 or later
02000 to 2009
11990 to 1999
3Before 1990
Facilities with environmental interests located in this zip code:
LANMAN OIL CO INC (ORR & MAIN STREETS in SIDELL, IL)
STATE MASTER (Illinois EPA Project) - AIR PROGRAM AIR MINOR (AIRS/AFS) CRITERIA AND HAZARDOUS AIR POLLUTANT INVENTORY (Inventory of air pollution sources) Business SIC classification: PETROLEUM BULK STATIONS AND TERMINALS
JAMAICA HIGH SCHOOL (7087 N 600 E ROAD in SIDELL, IL)
(Geographic Names Information System) (National Center for Education Statistics) - STATE ID-5409201200001 Organizations: JAMAICA C U SCHOOL DIST 12 (SCHOOL DISTRICT)
JAMAICA ELEMENTARY SCHOOL (7087 N 600 E ROAD in SIDELL, IL)
(National Center for Education Statistics) - STATE ID-5409201202002 Organizations: JAMAICA C U SCHOOL DIST 12 (SCHOOL DISTRICT)
JAMAICA JR HIGH SCHOOL (7087 N 600 E ROAD in SIDELL, IL)
(National Center for Education Statistics) - STATE ID-5409201201001 Organizations: JAMAICA C U SCHOOL DIST 12 (SCHOOL DISTRICT)
ILLINI FS, INC. - SIDELL NH3 (3044 N 470 E RD in SIDELL, IL)
ENFORCEMENT/COMPLIANCE ACTIVITY (Integrated Compliance Information System)
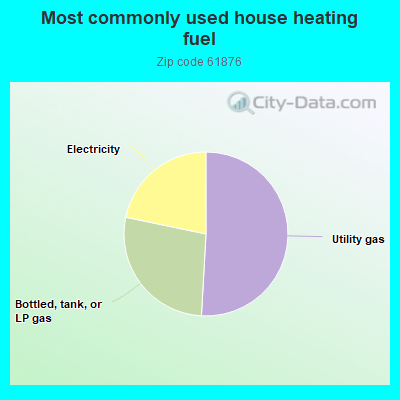
Housing units lacking complete plumbing facilities: 2.5% Housing units lacking complete kitchen facilities: 3.1%
51.1%Utility gas
27.5%Bottled, tank, or LP gas
21.8%Electricity
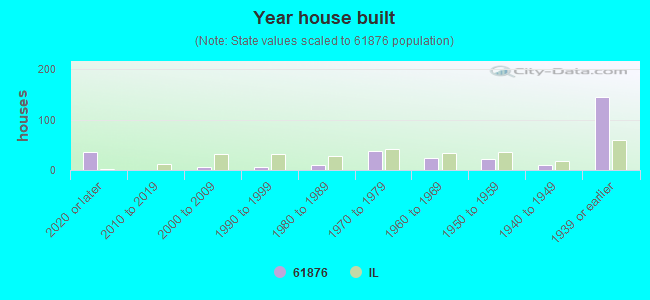
Population in 1990: 703. Population change in the 1990s: +148 (+21.1%).
Place of birth for U.S.-born residents:
This state: 711
Northeast: 22
Midwest: 41
South: 2
West: 27
62% of the 61876 zip code residents lived in the same house 5 years ago. Out of people who lived in different houses, 59% lived in this county. Out of people who lived in different counties, 50% lived in Illinois.
100% of the 61876 zip code residents lived in the same house 1 year ago.
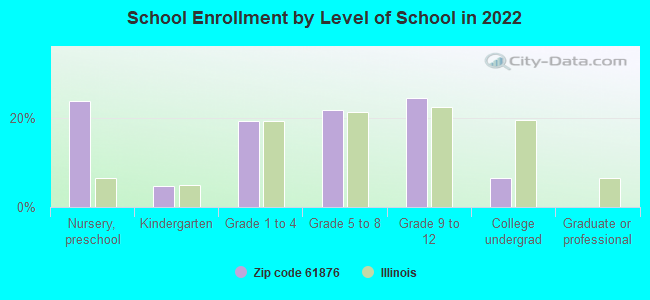
Private vs. public school enrollment:
Students in private schools in grades 1 to 8 (elementary and middle school): 10
Here:
10.2%
Illinois:
13.3%
Students in private schools in grades 9 to 12 (high school): 2
Here:
4.9%
Illinois:
9.9%
Students in private undergraduate colleges:
Here:
0.0%
Illinois:
27.4%
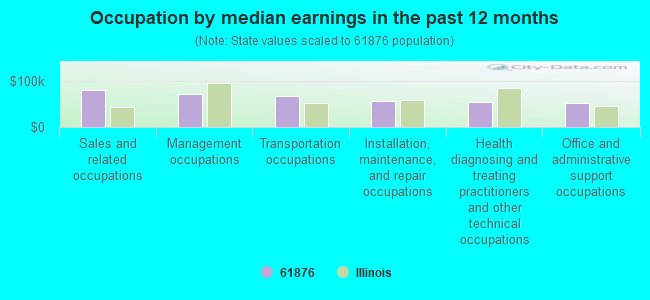
Occupation by median earnings in the past 12 months ($)
80,204Sales and related occupations
70,639Management occupations
66,684Transportation occupations
55,683Installation, maintenance, and repair occupations
54,594Health diagnosing and treating practitioners and other technical occupations
51,479Office and administrative support occupations
Top industries in this zip code by the number of employees in 2005:
Construction: Commercial and Institutional Building Construction (20-49 employees: 1 establishment)
Accommodation and Food Services: Full-Service Restaurants (5-9: 1)
Finance and Insurance: Commercial Banking (5-9: 1)
Finance and Insurance: Insurance Agencies and Brokerages (5-9: 1)
Wholesale Trade: Grain and Field Bean Merchant Wholesalers (5-9: 1)
Administrative and Support and Waste Management and Remediation Services: Document Preparation Services (5-9: 1)
Accommodation and Food Services: Drinking Places (Alcoholic Beverages) (1-4: 2)
Home Mortgage Disclosure Act Aggregated Statistics For Year 2009 (Based on 2 partial tracts)
A) FHA, FSA/RHS & VA Home Purchase Loans
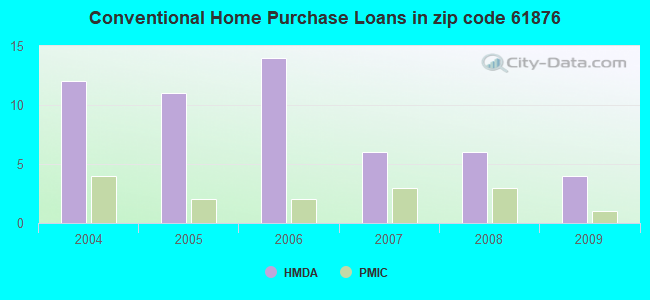
B) Conventional Home Purchase Loans
C) Refinancings
D) Home Improvement Loans
F) Non-occupant Loans on < 5 Family Dwellings (A B C & D)
G) Loans On Manufactured Home Dwelling (A B C & D)
Number
Average Value
Number
Average Value
Number
Average Value
Number
Average Value
Number
Average Value
Number
Average Value
LOANS ORIGINATED
2
$131,140
4
$71,775
18
$117,874
2
$58,190
2
$28,175
1
$70,430
APPLICATIONS APPROVED, NOT ACCEPTED
0
$0
0
$0
1
$209,290
0
$0
0
$0
0
$0
APPLICATIONS DENIED
0
$0
1
$50,650
8
$80,705
0
$0
1
$25,490
1
$33,200
APPLICATIONS WITHDRAWN
1
$48,970
0
$0
4
$70,518
0
$0
0
$0
0
$0
FILES CLOSED FOR INCOMPLETENESS
0
$0
0
$0
1
$125,100
0
$0
0
$0
0
$0
Aggregated Statistics For Year 2008 (Based on 2 partial tracts)
A) FHA, FSA/RHS & VA Home Purchase Loans
B) Conventional Home Purchase Loans
C) Refinancings
D) Home Improvement Loans
F) Non-occupant Loans on < 5 Family Dwellings (A B C & D)
G) Loans On Manufactured Home Dwelling (A B C & D)
Number
Average Value
Number
Average Value
Number
Average Value
Number
Average Value
Number
Average Value
Number
Average Value
LOANS ORIGINATED
1
$72,450
6
$81,447
13
$84,237
3
$28,620
2
$68,085
1
$129,460
APPLICATIONS APPROVED, NOT ACCEPTED
0
$0
0
$0
2
$112,190
0
$0
0
$0
0
$0
APPLICATIONS DENIED
0
$0
1
$45,280
6
$127,005
6
$48,857
0
$0
1
$11,740
APPLICATIONS WITHDRAWN
0
$0
0
$0
2
$130,305
1
$108,330
0
$0
0
$0
FILES CLOSED FOR INCOMPLETENESS
0
$0
1
$103,640
1
$114,710
1
$40,580
0
$0
0
$0
Aggregated Statistics For Year 2007 (Based on 2 partial tracts)
A) FHA, FSA/RHS & VA Home Purchase Loans
B) Conventional Home Purchase Loans
C) Refinancings
D) Home Improvement Loans
F) Non-occupant Loans on < 5 Family Dwellings (A B C & D)
G) Loans On Manufactured Home Dwelling (A B C & D)
Number
Average Value
Number
Average Value
Number
Average Value
Number
Average Value
Number
Average Value
Number
Average Value
LOANS ORIGINATED
1
$98,610
6
$67,918
15
$74,660
4
$32,702
1
$33,200
1
$43,600
APPLICATIONS APPROVED, NOT ACCEPTED
0
$0
1
$85,860
3
$62,607
1
$14,760
0
$0
0
$0
APPLICATIONS DENIED
0
$0
1
$72,110
12
$142,601
4
$56,348
0
$0
1
$102,630
APPLICATIONS WITHDRAWN
0
$0
1
$50,980
4
$140,112
0
$0
0
$0
0
$0
FILES CLOSED FOR INCOMPLETENESS
0
$0
0
$0
1
$297,160
0
$0
0
$0
0
$0
Aggregated Statistics For Year 2006 (Based on 2 partial tracts)
A) FHA, FSA/RHS & VA Home Purchase Loans
B) Conventional Home Purchase Loans
C) Refinancings
D) Home Improvement Loans
F) Non-occupant Loans on < 5 Family Dwellings (A B C & D)
G) Loans On Manufactured Home Dwelling (A B C & D)
Number
Average Value
Number
Average Value
Number
Average Value
Number
Average Value
Number
Average Value
Number
Average Value
LOANS ORIGINATED
1
$77,480
14
$81,382
13
$76,110
6
$44,273
3
$41,477
1
$84,190
APPLICATIONS APPROVED, NOT ACCEPTED
0
$0
1
$78,150
1
$92,230
0
$0
0
$0
0
$0
APPLICATIONS DENIED
0
$0
3
$65,180
13
$105,471
4
$68,085
0
$0
0
$0
APPLICATIONS WITHDRAWN
0
$0
1
$78,150
9
$106,881
0
$0
1
$41,590
1
$39,240
FILES CLOSED FOR INCOMPLETENESS
0
$0
0
$0
1
$68,420
0
$0
0
$0
0
$0
Aggregated Statistics For Year 2005 (Based on 2 partial tracts)
A) FHA, FSA/RHS & VA Home Purchase Loans
B) Conventional Home Purchase Loans
C) Refinancings
D) Home Improvement Loans
F) Non-occupant Loans on < 5 Family Dwellings (A B C & D)
G) Loans On Manufactured Home Dwelling (A B C & D)
Number
Average Value
Number
Average Value
Number
Average Value
Number
Average Value
Number
Average Value
Number
Average Value
LOANS ORIGINATED
2
$98,775
11
$74,245
15
$98,317
3
$50,870
2
$54,165
1
$105,990
APPLICATIONS APPROVED, NOT ACCEPTED
0
$0
1
$143,890
2
$54,505
0
$0
0
$0
0
$0
APPLICATIONS DENIED
0
$0
3
$62,830
15
$105,629
2
$58,525
0
$0
1
$64,730
APPLICATIONS WITHDRAWN
0
$0
1
$134,160
2
$131,140
1
$106,660
0
$0
0
$0
FILES CLOSED FOR INCOMPLETENESS
0
$0
0
$0
2
$61,380
0
$0
0
$0
0
$0
Aggregated Statistics For Year 2004 (Based on 2 partial tracts)
A) FHA, FSA/RHS & VA Home Purchase Loans
B) Conventional Home Purchase Loans
C) Refinancings
D) Home Improvement Loans
F) Non-occupant Loans on < 5 Family Dwellings (A B C & D)
G) Loans On Manufactured Home Dwelling (A B C & D)


 Nearest zip codes: 61810, 61940, 61850, 61932, 61841, 61816.