Estimated zip code population in 2022: 6,586 Zip code population in 2010: 6,654 Zip code population in 2000: 6,563
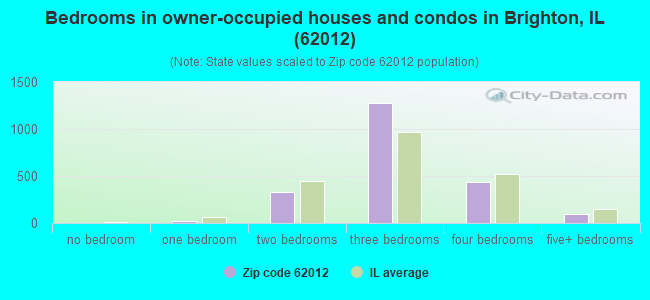
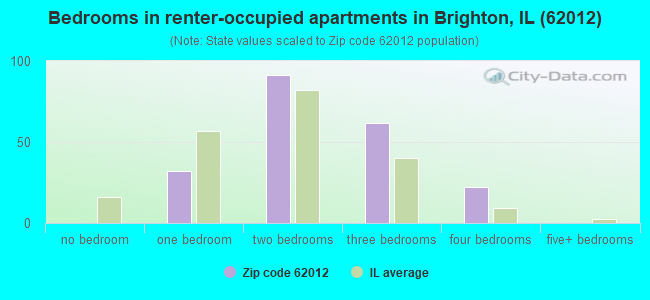
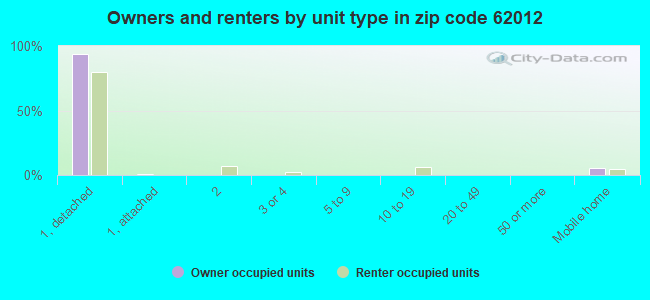
Houses and condos: 2,851 Renter-occupied apartments: 212
% of renters here:
9%
State:
33%
March 2022 cost of living index in zip code 62012: 94.0 (less than average, U.S. average is 100)
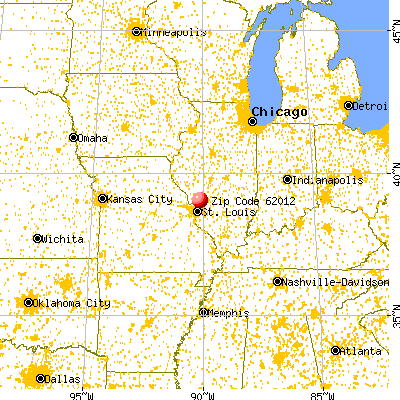
Land area: 59.5 sq. mi. Water area: 0.4 sq. mi.
Population density: 111 people per square mile
(very low).
OSM Map
General Map
Google Map
MSN Map
OSM Map
General Map
Google Map
MSN Map
OSM Map
General Map
Google Map
MSN Map
OSM Map
General Map
Google Map
MSN Map
Please wait while loading the map...
Real estate property taxes paid for housing units in 2022:
This zip code:
1.8% ($2,845)
Illinois:
2.0% ($4,912)
Median real estate property taxes paid for housing units with mortgages in 2022: $2,803 (1.7%) Median real estate property taxes paid for housing units with no mortgage in 2022: $2,908 (1.9%)
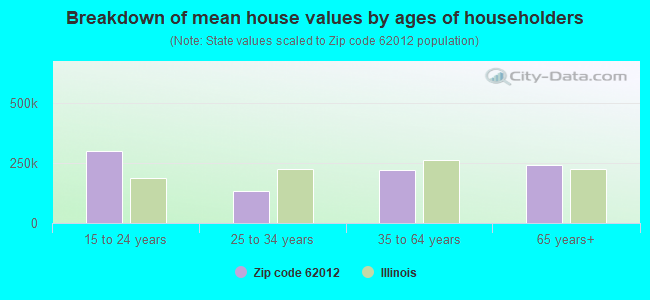
Estimated median house/condo value in 2022: $162,472
62012:
$162,472
Illinois:
$251,600
According to our research of Illinois and other state lists, there were 5 registered sex offenders living in 62012 zip code as of May 30, 2024. The ratio of all residents to sex offenders in zip code 62012 is 1,322 to 1. The ratio of registered sex offenders to all residents in this zip code is lower than the state average.
Median resident age:
This zip code:
41.6 years
Illinois median age:
39.1 years
Average household size:
This zip code:
2.7 people
Illinois:
2.4 people
Averages for the 2020 tax year for zip code 62012, filed in 2021:
Average Adjusted Gross Income (AGI) in 2020: $66,720 (Individual Income Tax Returns)
Here:
$66,720
State:
$82,626
Salary/wage: $58,990 (reported on 80.6% of returns)
Here:
$58,990
State:
$66,640
(% of AGI for various income ranges: 1119.5% for AGIs below $25k, 3360.0% for AGIs $25k-50k, 6268.9% for AGIs $50k-75k, 9375.0% for AGIs $75k-100k, 16052.5% for AGIs $100k-200k, 53833.3% for AGIs over 200k)
Taxable interest for individuals: $1,053 (reported on 36.0% of returns)
This zip code:
$1,053
Illinois:
$2,376
(% of AGI for various income ranges: 24.0% for AGIs below $25k, 30.2% for AGIs $25k-50k, 35.9% for AGIs $50k-75k, 66.4% for AGIs $75k-100k, 69.8% for AGIs $100k-200k, 1083.3% for AGIs over 200k)
Ordinary dividends: $2,992 (reported on 19.7% of returns)
Here:
$2,992
State:
$9,061
(% of AGI for various income ranges: 27.4% for AGIs below $25k, 30.6% for AGIs $25k-50k, 64.1% for AGIs $50k-75k, 72.1% for AGIs $75k-100k, 129.0% for AGIs $100k-200k, 2093.3% for AGIs over 200k)
Net capital gain/loss in AGI: +$6,288 (reported on 15.7% of returns)
Here:
+$6,288
State:
+$31,684
(% of AGI for various income ranges: 5.3% for AGIs below $25k, 19.4% for AGIs $25k-50k, 29.5% for AGIs $50k-75k, 97.9% for AGIs $75k-100k, 288.5% for AGIs $100k-200k, 5113.3% for AGIs over 200k)
Profit/loss from business: +$8,780 (reported on 10.8% of returns)
Here:
+$8,780
State:
+$12,175
(% of AGI for various income ranges: 88.9% for AGIs below $25k, 50.4% for AGIs $25k-50k, 160.8% for AGIs $50k-75k, 193.6% for AGIs $75k-100k, 166.2% for AGIs $100k-200k, 1510.0% for AGIs over 200k)
Taxable individual retirement arrangement distribution: $18,092 (reported on 11.7% of returns)
62012:
$18,092
Illinois:
$21,613
(% of AGI for various income ranges: 75.3% for AGIs below $25k, 111.7% for AGIs $25k-50k, 224.9% for AGIs $50k-75k, 414.3% for AGIs $75k-100k, 683.0% for AGIs $100k-200k, 3640.0% for AGIs over 200k)
Total itemized deductions: $25,800 (reported on 4.0% of returns)
Here:
$25,800
State:
$34,948
(% of AGI for various income ranges: 177.2% for AGIs $25k-50k, 181.4% for AGIs $75k-100k, 270.8% for AGIs $100k-200k, 2746.7% for AGIs over 200k)
Charity contributions: $10,044 (reported on 2.8% of returns)
Here:
$10,044
State:
$13,122
(% of AGI for various income ranges: 44.6% for AGIs $50k-75k, 94.0% for AGIs $100k-200k, 1210.0% for AGIs over 200k)
Taxes paid: $7,338 (reported on 4.0% of returns)
62012:
$7,338
State:
$8,563
(% of AGI for various income ranges: 34.3% for AGIs $25k-50k, 68.2% for AGIs $75k-100k, 89.8% for AGIs $100k-200k, 740.0% for AGIs over 200k)
Earned income credit: $2,103 (reported on 10.5% of returns)
Here:
$2,103
State:
$2,311
(% of AGI for various income ranges: 72.3% for AGIs below $25k, 50.4% for AGIs $25k-50k)
Percentage of individuals using paid preparers for their 2020 taxes: 94.8%
Here:
95%
State:
93%
(% for various income ranges: 93.4% for AGIs below $25k, 95.6% for AGIs $25k-50k, 94.2% for AGIs $50k-75k, 95.1% for AGIs $75k-100k, 95.2% for AGIs $100k-200k, 100.0% for AGIs over 200k)
Averages for the 2012 tax year for zip code 62012, filed in 2013:
Average Adjusted Gross Income (AGI) in 2012: $56,493 (Individual Income Tax Returns)
Here:
$56,493
State:
$68,058
Salary/wage: $48,582 (reported on 84.0% of returns)
Here:
$48,582
State:
$55,396
(% of AGI for various income ranges: 69.6% for AGIs below $25k, 72.7% for AGIs $25k-50k, 77.1% for AGIs $50k-75k, 78.3% for AGIs $75k-100k, 77.7% for AGIs $100k-200k, 37.0% for AGIs over 200k)
Taxable interest for individuals: $1,059 (reported on 39.3% of returns)
This zip code:
$1,059
Illinois:
$1,969
(% of AGI for various income ranges: 1.4% for AGIs below $25k, 0.9% for AGIs $25k-50k, 0.6% for AGIs $50k-75k, 0.6% for AGIs $75k-100k, 0.5% for AGIs $100k-200k, 1.3% for AGIs over 200k)
Ordinary dividends: $2,506 (reported on 20.8% of returns)
Here:
$2,506
State:
$7,786
(% of AGI for various income ranges: 1.2% for AGIs below $25k, 0.9% for AGIs $25k-50k, 0.6% for AGIs $50k-75k, 1.0% for AGIs $75k-100k, 1.1% for AGIs $100k-200k, 0.7% for AGIs over 200k)
Net capital gain/loss in AGI: +$4,700 (reported on 13.5% of returns)
Here:
+$4,700
State:
+$22,183
(% of AGI for various income ranges: 0.3% for AGIs $25k-50k, 0.3% for AGIs $50k-75k, 0.3% for AGIs $75k-100k, 1.0% for AGIs $100k-200k, 6.8% for AGIs over 200k)
Profit/loss from business: +$12,834 (reported on 12.9% of returns)
Here:
+$12,834
State:
+$12,903
(% of AGI for various income ranges: 3.7% for AGIs below $25k, 2.1% for AGIs $25k-50k, 1.7% for AGIs $50k-75k, 1.2% for AGIs $75k-100k, 6.0% for AGIs $100k-200k)
Taxable individual retirement arrangement distribution: $12,574 (reported on 11.9% of returns)
62012:
$12,574
Illinois:
$17,929
(% of AGI for various income ranges: 3.1% for AGIs below $25k, 3.8% for AGIs $25k-50k, 2.3% for AGIs $50k-75k, 2.9% for AGIs $75k-100k, 3.0% for AGIs $100k-200k)
Total itemized deductions: $18,512 (19% of AGI, reported on 30.5% of returns)
Here:
$18,512
State:
$26,433
Here:
18.8% of AGI
State:
19.2% of AGI
(% of AGI for various income ranges: 5.6% for AGIs below $25k, 8.1% for AGIs $25k-50k, 9.7% for AGIs $50k-75k, 10.9% for AGIs $75k-100k, 12.4% for AGIs $100k-200k, 7.5% for AGIs over 200k)
Charity contributions: $3,391 (reported on 21.1% of returns)
Here:
$3,391
State:
$4,525
(% of AGI for various income ranges: 0.5% for AGIs below $25k, 1.0% for AGIs $25k-50k, 1.1% for AGIs $50k-75k, 1.3% for AGIs $75k-100k, 1.6% for AGIs $100k-200k, 1.3% for AGIs over 200k)
Taxes paid: $7,602 (reported on 30.5% of returns)
62012:
$7,602
State:
$11,968
(% of AGI for various income ranges: 1.2% for AGIs below $25k, 2.4% for AGIs $25k-50k, 3.5% for AGIs $50k-75k, 4.2% for AGIs $75k-100k, 5.7% for AGIs $100k-200k, 4.8% for AGIs over 200k)
Earned income credit: $1,982 (reported on 13.8% of returns)
Here:
$1,982
State:
$2,349
(% of AGI for various income ranges: 4.9% for AGIs below $25k, 0.9% for AGIs $25k-50k)
Percentage of individuals using paid preparers for their 2012 taxes: 65.4%
Here:
65%
State:
57%
(% for various income ranges: 56.4% for AGIs below $25k, 65.2% for AGIs $25k-50k, 72.2% for AGIs $50k-75k, 70.7% for AGIs $75k-100k, 73.8% for AGIs $100k-200k, 80.0% for AGIs over 200k)
Averages for the 2004 tax year for zip code 62012, filed in 2005:
Average Adjusted Gross Income (AGI) in 2004: $45,535 (Individual Income Tax Returns)
Here:
$45,535
State:
$54,625
Salary/wage: $39,037 (reported on 88.1% of returns)
Here:
$39,037
State:
$46,811
(% of AGI for various income ranges: 106.7% for AGIs below $10k, 73.3% for AGIs $10k-25k, 80.6% for AGIs $25k-50k, 85.0% for AGIs $50k-75k, 85.3% for AGIs $75k-100k, 52.8% for AGIs over 100k)
Taxable interest for individuals: $1,094 (reported on 48.6% of returns)
This zip code:
$1,094
Illinois:
$2,101
(% of AGI for various income ranges: 6.0% for AGIs below $10k, 2.6% for AGIs $10k-25k, 1.1% for AGIs $25k-50k, 0.6% for AGIs $50k-75k, 0.9% for AGIs $75k-100k, 1.2% for AGIs over 100k)
Taxable dividends: $1,814 (reported on 22.3% of returns)
Here:
$1,814
State:
$4,306
(% of AGI for various income ranges: 1.6% for AGIs below $10k, 1.4% for AGIs $10k-25k, 0.6% for AGIs $25k-50k, 0.3% for AGIs $50k-75k, 0.5% for AGIs $75k-100k, 1.8% for AGIs over 100k)
Net capital gain/loss: +$5,483 (reported on 15.7% of returns)
Here:
+$5,483
State:
+$17,321
(% of AGI for various income ranges: 0.1% for AGIs below $10k, 1.0% for AGIs $10k-25k, 0.6% for AGIs $25k-50k, 0.6% for AGIs $50k-75k, 0.9% for AGIs $75k-100k, 5.5% for AGIs over 100k)
Profit/loss from business: +$6,812 (reported on 14.5% of returns)
Here:
+$6,812
State:
+$11,771
(% of AGI for various income ranges: 4.7% for AGIs below $10k, 3.9% for AGIs $10k-25k, 2.0% for AGIs $25k-50k, 2.2% for AGIs $50k-75k, 0.8% for AGIs $75k-100k, 2.6% for AGIs over 100k)
IRA payment deduction: $3,206 (reported on 2.0% of returns)
62012:
$3,206
Illinois:
$3,087
Total itemized deductions: $15,535 (19% of AGI, reported on 29.5% of returns)
Here:
$15,535
State:
$20,239
Here:
19.1% of AGI
State:
19.5% of AGI
(% of AGI for various income ranges: 7.3% for AGIs below $10k, 8.9% for AGIs $10k-25k, 9.0% for AGIs $25k-50k, 9.9% for AGIs $50k-75k, 11.3% for AGIs $75k-100k, 10.6% for AGIs over 100k)
Charity contributions deductions: $2,322 (3% of AGI, reported on 23.4% of returns)
Here:
$2,322
State:
$3,719
Here:
3.0% of AGI
State:
3.4% of AGI
(% of AGI for various income ranges: 0.9% for AGIs $10k-25k, 1.0% for AGIs $25k-50k, 1.3% for AGIs $50k-75k, 1.5% for AGIs $75k-100k, 1.1% for AGIs over 100k)
Total tax: $5,670 (reported on 78.7% of returns)
62012:
$5,670
State:
$9,882
(% of AGI for various income ranges: 2.2% for AGIs below $10k, 4.0% for AGIs $10k-25k, 6.6% for AGIs $25k-50k, 8.2% for AGIs $50k-75k, 10.5% for AGIs $75k-100k, 15.9% for AGIs over 100k)
Earned income credit: $1,634 (reported on 11.4% of returns)
Here:
$1,634
State:
$1,788
Percentage of individuals using paid preparers for their 2004 taxes: 69.6%
Here:
70%
State:
61%
(% for various income ranges: 57.6% for AGIs below $10k, 67.9% for AGIs $10k-25k, 73.0% for AGIs $25k-50k, 77.8% for AGIs $50k-75k, 69.0% for AGIs $75k-100k, 75.3% for AGIs over 100k)
Likely homosexual households (counted as self-reported same-sex unmarried-partner households)
Lesbian couples: 0.5% of all households
Gay men: 0.3% of all households
Household received Food Stamps/SNAP in the past 12 months: 232 Household did not receive Food Stamps/SNAP in the past 12 months: 2,121
Women who had a birth in the past 12 months: 55 (55 now married, 0 unmarried) Women who did not have a birth in the past 12 months: 1,161 (623 now married, 531 unmarried)
Housing units in zip code 62012 with a mortgage: 1,277 (135 second mortgage, 135 both second mortgage and home equity loan) Houses without a mortgage: 42
Median monthly owner costs for units with a mortgage: $1,298 Median monthly owner costs for units without a mortgage: $646
Residents with income below the poverty level in 2022:
This zip code:
9.8%
Whole state:
11.9%
Residents with income below 50% of the poverty level in 2022:
This zip code:
6.7%
Whole state:
5.7%
Median number of rooms in houses and condos:
Here:
6.3
State:
6.4
Median number of rooms in apartments:
Here:
5.2
State:
4.1
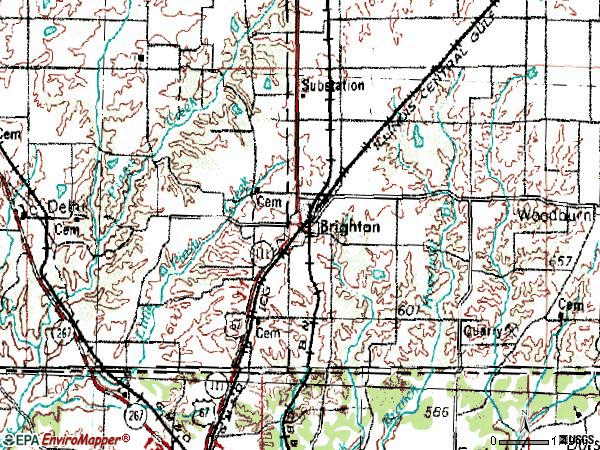
Notable locations in this zip code not listed on our city pages
Cemeteries: Botts Cemetery (1), Eldridge Cemetery (2), Saint Alphonsus Cemetery (3), Asbury Cemetery (4), Dehne Cemetery (5), Baptist Church Cemetery (6), Asbury Cemetery (7). Display/hide their locations on the map
Reservoirs: Thunderbird Lake (A), Jones Pond (B), Illinois No Name Number 2042 Reservoir (C), Feyerabend Pond (D), Craig Lake (E), Lake Piasa (F), Crystal Lake (G), Evergreen Lake (H). Display/hide their locations on the map
In group quarters: 61 (-1 institutionalized population)
Size of family households: 926 2-persons, 407 3-persons, 413 4-persons, 123 5-persons, 34 6-persons, 21 7-or-more-persons
Size of nonfamily households: 387 1-person, 36 2-persons
960 married couples with children.
443 single-parent households (43 men, 400 women).
99.2% of residents of 62012 zip code speak English at home.
0.3% of residents speak other Indo-European language at home (100% very well).
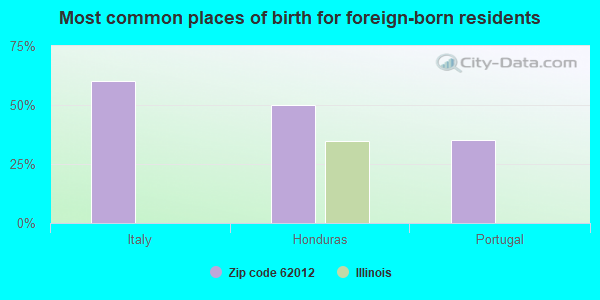
Foreign born population: 20 (0.3%) (45.2% of them are naturalized citizens)
This zip code:
0.3%
Whole state:
14.4%
60%Italy
50%Honduras
35%Portugal
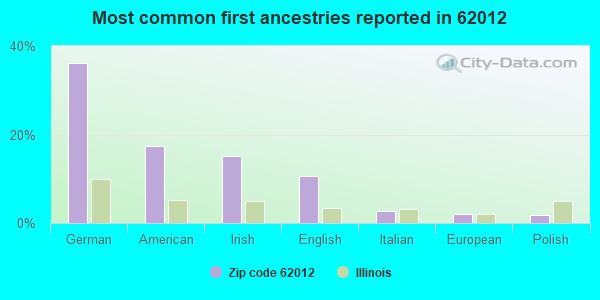
36%German
17%American
15%Irish
11%English
3%Italian
2%European
2%Polish
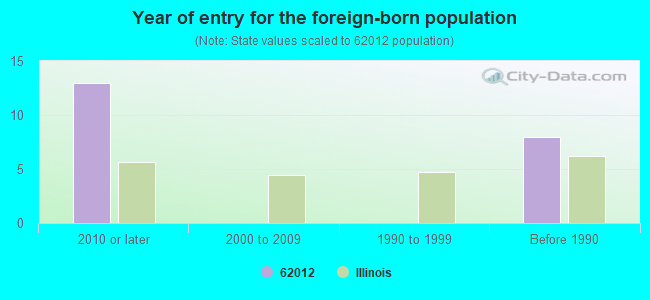
Year of entry for the foreign-born population
132010 or later
02000 to 2009
01990 to 1999
8Before 1990
Facilities with environmental interests located in this zip code:
ROWENS KENNELS (2400 OWENS LANE in BRIGHTON, IL)
STATE MASTER (Illinois EPA Project) - AIR PROGRAM AIR MINOR (AIRS/AFS) CRITERIA AND HAZARDOUS AIR POLLUTANT INVENTORY (Inventory of air pollution sources) Business SIC classification: ANIMAL SPECIALTY SERVICES, EXCEPT VETERINARY
DAVE & DAN AUTO SALVAGE (ROUTE 1, BOX 422A in BRIGHTON, IL)
STATE MASTER (Illinois EPA Project) - AIR PROGRAM AIR MINOR (AIRS/AFS) Business SIC classification: NONCLASSIFIABLE ESTABLISHMENTS
COMPAK WASTE COVER (50 TURPENING LANE in BRIGHTON, IL)
STATE MASTER (Illinois EPA Project) - HAZARDOUS WASTE PROGRAM Conditionally Exempt Small Quantity Generators, less than 100 kg/month of hazardous waste (Resource Conservation and Recovery Act (tracking hazardous waste)) - notification Organizations: COM PAK (CONTACT/OWNER)
ILL BELL TEL CO BRIGHTON C D O (PLUM & MAIN ST in BRIGHTON, IL)
(Resource Conservation and Recovery Act (tracking hazardous waste))
M & R DELIVERY SERVICE, INC. (IRISH LANE in BRIGHTON, IL)
National Pollutant Discharge Elimination System NON-MAJOR (Tracking pollutant discharge elimination systems) - permit
Housing units lacking complete plumbing facilities: 1.1% Housing units lacking complete kitchen facilities: 4.1%
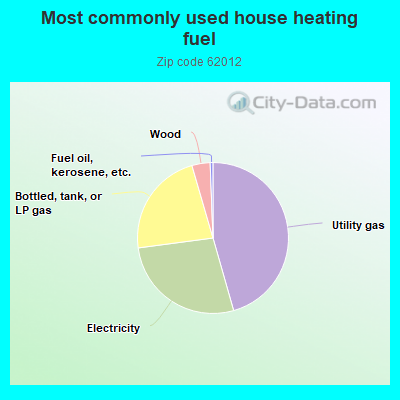
45.6%Utility gas
27.3%Electricity
22.6%Bottled, tank, or LP gas
3.9%Wood
0.6%Fuel oil, kerosene, etc.
Population in 1990: 6,467. Population change in the 1990s: +96 (+1.5%).
Place of birth for U.S.-born residents:
This state: 5,119
Northeast: 81
Midwest: 1,044
South: 177
West: 127
63% of the 62012 zip code residents lived in the same house 5 years ago. Out of people who lived in different houses, 36% lived in this county. Out of people who lived in different counties, 50% lived in Illinois.
94% of the 62012 zip code residents lived in the same house 1 year ago. Out of people who lived in different houses, 23% moved from this county. Out of people who lived in different houses, 55% moved from different county within same state. Out of people who lived in different houses, 28% moved from different state.
Private vs. public school enrollment:
Students in private schools in grades 1 to 8 (elementary and middle school):
Here:
0.0%
Illinois:
13.3%
Students in private schools in grades 9 to 12 (high school): 18
Here:
4.9%
Illinois:
9.9%
Students in private undergraduate colleges: 55
Here:
24.3%
Illinois:
27.4%
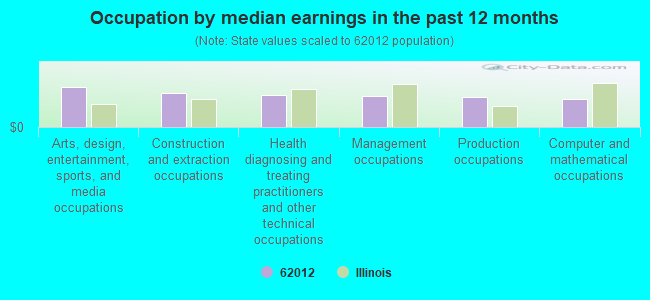
Occupation by median earnings in the past 12 months ($)
94,561Arts, design, entertainment, sports, and media occupations
79,990Construction and extraction occupations
76,042Health diagnosing and treating practitioners and other technical occupations
74,490Management occupations
71,567Production occupations
67,392Computer and mathematical occupations
Companies with federal contracts located in this zip code:
GAIL E STEPHENS (110 RANSOM ST , SUITE A in BRIGHTON, IL; small business)
$9,097 with Army for Nuts and Washers. Signed on 2002-11-18. Completion date: 2003-03-14.
Top industries in this zip code by the number of employees in 2005:
Health Care and Social Assistance: Nursing Care Facilities (50-99 employees: 1 establishment)
Professional, Scientific, and Technical Services: Other Accounting Services (20-49: 1)
Administrative and Support and Waste Management and Remediation Services: Janitorial Services (10-19: 1, 5-9: 1, 1-4: 1)
Construction: Water and Sewer Line and Related Structures Construction (10-19: 1, 1-4: 1)
Wholesale Trade: Recyclable Material Merchant Wholesalers (10-19: 1)
Construction: Other Building Finishing Contractors (10-19: 1)
Accommodation and Food Services: Full-Service Restaurants (10-19: 1)
People in group quarters in 2010:
57 people in nursing facilities/skilled-nursing facilities
People in group quarters in 2000:
63 people in nursing homes
Fatal accident statistics in 2012:
Fatal accident count: 1
Vehicles involved in fatal accidents: 2
Fatal accidents caused by drunken drivers: 0
Fatalities: 1
Persons involved in fatal accidents: 2
Pedestrians involved in fatal accidents: 0
Fatal accident statistics in 2010:
Fatal accident count: 1
Vehicles involved in fatal accidents: 2
Fatal accidents caused by drunken drivers: 0
Fatalities: 1
Persons involved in fatal accidents: 3
Pedestrians involved in fatal accidents: 0
Home Mortgage Disclosure Act Aggregated Statistics For Year 2009 (Based on 4 partial tracts)
A) FHA, FSA/RHS & VA Home Purchase Loans
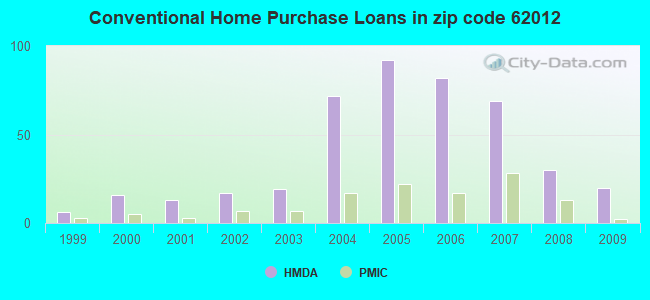
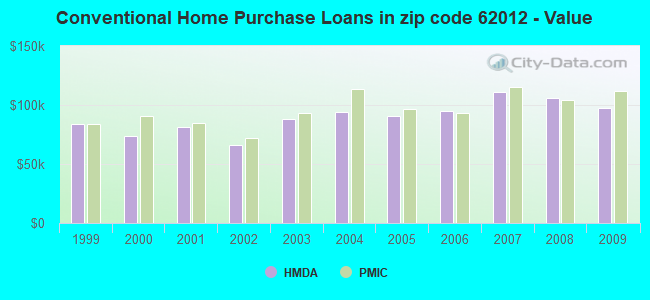
B) Conventional Home Purchase Loans
C) Refinancings
D) Home Improvement Loans
F) Non-occupant Loans on < 5 Family Dwellings (A B C & D)
G) Loans On Manufactured Home Dwelling (A B C & D)
Number
Average Value
Number
Average Value
Number
Average Value
Number
Average Value
Number
Average Value
Number
Average Value
LOANS ORIGINATED
24
$108,172
20
$97,454
172
$120,952
14
$45,518
16
$83,703
9
$68,489
APPLICATIONS APPROVED, NOT ACCEPTED
3
$154,633
2
$106,365
7
$139,453
1
$9,110
0
$0
1
$60,690
APPLICATIONS DENIED
4
$137,835
5
$81,550
35
$113,602
6
$68,650
2
$190,595
2
$99,445
APPLICATIONS WITHDRAWN
2
$95,160
2
$74,720
15
$119,721
2
$5,135
1
$30,930
0
$0
FILES CLOSED FOR INCOMPLETENESS
1
$86,280
0
$0
2
$101,805
0
$0
0
$0
0
$0
Aggregated Statistics For Year 2008 (Based on 4 partial tracts)
A) FHA, FSA/RHS & VA Home Purchase Loans
B) Conventional Home Purchase Loans
C) Refinancings
D) Home Improvement Loans
F) Non-occupant Loans on < 5 Family Dwellings (A B C & D)
G) Loans On Manufactured Home Dwelling (A B C & D)
Number
Average Value
Number
Average Value
Number
Average Value
Number
Average Value
Number
Average Value
Number
Average Value
LOANS ORIGINATED
16
$106,402
30
$105,664
103
$125,368
11
$36,656
11
$64,503
5
$65,808
APPLICATIONS APPROVED, NOT ACCEPTED
1
$112,070
3
$106,113
6
$150,233
1
$45,940
0
$0
0
$0
APPLICATIONS DENIED
3
$95,077
4
$88,778
47
$116,711
14
$78,651
2
$49,300
2
$41,830
APPLICATIONS WITHDRAWN
1
$63,960
5
$106,118
21
$120,140
1
$73,680
2
$54,845
1
$33,640
FILES CLOSED FOR INCOMPLETENESS
0
$0
0
$0
5
$144,138
0
$0
0
$0
0
$0
Aggregated Statistics For Year 2007 (Based on 4 partial tracts)
A) FHA, FSA/RHS & VA Home Purchase Loans
B) Conventional Home Purchase Loans
C) Refinancings
D) Home Improvement Loans
F) Non-occupant Loans on < 5 Family Dwellings (A B C & D)
G) Loans On Manufactured Home Dwelling (A B C & D)
Number
Average Value
Number
Average Value
Number
Average Value
Number
Average Value
Number
Average Value
Number
Average Value
LOANS ORIGINATED
6
$111,772
69
$111,049
97
$105,212
22
$36,706
14
$69,379
8
$62,572
APPLICATIONS APPROVED, NOT ACCEPTED
1
$49,100
13
$89,545
22
$94,569
3
$50,810
1
$69,420
1
$65,810
APPLICATIONS DENIED
1
$100,390
12
$91,397
84
$106,141
21
$48,100
5
$77,384
2
$53,600
APPLICATIONS WITHDRAWN
2
$107,550
4
$111,265
35
$104,631
6
$74,958
2
$50,295
0
$0
FILES CLOSED FOR INCOMPLETENESS
0
$0
1
$151,400
10
$107,968
0
$0
0
$0
0
$0
Aggregated Statistics For Year 2006 (Based on 4 partial tracts)
A) FHA, FSA/RHS & VA Home Purchase Loans
B) Conventional Home Purchase Loans
C) Refinancings
D) Home Improvement Loans
F) Non-occupant Loans on < 5 Family Dwellings (A B C & D)
G) Loans On Manufactured Home Dwelling (A B C & D)
Number
Average Value
Number
Average Value
Number
Average Value
Number
Average Value
Number
Average Value
Number
Average Value
LOANS ORIGINATED
10
$111,784
82
$94,622
121
$103,210
14
$36,874
16
$75,457
8
$91,316
APPLICATIONS APPROVED, NOT ACCEPTED
2
$97,490
12
$95,543
26
$92,473
1
$27,690
4
$99,152
2
$103,100
APPLICATIONS DENIED
3
$103,317
16
$82,949
80
$95,257
20
$57,731
2
$85,465
7
$70,793
APPLICATIONS WITHDRAWN
0
$0
8
$102,195
44
$114,470
4
$62,898
2
$102,735
1
$78,970
FILES CLOSED FOR INCOMPLETENESS
0
$0
4
$85,928
16
$145,741
1
$33,460
0
$0
0
$0
Aggregated Statistics For Year 2005 (Based on 4 partial tracts)
A) FHA, FSA/RHS & VA Home Purchase Loans
B) Conventional Home Purchase Loans
C) Refinancings
D) Home Improvement Loans
F) Non-occupant Loans on < 5 Family Dwellings (A B C & D)
G) Loans On Manufactured Home Dwelling (A B C & D)
Number
Average Value
Number
Average Value
Number
Average Value
Number
Average Value
Number
Average Value
Number
Average Value
LOANS ORIGINATED
12
$98,376
92
$90,353
141
$96,870
20
$39,582
11
$65,951
13
$71,770
APPLICATIONS APPROVED, NOT ACCEPTED
2
$93,595
8
$72,175
25
$93,127
3
$41,067
2
$36,260
1
$97,250
APPLICATIONS DENIED
4
$86,115
21
$88,924
78
$94,883
16
$33,966
4
$70,268
7
$58,319
APPLICATIONS WITHDRAWN
0
$0
11
$83,078
51
$105,865
10
$158,480
1
$50,450
3
$100,417
FILES CLOSED FOR INCOMPLETENESS
0
$0
5
$71,512
8
$123,502
1
$98,090
3
$43,383
0
$0
Aggregated Statistics For Year 2004 (Based on 4 partial tracts)
A) FHA, FSA/RHS & VA Home Purchase Loans
B) Conventional Home Purchase Loans
C) Refinancings
D) Home Improvement Loans
F) Non-occupant Loans on < 5 Family Dwellings (A B C & D)
G) Loans On Manufactured Home Dwelling (A B C & D)
Number
Average Value
Number
Average Value
Number
Average Value
Number
Average Value
Number
Average Value
Number
Average Value
LOANS ORIGINATED
14
$85,989
72
$94,393
158
$88,644
19
$30,332
17
$57,358
10
$65,301
APPLICATIONS APPROVED, NOT ACCEPTED
2
$73,790
9
$92,900
20
$88,834
2
$50,660
0
$0
2
$63,250
APPLICATIONS DENIED
5
$85,438
20
$65,897
80
$86,888
9
$22,364
1
$25,590
6
$66,200
APPLICATIONS WITHDRAWN
2
$137,350
6
$90,045
74
$93,961
1
$47,160
0
$0
3
$79,700
FILES CLOSED FOR INCOMPLETENESS
0
$0
2
$59,085
7
$73,481
0
$0
0
$0
0
$0
Aggregated Statistics For Year 2003 (Based on 2 partial tracts)
A) FHA, FSA/RHS & VA Home Purchase Loans
B) Conventional Home Purchase Loans
C) Refinancings
D) Home Improvement Loans
F) Non-occupant Loans on < 5 Family Dwellings (A B C & D)
Number
Average Value
Number
Average Value
Number
Average Value
Number
Average Value
Number
Average Value
LOANS ORIGINATED
5
$92,052
19
$88,225
86
$87,001
6
$25,570
4
$56,165
APPLICATIONS APPROVED, NOT ACCEPTED
0
$0
2
$72,765
9
$93,127
1
$10,730
0
$0
APPLICATIONS DENIED
1
$55,050
2
$86,625
21
$81,018
2
$30,055
1
$42,100
APPLICATIONS WITHDRAWN
0
$0
2
$157,465
13
$77,768
0
$0
0
$0
FILES CLOSED FOR INCOMPLETENESS
0
$0
1
$64,160
3
$84,940
0
$0
0
$0
Aggregated Statistics For Year 2002 (Based on 2 partial tracts)
A) FHA, FSA/RHS & VA Home Purchase Loans
B) Conventional Home Purchase Loans
C) Refinancings
D) Home Improvement Loans
F) Non-occupant Loans on < 5 Family Dwellings (A B C & D)
Number
Average Value
Number
Average Value
Number
Average Value
Number
Average Value
Number
Average Value
LOANS ORIGINATED
8
$83,238
17
$66,221
62
$82,553
6
$13,392
4
$56,268
APPLICATIONS APPROVED, NOT ACCEPTED
0
$0
2
$81,365
6
$97,490
1
$7,890
0
$0
APPLICATIONS DENIED
1
$98,570
2
$92,900
16
$82,288
3
$12,143
1
$63,150
APPLICATIONS WITHDRAWN
0
$0
2
$82,075
6
$88,213
1
$8,700
0
$0
FILES CLOSED FOR INCOMPLETENESS
0
$0
0
$0
1
$78,530
0
$0
0
$0
Aggregated Statistics For Year 2001 (Based on 2 partial tracts)
A) FHA, FSA/RHS & VA Home Purchase Loans
B) Conventional Home Purchase Loans
C) Refinancings
D) Home Improvement Loans
F) Non-occupant Loans on < 5 Family Dwellings (A B C & D)
Number
Average Value
Number
Average Value
Number
Average Value
Number
Average Value
Number
Average Value
LOANS ORIGINATED
10
$68,148
13
$81,583
48
$79,311
5
$32,626
4
$50,145
APPLICATIONS APPROVED, NOT ACCEPTED
0
$0
2
$73,170
8
$78,380
0
$0
0
$0
APPLICATIONS DENIED
0
$0
3
$59,777
18
$73,190
3
$12,077
1
$61,530
APPLICATIONS WITHDRAWN
1
$44,530
1
$102,210
11
$73,030
0
$0
0
$0
FILES CLOSED FOR INCOMPLETENESS
0
$0
1
$29,750
2
$83,185
0
$0
0
$0
Aggregated Statistics For Year 2000 (Based on 2 partial tracts)
A) FHA, FSA/RHS & VA Home Purchase Loans
B) Conventional Home Purchase Loans
C) Refinancings
D) Home Improvement Loans
F) Non-occupant Loans on < 5 Family Dwellings (A B C & D)
Number
Average Value
Number
Average Value
Number
Average Value
Number
Average Value
Number
Average Value
LOANS ORIGINATED
7
$79,370
16
$73,534
19
$63,223
8
$15,889
5
$48,738
APPLICATIONS APPROVED, NOT ACCEPTED
0
$0
1
$98,770
4
$47,970
2
$11,130
0
$0
APPLICATIONS DENIED
1
$51,210
3
$52,287
10
$56,206
3
$18,687
0
$0
APPLICATIONS WITHDRAWN
0
$0
1
$88,850
6
$49,892
0
$0
1
$27,530
FILES CLOSED FOR INCOMPLETENESS
0
$0
1
$35,620
1
$53,030
0
$0
0
$0
Aggregated Statistics For Year 1999 (Based on 1 partial tract)
A) FHA, FSA/RHS & VA Home Purchase Loans
B) Conventional Home Purchase Loans
C) Refinancings
D) Home Improvement Loans
F) Non-occupant Loans on < 5 Family Dwellings (A B C & D)
Detailed PMIC statistics for the following Tracts:4027.01
, 9566.00
2002 - 2018 National Fire Incident Reporting System (NFIRS) incidents
Based on the data from the years 2002 - 2018 the average number of fires per year is 35. The highest number of reported fire incidents - 58 took place in 2018, and the least - 23 in 2008. The data has an increasing trend.
When looking into fire subcategories, the most incidents belonged to: Structure Fires (48.7%), and Outside Fires (34.3%).
Fire incident types reported to NFIRS in Zip Code 62012


 Nearest zip codes: 62079, 62002, 62030, 62035, 62018, 62063.


 Based on the data from the years 2002 - 2018 the average number of fires per year is 35. The highest number of reported fire incidents - 58 took place in 2018, and the least - 23 in 2008. The data has an increasing trend.
 When looking into fire subcategories, the most incidents belonged to: Structure Fires (48.7%), and Outside Fires (34.3%).