Estimated zip code population in 2022: 906 Zip code population in 2010: 713 Zip code population in 2000: 388
Houses and condos: 375 Renter-occupied apartments: 82
% of renters here:
23%
State:
33%
March 2022 cost of living index in zip code 62046: 94.0 (less than average, U.S. average is 100)
Land area: 0.8 sq. mi. Water area: 0.0 sq. mi.
Population density: 1,142 people per square mile
(low).
OSM Map
General Map
Google Map
MSN Map
OSM Map
General Map
Google Map
MSN Map
OSM Map
General Map
Google Map
MSN Map
OSM Map
General Map
Google Map
MSN Map
Please wait while loading the map...
Real estate property taxes paid for housing units in 2022:
This zip code:
1.8% ($4,185)
Illinois:
2.0% ($4,912)
Median real estate property taxes paid for housing units with mortgages in 2022: $4,545 (1.8%) Median real estate property taxes paid for housing units with no mortgage in 2022: $2,162 (1.4%)
Business Search- 14 Million verified businesses
Males: 396
(43.8%)
Females: 509
(56.2%)
For population 25 years and over in 62046:
High school or higher: 98.3%
Bachelor's degree or higher: 42.3%
Graduate or professional degree: 10.7%
Unemployed: 0.3%
Mean travel time to work (commute): 25.4 minutes
For population 15 years and over in 62046:
Never married: 30.6%
Now married: 51.0%
Separated: 0.0%
Widowed: 11.6%
Divorced: 6.8%
Zip code 62046 compared to state average:
Unemployed percentage significantly below state average.
Black race population percentage significantly below state average.
Hispanic race population percentage significantly below state average.
Median age below state average.
Foreign-born population percentage significantly below state average.
Estimated median house/condo value in 2022: $236,763
62046:
$236,763
Illinois:
$251,600
According to our research of Illinois and other state lists, there was 1 registered sex offender living in 62046 zip code as of May 28, 2024. The ratio of all residents to sex offenders in zip code 62046 is 912 to 1. The ratio of registered sex offenders to all residents in this zip code is near the state average.
Median resident age:
This zip code:
34.9 years
Illinois median age:
39.1 years
Average household size:
This zip code:
2.5 people
Illinois:
2.4 people
Averages for the 2004 tax year for zip code 62046, filed in 2005:
Average Adjusted Gross Income (AGI) in 2004: $54,906 (Individual Income Tax Returns)
Here:
$54,906
State:
$54,625
Salary/wage: $49,955 (reported on 86.2% of returns)
Here:
$49,955
State:
$46,811
(% of AGI for various income ranges: 85.1% for AGIs below $10k, 63.1% for AGIs $10k-25k, 80.1% for AGIs $25k-50k, 79.4% for AGIs $50k-75k, 84.9% for AGIs $75k-100k, 73.5% for AGIs over 100k)
Taxable interest for individuals: $1,721 (reported on 58.7% of returns)
This zip code:
$1,721
Illinois:
$2,101
(% of AGI for various income ranges: 5.4% for AGIs below $10k, 6.8% for AGIs $10k-25k, 2.5% for AGIs $25k-50k, 0.3% for AGIs $50k-75k, 0.6% for AGIs $75k-100k, 2.8% for AGIs over 100k)
Taxable dividends: $2,588 (reported on 29.6% of returns)
Here:
$2,588
State:
$4,306
(% of AGI for various income ranges: 1.0% for AGIs $10k-25k, 0.5% for AGIs $25k-50k, 0.5% for AGIs $50k-75k, 0.4% for AGIs $75k-100k, 3.7% for AGIs over 100k)
Net capital gain/loss: +$1,844 (reported on 23.4% of returns)
Here:
+$1,844
State:
+$17,321
(% of AGI for various income ranges: -1.0% for AGIs $10k-25k, 0.5% for AGIs $25k-50k, 1.8% for AGIs $50k-75k, 0.0% for AGIs $75k-100k, 1.2% for AGIs over 100k)
Profit/loss from business: +$3,043 (reported on 12.2% of returns)
Here:
+$3,043
State:
+$11,771
Total itemized deductions: $13,750 (17% of AGI, reported on 42.6% of returns)
Here:
$13,750
State:
$20,239
Here:
17.0% of AGI
State:
19.5% of AGI
(% of AGI for various income ranges: 64.9% for AGIs below $10k, 10.7% for AGIs $25k-50k, 12.7% for AGIs $50k-75k, 12.6% for AGIs $75k-100k, 7.6% for AGIs over 100k)
Charity contributions deductions: $2,358 (3% of AGI, reported on 34.8% of returns)
Here:
$2,358
State:
$3,719
Here:
2.7% of AGI
State:
3.4% of AGI
(% of AGI for various income ranges: 16.7% for AGIs below $10k, 0.9% for AGIs $25k-50k, 1.2% for AGIs $50k-75k, 1.2% for AGIs $75k-100k, 2.2% for AGIs over 100k)
Total tax: $7,557 (reported on 86.8% of returns)
62046:
$7,557
State:
$9,882
(% of AGI for various income ranges: 3.6% for AGIs below $10k, 3.6% for AGIs $10k-25k, 7.9% for AGIs $25k-50k, 9.0% for AGIs $50k-75k, 10.3% for AGIs $75k-100k, 20.0% for AGIs over 100k)
Earned income credit: $1,500 (reported on 7.8% of returns)
Here:
$1,500
State:
$1,788
Percentage of individuals using paid preparers for their 2004 taxes: 63.9%
Here:
64%
State:
61%
(% for various income ranges: 63.0% for AGIs below $10k, 56.5% for AGIs $10k-25k, 70.8% for AGIs $25k-50k, 62.0% for AGIs $50k-75k, 63.3% for AGIs $75k-100k, 62.5% for AGIs over 100k)
Household received Food Stamps/SNAP in the past 12 months: 4 Household did not receive Food Stamps/SNAP in the past 12 months: 344
Women who had a birth in the past 12 months: 13 (10 now married, 2 unmarried) Women who did not have a birth in the past 12 months: 239 (112 now married, 126 unmarried)
Housing units in zip code 62046 with a mortgage: 165 (9 second mortgage, 9 both second mortgage and home equity loan) Houses without a mortgage: 8
Median monthly owner costs for units with a mortgage: $1,719 Median monthly owner costs for units without a mortgage: $556
Residents with income below the poverty level in 2022:
This zip code:
2.9%
Whole state:
11.9%
Residents with income below 50% of the poverty level in 2022:
This zip code:
1.0%
Whole state:
5.7%
Median number of rooms in houses and condos:
Here:
6.0
State:
6.4
Median number of rooms in apartments:
Here:
4.2
State:
4.1
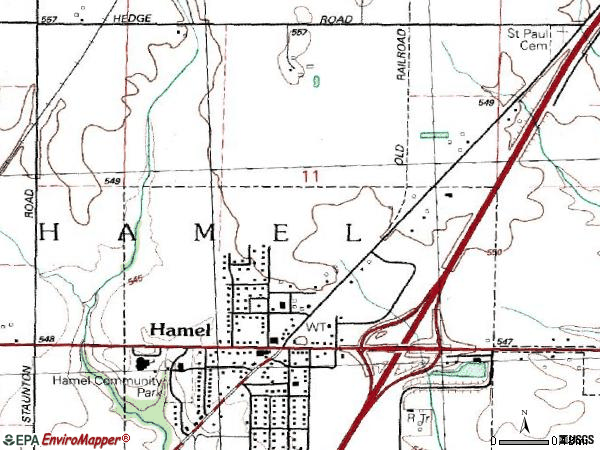
Notable locations in this zip code not listed on our city pages
Notable locations in zip code 62046: Hamel Community Center (A), Alhambra - Hamel Ambulance Service (B), Hamel Community Fire Protection District (C). Display/hide their locations on the map
Size of family households: 44 2-persons, 40 3-persons, 69 4-persons, 40 5-persons, 7 6-persons, 1 7-or-more-persons
Size of nonfamily households: 140 1-person, 8 3-persons
221 married couples with children.
40 single-parent households (8 men, 32 women).
97.7% of residents of 62046 zip code speak English at home.
0.9% of residents speak other Indo-European language at home (100% very well).
0.5% of residents speak other language at home (100% well).
Foreign born population: 12 (1.3%) (75.2% of them are naturalized citizens)
This zip code:
1.3%
Whole state:
14.4%
50%France
42%Tanzania
41%German
12%Norwegian
10%American
6%Irish
5%European
3%English
1%Croatian
Year of entry for the foreign-born population
02010 or later
22000 to 2009
41990 to 1999
3Before 1990
Facilities with environmental interests located in this zip code:
READY MIX SERVICE INC (229 N OLD US ROUTE 66 in HAMEL, IL)
STATE MASTER (Illinois EPA Project) - AIR PROGRAM AIR MINOR (AIRS/AFS) CRITERIA AND HAZARDOUS AIR POLLUTANT INVENTORY (Inventory of air pollution sources) National Pollutant Discharge Elimination System NON-MAJOR (Tracking pollutant discharge elimination systems) - permit (Resource Conservation and Recovery Act (tracking hazardous waste)) Business SIC classification: READY-MIXED CONCRETE Organizations: READY MIX SERVICE, INC. (CONTACT/OWNER)
, READY MIX SERVICE, INC. (CONTACT/OWNER)
HAMEL STP (P.O. BOX 345 in HAMEL, IL)
STATE MASTER (Illinois EPA Project) - National Pollutant Discharge Elimination System Permit National Pollutant Discharge Elimination System NON-MAJOR (Tracking pollutant discharge elimination systems) - permit Business SIC classification: SEWERAGE SYSTEMS Alternative names: HAMEL STP, VILLAGE OF
INTERSTATE RECYCLE CORP (402 OLD RT. 66 in HAMEL, IL)
STATE MASTER (Illinois EPA Project) - AIR PROGRAM AIR MINOR (AIRS/AFS) Business SIC classification: NONCLASSIFIABLE ESTABLISHMENTS
HAMEL ELEMENTARY SCHOOL (BOX 157 400 W STATE in HAMEL, IL)
(Geographic Names Information System) (National Center for Education Statistics) - STATE ID-4105700702008 Organizations: EDWARDSVILLE C U SCHOOL DIST 7 (SCHOOL DISTRICT)
IDOT (BRG 0600181 in HAMEL, IL)
(Resource Conservation and Recovery Act (tracking hazardous waste))
HAMEL CO-OP GRAIN CO (PO BOX 8 in HAMEL, IL)
AIR MINOR (AIRS/AFS) CRITERIA AND HAZARDOUS AIR POLLUTANT INVENTORY (Inventory of air pollution sources) Business SIC classification: GRAIN AND FIELD BEANS
JEMENI CUTTING TOOLS (7 WEST STATE ST in HAMEL, IL)
Conditionally Exempt Small Quantity Generators, less than 100 kg/month of hazardous waste (Resource Conservation and Recovery Act (tracking hazardous waste)) Organizations: PANTER JIM (CONTACT/OWNER)
ILDOT FAI RTE 55 (FROM IL RTE 140 TO TR251 A in HAMEL, IL)
Small Quantity Generators, between 100 kg and 1000 kg of hazardous waste/month (Resource Conservation and Recovery Act (tracking hazardous waste)) - notification
Housing units lacking complete plumbing facilities: 2.8% Housing units lacking complete kitchen facilities: 5.3%
75.0%Utility gas
20.7%Electricity
3.2%Bottled, tank, or LP gas
1.4%No fuel used
Population in 1990: 1,685.
Place of birth for U.S.-born residents:
This state: 654
Northeast: 12
Midwest: 209
South: 15
West: 2
49% of the 62046 zip code residents lived in the same house 5 years ago. Out of people who lived in different houses, 71% lived in this county. Out of people who lived in different counties, 50% lived in Illinois.
90% of the 62046 zip code residents lived in the same house 1 year ago. Out of people who lived in different houses, 73% moved from this county. Out of people who lived in different houses, 16% moved from different county within same state. Out of people who lived in different houses, 6% moved from different state.
Private vs. public school enrollment:
Students in private schools in grades 1 to 8 (elementary and middle school): 24
Here:
21.6%
Illinois:
13.3%
Students in private schools in grades 9 to 12 (high school): 8
Here:
10.4%
Illinois:
9.9%
Students in private undergraduate colleges: 1
Here:
3.5%
Illinois:
27.4%
Occupation by median earnings in the past 12 months ($)
107,103Health diagnosing and treating practitioners and other technical occupations
105,998Management occupations
97,597Computer and mathematical occupations
88,162Construction and extraction occupations
80,866Sales and related occupations
75,473Business and financial operations occupations
Top industries in this zip code by the number of employees in 2005:
Wholesale Trade: Farm and Garden Machinery and Equipment Merchant Wholesalers (20-49 employees: 1 establishment, 10-19 employees: 1 establishment)
Construction: Commercial and Institutional Building Construction (10-19: 2)
Construction: Plumbing, Heating, and Air-Conditioning Contractors (10-19: 1)
Accommodation and Food Services: Full-Service Restaurants (10-19: 1)
Finance and Insurance: Insurance Agencies and Brokerages (5-9: 1)
Home Mortgage Disclosure Act Aggregated Statistics For Year 2009 (Based on 2 partial tracts)
A) FHA, FSA/RHS & VA Home Purchase Loans
B) Conventional Home Purchase Loans
C) Refinancings
Number
Average Value
Number
Average Value
Number
Average Value
LOANS ORIGINATED
1
$101,910
1
$155,470
8
$144,508
APPLICATIONS APPROVED, NOT ACCEPTED
0
$0
0
$0
1
$101,130
APPLICATIONS DENIED
0
$0
0
$0
1
$193,970
APPLICATIONS WITHDRAWN
0
$0
0
$0
1
$140,830
FILES CLOSED FOR INCOMPLETENESS
0
$0
0
$0
0
$0
Aggregated Statistics For Year 2008 (Based on 2 partial tracts)
A) FHA, FSA/RHS & VA Home Purchase Loans
B) Conventional Home Purchase Loans
C) Refinancings
D) Home Improvement Loans
F) Non-occupant Loans on < 5 Family Dwellings (A B C & D)
Number
Average Value
Number
Average Value
Number
Average Value
Number
Average Value
Number
Average Value
LOANS ORIGINATED
1
$85,380
2
$127,970
5
$147,470
1
$35,440
1
$46,810
APPLICATIONS APPROVED, NOT ACCEPTED
0
$0
0
$0
0
$0
0
$0
0
$0
APPLICATIONS DENIED
0
$0
0
$0
1
$164,860
0
$0
0
$0
APPLICATIONS WITHDRAWN
0
$0
0
$0
1
$100,050
0
$0
0
$0
FILES CLOSED FOR INCOMPLETENESS
0
$0
0
$0
0
$0
0
$0
0
$0
Aggregated Statistics For Year 2007 (Based on 2 partial tracts)
B) Conventional Home Purchase Loans
C) Refinancings
D) Home Improvement Loans
Number
Average Value
Number
Average Value
Number
Average Value
LOANS ORIGINATED
2
$129,130
4
$126,040
1
$56,140
APPLICATIONS APPROVED, NOT ACCEPTED
0
$0
0
$0
0
$0
APPLICATIONS DENIED
0
$0
2
$116,725
0
$0
APPLICATIONS WITHDRAWN
0
$0
1
$130,860
0
$0
FILES CLOSED FOR INCOMPLETENESS
0
$0
0
$0
0
$0
Aggregated Statistics For Year 2006 (Based on 2 partial tracts)
B) Conventional Home Purchase Loans
C) Refinancings
D) Home Improvement Loans
Number
Average Value
Number
Average Value
Number
Average Value
LOANS ORIGINATED
3
$118,620
4
$99,225
1
$28,950
APPLICATIONS APPROVED, NOT ACCEPTED
0
$0
1
$60,860
0
$0
APPLICATIONS DENIED
0
$0
1
$161,340
0
$0
APPLICATIONS WITHDRAWN
0
$0
1
$117,560
0
$0
FILES CLOSED FOR INCOMPLETENESS
0
$0
0
$0
0
$0
Aggregated Statistics For Year 2005 (Based on 2 partial tracts)
B) Conventional Home Purchase Loans
C) Refinancings
D) Home Improvement Loans
Number
Average Value
Number
Average Value
Number
Average Value
LOANS ORIGINATED
3
$142,907
5
$122,068
1
$35,440
APPLICATIONS APPROVED, NOT ACCEPTED
0
$0
0
$0
0
$0
APPLICATIONS DENIED
1
$45,540
1
$140,020
0
$0
APPLICATIONS WITHDRAWN
0
$0
1
$113,020
0
$0
FILES CLOSED FOR INCOMPLETENESS
0
$0
0
$0
0
$0
Aggregated Statistics For Year 2004 (Based on 2 partial tracts)
B) Conventional Home Purchase Loans
C) Refinancings
D) Home Improvement Loans
Number
Average Value
Number
Average Value
Number
Average Value
LOANS ORIGINATED
5
$110,272
5
$127,420
1
$35,040
APPLICATIONS APPROVED, NOT ACCEPTED
1
$60,280
0
$0
0
$0
APPLICATIONS DENIED
0
$0
1
$119,540
0
$0
APPLICATIONS WITHDRAWN
0
$0
1
$132,520
0
$0
FILES CLOSED FOR INCOMPLETENESS
0
$0
0
$0
0
$0
Aggregated Statistics For Year 2003 (Based on 2 partial tracts)
B) Conventional Home Purchase Loans
C) Refinancings
Number
Average Value
Number
Average Value
LOANS ORIGINATED
3
$118,337
11
$112,976
APPLICATIONS APPROVED, NOT ACCEPTED
0
$0
1
$95,290
APPLICATIONS DENIED
0
$0
2
$74,310
APPLICATIONS WITHDRAWN
0
$0
1
$117,160
FILES CLOSED FOR INCOMPLETENESS
0
$0
0
$0
Aggregated Statistics For Year 2002 (Based on 2 partial tracts)
B) Conventional Home Purchase Loans
C) Refinancings
Number
Average Value
Number
Average Value
LOANS ORIGINATED
2
$119,855
7
$109,686
APPLICATIONS APPROVED, NOT ACCEPTED
0
$0
1
$74,750
APPLICATIONS DENIED
0
$0
1
$96,010
APPLICATIONS WITHDRAWN
0
$0
1
$85,670
FILES CLOSED FOR INCOMPLETENESS
0
$0
0
$0
Aggregated Statistics For Year 2001 (Based on 2 partial tracts)
B) Conventional Home Purchase Loans
C) Refinancings
Number
Average Value
Number
Average Value
LOANS ORIGINATED
3
$84,900
6
$106,787
APPLICATIONS APPROVED, NOT ACCEPTED
0
$0
0
$0
APPLICATIONS DENIED
1
$30,840
1
$93,630
APPLICATIONS WITHDRAWN
0
$0
1
$75,960
FILES CLOSED FOR INCOMPLETENESS
0
$0
0
$0
Aggregated Statistics For Year 2000 (Based on 2 partial tracts)
B) Conventional Home Purchase Loans
C) Refinancings
D) Home Improvement Loans
Number
Average Value
Number
Average Value
Number
Average Value
LOANS ORIGINATED
2
$114,490
2
$81,825
1
$18,160
APPLICATIONS APPROVED, NOT ACCEPTED
0
$0
0
$0
0
$0
APPLICATIONS DENIED
0
$0
1
$57,540
0
$0
APPLICATIONS WITHDRAWN
0
$0
0
$0
0
$0
FILES CLOSED FOR INCOMPLETENESS
0
$0
0
$0
0
$0
Aggregated Statistics For Year 1999 (Based on 1 partial tract)

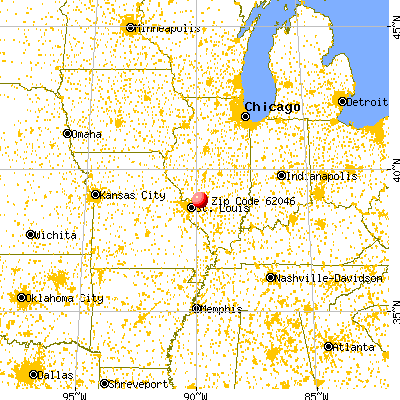


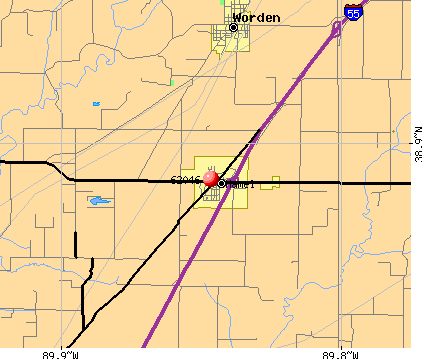 Nearest zip codes: 62097, 62001, 62025, 62058, 62061, 62088.